GaWx
-
Posts
17,544 -
Joined
Content Type
Profiles
Blogs
Forums
American Weather
Media Demo
Store
Gallery
Everything posted by GaWx
-
The 12Z GEFS starts to establish a strong Aleutian Low toward the end of the run (Feb 10-11), which would be right on schedule with regard to the longer term long modeled more favorable pattern getting established for mid to late month. I’m not trusting it but I’d rather see it than not. So far, no can kicking…fingers crossed.
-
The 12Z GEFS run suggests a good chance for no more widespread multiple day warmth for quite awhile in the bulk of the SE (including NC/VA lol) after this weekend. We’ll see though as ensemble means smooth out extremes due to timing differences. It wouldn’t surprise me if there are still a couple of warm ones sneaking in during Feb 1-10 before the hoped change to more sustained BN soon after.
-
-Jan 1-25 has averaged +1.86 on the cyclonicwx.com’s OISST. -The Nov and Dec ERSST combined averaged +2.045. That means that Jan ERSST needs to average +1.90+ to end up with a +2.00+ NDJ ONI (super Nino). -ERSST averaged 0.08 warmer than OISST Aug-Dec. -If I assume that ERSST/OISST relationship were to hold in Jan, that would mean that the Jan OISST would only need to average +1.82+ to end up with a +2.00+ NDJ ONI. Compare that to the +1.86 for Jan 1-25. -What is needed during Jan 26-31 to bring the full Jan OISST down to +1.81 or lower? That would require Jan 26-31 OISST to be cooler than ~+1.65, perhaps near +1.62. -The last week has averaged only ~+1.625 with yesterday’s +1.59 being the coolest in months. -If Jan 26-31 were to rise back to an average of +1.65, a pretty difficult task as of now, the Jan OISST would end up at +1.82. Under the assumption of the Jan ERSST being 0.08 warmer than OISST, that would mean a NDJ ONI right at +2.00 (super). But if Jan 26-31 OISST were to instead average only +1.60 (near where it is now), Jan OISST would end up at +1.81 and NDJ ONI would end up at +1.99 (a hair cooler than super). -So, it is literally down to the wire. These next 6 days could be crucial! Of course, if the ERSST/OISST relationship for Jan were to change much from the 0.08 difference of the prior 5 months, that could change things, too.
-
Indeed, at this link, DT’s quite different: https://wxrisk.com/operational-weather-forecasts/ The Middle Atlantic Operational Forecast includes coverage for the next two weeks. It is an all-purpose forecast that covers: West Virginia North Carolina Virginia Maryland Delaware
-
DT actually includes all of NC as Mid-Atlantic. For example, Charlotte is included. Also, I didn’t know that WPC includes NC in it. What a difference in what they consider SE vs what the SE includes here.
-
I just went to DT’s site and sure enough I see he has NC in what he calls the Mid Atlantic region. So, NC can now relax since he’s including it for wintry potential lol. He has DE as the most N state in the M.A. and excludes NJ, PA, and NY, which are normally included. I’ll just say that his definition of M.A. is highly unusual in that it is centered much further S than in any other case I’ve seen it used.
-
But our SE subforum of AmericanWx has not only NC but also VA. So, even VA is included in many other cases as SE, not mid Atlantic. Some do count VA as being in the southern Mid Atlantic. If DT’s considering NC as S Mid Atlantic, he’s off imo. The link below has VA in pink, which it is calling S Mid Atlantic: https://en.m.wikipedia.org/wiki/Mid-Atlantic_(United_States)
-
Regarding the bolded, that would just make the already frustrated NC folks that much madder as that’s exactly what happened in the middle of this month. The sanitarium thread would be overwhelmed!
-
Jan/Early Feb Medium/Long Range Discussion Part 3
GaWx replied to WinterWxLuvr's topic in Mid Atlantic
1. Having 2009-10 as just moderate in that isn’t consistent as the ONI peaked at +1.6 and was still +1.5 during DJF. That’s a “strong” peak, not moderate. 2. That also has 1972-3 as only strong despite an ONI peak of +2.1, which means it actually had a “very strong” peak. So again not consistent. -
The 12Z GEFS by a good margin has the lowest H5 hts, the coldest 850 mb/2M temperatures, and the heaviest qpf in the SE of any run to date for Feb 4-6. Unlike prior runs, it has many members with an E GOM low that then crosses the FL pen. To clarify, the run isn’t suggesting this would likely be cold enough for wintry precip. as the surface cold air supply is lacking. But it does suggest there’d likely be no warmth around this period if it were to verify. 18Z GEFS is similar to the 12Z
-
RDU 6 coldest Febs since 1980 were all during El Nino: 2015, 1980, 2010, 1987, 1983, 2007
-
I realize the 6Z GFS is a cold outlier and thus of course don't buy it, but fwiw it only barely gets RDU to just over 50 only one day after Jan 28. IF it were to somehow verify closely and considering the cold potential of mid to late Feb, the chances for the coldest SE US Feb overall since 2015 would be greatly increased. That was during another El Nino.
-
1. I’ve got my flame-proof suit on! Take the following new (1/24) EW maps with a HUGE grain. They may end up way off like the late Dec/early Jan runs. They’re far from trustworthy. 2. So, fwiw, the last 3 weeks of the run are each the coldest yet of their respective weeks. Even though they’re not even close to being trustworthy, I still prefer seeing them with BN dominating and like seeing the cold signal strengthening, especially since El Niño climo would support it. Feb 12-19: only 1 close to this cold is 1/21 run: Feb 19-26: by far coldest run going back 2 weeks Feb 19-26 precip: ~1” ATL, 1.5” Gainesville, FL (fwiw)

-
1. The Euro Weeklies (EW) from late Dec were overall WAY off for mid Jan to early Feb but it wasn’t just in the too cold direction. 2. The week of Jan 15-22 ended up WAY too warm on the EW in late Dec, less than 3 weeks out. It later corrected and ended up ~6 BN at RDU, very accurate: 3. Here’s the map I was referring to (in the post you quoted) with a strong signal for cold in the final week of the 12/31/23 EW (for Feb 5-12), which as of now is likely to bust way too cold: 4. The EW from many late Dec/very early Jan runs for Jan 22-29 will end up busting WAY too cold as many runs had NN well inland to BN nearer to the SE coast. However, as Jan 15-22 corrected much colder, Jan 22-29 soon after started correcting much warmer and has since been warm for many runs. It is almost as if once the Ninalike (coldest Plains/MW) extreme cold of Jan 15-22 was seen, the outlook to much warmer following it started to also be seen soon afterward. 5. The week of Jan 29-Feb 5, which was also NN well inland to BN nearer to coast on runs in late Dec/very early Jan is still in some doubt as a good number of recent GFS runs have been no warmer than NN in much of the SE, largely helped by cold CAD. You even said this just 2 days ago: “Well the idea of 3 weeks of solid warmth is getting derailed at least in the ops. Canadian actually first to pick up on the cooler first week of Feb (it’s backed off somewhat). GFS has trended way colder.” 6. The Weeklies from late Dec/early Jan weren’t quite screaming BN the whole period in the entire SE, but rather mainly NN well inland to BN nearer to coast other than all solidly BN Feb 5-12. Still way off though (much too cold Jan 22-29 and probably Feb 5-12 and much too warm Jan 15-22 with Jan 29-Feb 5 still in doubt). 7. I never trust models in week 2, much less extended models. I just use them as guidance in combo with climo, analogs, etc. 8. The main purpose of this thread is supposed to be to discuss what each of us sees down the road as possibilities, whatever they may be. We’ll always have different takes, which makes for good discussion as long as it doesn’t deteriorate into too much confrontation/negativity toward each other. The posts made out of frustration have a better place, the Sanitarium thread. The most enjoyable part for me is to try to sniff out pattern changes well in advance by using history/climo as a guide. 9. Most of NC missing SN mid Jan has little bearing on their chances of getting it mid Feb to early Mar imho, especially in a moderate+ Nino.

-
1. The SPV is still strong on these maps. 2. Euro Weeklies from yesterday show very little chance for wind reversal throughout run. 3. Yesterday’s extended GEFS shows slight chance (1 in 6) for reversal Feb 13-19, likely related to the progression of this Siberian warming shown on Feb 9. So, something to watch for then. 4. Should that occur, it would be similar to the timing of the 2/16/23 major SSW, which had delayed results as a result of an ongoing strong -PNA. It eventually lead to one cold week in mid March, especially in the SE vs normals. So, that one took ~3.5 weeks to result in E US cold, longer than the ~2 week average. 5. If there were to be a major SSW in mid Feb, the most likely start time for its effects on the E US would be near late Feb to ~Mar 1. However, models already have a -AO starting in early Feb and which will likely already be in place in mid to late Feb per extended models along with the potential return of a long period of E US cold into early Mar. If so, it may be hard to distinguish effects of any possible mid Feb major SSW.
-
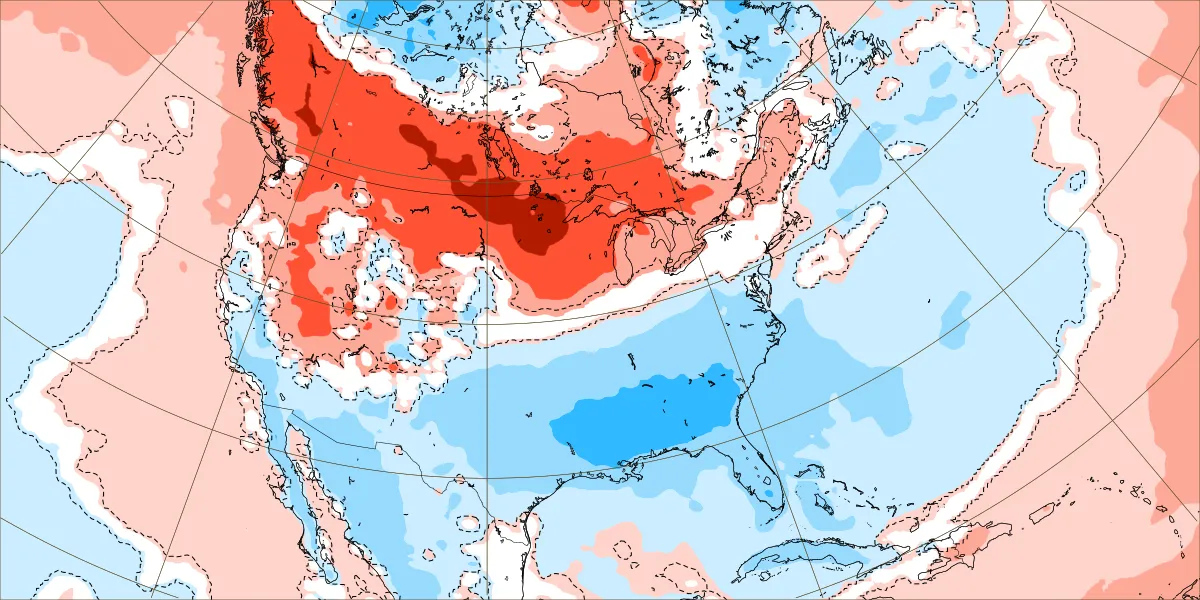
The just released extended GEFS is as cold as any run yet for mid to late Feb in the SE and much of the E and C US for that matter. For example, this is very impressive cold for an ensemble mean of 31 members way out on day 27 with these 850 mb anomalies as cold as -7C/-13F! Looking at individual members and considering the degree of cold and the pattern, this run has two main periods that suggest a significantly enhanced chance vs climo for a GOM Miller A/widespread major SE winter storm, Feb 18-19 and Feb 23-24: The exact dates aren’t important as they’ll change with each run. What’s important is the pattern showing up for mid to late Feb on the various extended models for ~10 days of runs now. Not only are they not backing down, the start of the pattern change is gradually moving earlier. This run has the +PNA starting to get reestablished ~Feb 8th. The run from 5 days earlier didn’t have the +PNA getting going til ~Feb 13. But also, the cold signal is generally getting stronger as we get closer.
-
Don, Keep in mind (which I assume you are) that this very warm CFS Feb map is taking into account the first half of the month being forecasted to be much warmer than normal from the Midwest to the NE. The 2nd half, which I know you alluded to, is forecasted by the same model to be much colder than that in those areas but not cold enough (as of the latest) to keep the Feb average from ending up AN in NYC.
-
January Medium-Long Range Discussion
GaWx replied to Holston_River_Rambler's topic in Tennessee Valley
Mid Feb is still plenty early enough to potentially result in a several week long period dominated by cold and periods of wintry precip, which has occurred in the SE US during a good number of El Ninos. The extended models are targeting the 3 weeks from mid Feb through early Mar. -
January Medium-Long Range Discussion
GaWx replied to Holston_River_Rambler's topic in Tennessee Valley
Thanks for posting this. I need to also add that the maps I posted are for all ENSO rather than just El Niño, which itself tends to have lower heights in the S US especially in Feb. -
Thank you! Where can I sign up for this that just came out from the newest 48 CFS run mean for mid Feb (Feb 13-19)? It has -EPO, +PNA, -AO, -NAO, and the very important and sometimes overlooked split flow (moist subtropical jet underneath and overrunning the bottom of the cold air supply from +PNA) with a good moisture source coming across from Baja CA. This pattern should it materialize would favor any Arctic high to move from the N Plains to near the Ohio Valley as opposed to the colder but drier option of plunging down into the S Plains. What more could one want in terms of overall pattern for SE winter storm potential other than needing to be patient since it would take ~3 weeks to get established? By the way, that timeframe continues to move up as it was 4+ weeks away when I first started seeing it on the extended models over a week ago.
-
January Medium-Long Range Discussion
GaWx replied to Holston_River_Rambler's topic in Tennessee Valley
This is from NOAA fwiw for JFM averaged out for temperatures: phase 7 near normal to temperatures (within 2F) but that’s for those three months combined and also aren’t heights: -
January Medium-Long Range Discussion
GaWx replied to Holston_River_Rambler's topic in Tennessee Valley
http://www.bom.gov.au/climate/mjo/ -
As one who lives near the coast, I sure hope Matt is right! Also, El Niño late Februarys and Marches tend to be cold/BN in the SE. That would hopefully keep the GOM temps in check at least at first.
-
January Medium-Long Range Discussion
GaWx replied to Holston_River_Rambler's topic in Tennessee Valley
I can’t take credit for the phase 7 snow analysis. I believe that was from Eric Webb and specifically was addressing NC, possibly only at Raleigh. Also, I can’t recall whether or not Eric was looking only at El Niño cases. My big thing in recent years of MJO analyses for the SE has been to harp on the tendency for cold and wintry wx to favor weak MJO: just outside, near, or inside the circle. For example, off the top of my head I recall discovering that every major ATL ZR and IP (as far back as MJO charts go, which is mid 1970s) has been when the MJO was weak. I’m sure that streak will end at some point as the sample size isn’t large (I think it is only 8), but OTOH it makes sense that it would favor weak since weak tends to be colder than strong. Also, I wasn’t looking specifically at the TN Valley, which may be quite different. -
12Z GFS still has only 6 mild to warm afternoons in NC: Jan 24-28 and Feb 2 out of 16 days. Also, 4 afternoons are actually cold. And this is well before the modeled/supposed good stuff starts after Feb 10, which hopefully would start showing up near the end of the 15-16 day ensemble runs by this weekend. That’s been the timeframe for that for many days. I’ve been posting about this extended model based potential for ~10 days. No slippage yet.