

GaWx
-
Posts
11,476 -
Joined
Content Type
Profiles
Blogs
Forums
American Weather
Media Demo
Store
Gallery
Posts posted by GaWx
-
-
1 hour ago, Snownado said:
I'd rather get snow earlier in winter when there's a better chance of the snow sticking around. By late Feb and March you can rest assured that the snow will be gone by the next day.
I understand where you're coming from but there are some exceptions at RDU, for example, as regards 1"+ snowcover for, say, 3 days+ to keep hope alive even that late for snow to stick around awhile:
- Late Feb-early Mar 2015: 5 days
- Early Mar 1980: 4 days
- Early Mar 1969: 4 days
- Early to mid March 1960: 15 days
- Early Mar 1927: 6 days
- Late Feb 1914: 3 days
- Early Mar 1912: 5 days
-
On 2/3/2022 at 3:04 PM, Brick Tamland said:
Another winter here with snow totals below 6 inches.

So, you're saying you already knew measurable snow was done as of Feb 3rd? Interesting. I'd like to know how you know this being that RDU's best major snow climo doesn't even start til mid-Feb and it goes through the first few days of March. Moreover, as of today in history, only 22 of the 47 6"+ RDU snowstorms on record have occurred by this date with 25 of them having occurred Feb 6th or later!
-
 2
2
-
-
And further to the above, we still have not even reached the peak times for major SE snow/sleet storms:
Per history, the frequency of big snow/sleetstorms for the SE as a whole including deep SE peaks around mid Feb after a quieter early Feb:
1. Dates of ATL 3.5"+/1.5"+ individual SN/IP storms:
DEC: 4 TOTAL 2, 3-6, 11-13, 29
JAN: 15 TOTAL 1, 2-3, 7, 7-8, 9, 9-10, 12, 18, 18-19, 22, 23, 23, 26, 28, 29-30
FEB: 14 TOTAL 10, 11-12, 11-12, 12, 12-13, 14-15, 15, 15, 15-16, 17-18, 21, 23, 24-25, 26
MAR: 6 TOTAL1, 2, 11, 13, 14, 24
So, ATL peak 7 day period looks like Feb 10-16 with 9 major snow/sleetstorms. Interestingly, they've had NONE 1/31-2/9 though they've had some major icestorms then.
--------------------------------------------------------------------------
2. Dates of RDU 6"+ individual SN/IP storms:
DEC: 8 TOTAL 2-3, 9-10, 11, 12-13, 17, 25-26, 27-28, 29
JAN: 13.5 TOTAL 2-3, 7-8, 7-8, 9-11, 13, 17-18, 18-19, 19, 24-25, 25-27, 26-27, 26-28, 28, 31 (this one continued til Feb 1)
FEB: 16.5 TOTAL 1 (this one continued from Jan 31), 6, 6-7, 9, 9-10, 10-11, 11-13, 14, 15-17, 17-18, 17-18, 18-19, 21-22, 26, 26, 26-27, 28
MAR: 8 TOTAL 1, 1-2, 2, 2-3, 9, 10, 24, 24
APR: 1 TOTAL 3
So, interestingly enough, RDU 6 day peak period for big storms is later, Feb 26-Mar 3, when they had 8.
In other words, even after all of the interesting wx to follow, we potentially still have a long way to go. And these stats don't even include icestorms, which have occurred into the first few days of March on a not so rare basis.
-
2
-
 1
1
-
-
The last few weeks have overall been one of the most exciting periods to be a winter wx lover in a very long time in the SE US as far as having so many things to discuss forecastingwise/a good number of opportunities, and getting some good hits, especially in the Carolinas! Among other places, Columbia finally got a good snow and Charlotte got 3 measurable snows within just 2 weeks, a very rare occurrence as it has been since 2000! The results weren’t always satisfying but the point is that it has not been the least bit boring. Most of the time it isn’t nearly that interesting for such a long period of time. In saying this, keep in mind that I got no wintry precip. though light ZR got very close when I got down to 32.7 with rain, a relative rarity down here in the Sav., GA, area.
-
4
-
-
On 11/29/2021 at 10:25 PM, GaWx said:
As shown above, the latest weekly Nino 3.4 warmed 0.3 C and is back up to -0.7 C. This means the chance at this La Niña ending up peaking as only weak (under -1.0) on an ONI (trimonthly max) basis has increased somewhat. I have been expecting a moderate peak (-1.0 to -1.4 based on 3 months of weeklies averaged out) but this new warming this late in autumn tells me it may not get there. In order to get a -1.0 or colder peak, the weeklies usually have to peak ~-1.2 to -1.3 or colder. The significance of that for SE/Mid Atlantic winters is that mild winters due to SE ridge domination have a good bit higher chance when La Niña is moderate or strong per analogs. But having only a weak La Niña would mean analogs that are closely balanced between AN, NN, and BN. Actually, after weak to moderate El Niño, your next best shot at a genuinely cold SE winter is weak La Niña. So, as one in the SE who prefers BN winters, I’m hoping it stays weak.
Kudos would be due for @40/70 Benchmark if it peaks as only weak.
Well, it looks like La Niña barely made it to moderate per my definition on an ONI basis with a -1.0 C despite a weekly peak of only -1.1. I was thinking a -1.2 would have been needed:
https://origin.cpc.ncep.noaa.gov/products/analysis_monitoring/ensostuff/ONI_v5.php
For all practical purposes, this will go down as borderline weak/moderate La Niña. So @40/70 Benchmark nailed it. Kudos!
-
1
-
1
-
-
As shown above, the latest weekly Nino 3.4 warmed 0.3 C and is back up to -0.7 C. This means the chance at this La Niña ending up peaking as only weak (under -1.0) on an ONI (trimonthly max) basis has increased somewhat. I have been expecting a moderate peak (-1.0 to -1.4 based on 3 months of weeklies averaged out) but this new warming this late in autumn tells me it may not get there. In order to get a -1.0 or colder peak, the weeklies usually have to peak ~-1.2 to -1.3 or colder. The significance of that for SE/Mid Atlantic winters is that mild winters due to SE ridge domination have a good bit higher chance when La Niña is moderate or strong per analogs. But having only a weak La Niña would mean analogs that are closely balanced between AN, NN, and BN. Actually, after weak to moderate El Niño, your next best shot at a genuinely cold SE winter is weak La Niña. So, as one in the SE who prefers BN winters, I’m hoping it stays weak.
Kudos would be due for @40/70 Benchmark if it peaks as only weak.
-
On 11/12/2021 at 12:02 PM, NorthHillsWx said:
Best fall colors in Raleigh in years
This was likely helped by recent dry weather.This peak being in mid November compares to the average peak being in late October a few decades ago.
Here, some trees are just starting to turn a little. With the current chill though, the changes should accelerate and thus may allow for a peak around Thanksgiving, which is near the average of the last 30 years. If so, that would be earlier than some recent years that didn’t peak til well into December. Going back more than 30 years, this area used to peak around now on average.
Today was a near perfect day to be outside as I was.
-
2 hours ago, Awesomesauce81 said:
I use to love those type of days growing up because they were so rare. As an adult who just had to work in that crap I was MISERABLE LOL. The analogs and long term forecasts may say otherwise but maybe a similar low can pop up with artic air in place and we can have some winter fun.
I’d say there’s a decent shot at another big (for SAV) winter storm here sometime within the next 15-20 years or so based on history. Will it have to wait 15-20+years? Will it come much sooner? You never know!Looking back in history at historic/major for SAV..say ~2”+ of snow/IP and/or significant ZR (so not near all wintry events…just the biggest ones), I know of these since 1800:
2018, 1989, 1973, 1968, 1922 (ZR), 1914 (ZR/IP), 1899 (blizzard with 2”), 1895, 1851-2 (two 2” snows that winter!), 1837 (2nd biggest), ~1810-15 (I think), 1800 (the biggest one by far). Plus there were a few in the mid to late 1700s. (SAV founded 1733 for those who don’t know). So, again about once every 15-20 years on average.
-
Final storm recap:
My county had a storm total range of 3-5". My location ended up with ~4", which included short periods of moderate to heavy rains returning late last night on the backside after several hours of light or no rain. The last of the rain didn't end til 9 AM this morning. It started around noon on Friday. So, the elapsed time from the start of the storm's rain til the very end was ~45 hours! It wasn't a totally continuous 45 hours of rain but a good 40 or so of the 45 hours had rain. A storm with that much elapsed time of nearly continuous rain is pretty rare.
I was looking back at records and there was a similar November storm with heavy rains and chilly temperatures due to a similarly far SE tracking low November 15-16 of 2019.@gtg947h @Awesomesauce81(fellow SAV posters), any totals or thoughts regarding this storm?
-
Here it has rained nonstop for over 30 hours with temps in the 40s and gusty NE to N winds. The heaviest just happened between 5 and 6 PM today, which produced street flooding. Storm totals will end up exceeding 3” at the very least in much of the region. Like 24 hours ago, mid to late afternoon temperatures were near the coldest in the lower 48 with only a very few exceptions being barely colder, this time mainly in the NW US. Lake City in FL at 45 at 5 PM was just about the coldest at 5PM at a nonmountainous lower 48 major station! KSAV was then 46 and has since dropped back to 45. KSAV coldest with the rain was 43 this morning, which is their coldest so far this season.
This is the type of track that once every few decades on average will give this area a very rare major winter storm. The last one was in January of 2018 and the prior one was in 1989. This one would have been a ZR/IP type of setup if it were midwinter and cold enough due to the wedge of cold air that is colder than that at 5K feet/850 mb.In summary, this has been and still is quite the memorable storm here due to the rare combination of longevity and various impacts producing quite the anomalous situation. To add, the very slow moving low center to our SE has been strengthening and is likely near 1,000 mb. The very slow movement is what has allowed the steady rain to last so long.
-
1
-
-
5 hours ago, George001 said:
Woah! The strength of the La Niña is increasing quickly. I know you have said earlier you think it peaks at around -1.2, do you think we are close to peak strength right now or are you starting to think it may even become a strong La Niña?
Yeah, I predicted within a range of -1.0 to -1.4. I'm sticking with that. Keep in mind that that is for the ONI trimonthly fall/winter peak. The weeklies, themselves, would peak higher than the trimonthly, of course.
-
1
-
-
Nino 3.4 dropped to -1.1 C fwiw.
-
3 hours ago, MJO812 said:
Gefs is honking

Indeed,
12Z EPS/18Z GEFS/0Z GEFS about as busy as anytime recently late in their runs in the W Caribbean. Early Nov climo supports this to some extent with still a respectable 13 geneses over the 10 day period 11/1-10 vs about the same rate during the 11 day period 10/21-31 of 15..so this area may bear watching, folks, as that's one every 13 years on average with the last one being Ida of 2009:

-
1
-
-
26 minutes ago, 40/70 Benchmark said:
Thank you. Yes, it is working. It has -1.4 for AS.
-
55 minutes ago, 40/70 Benchmark said:
Thanks Larry.
Is the MEI v2 database loading for you? Its only letting me get to the overview for some reason.
I haven’t tried it. Please provide a link. -
7 hours ago, 40/70 Benchmark said:
I am not finding the weekly data here...maybe it has to do with the outage. Could someone please send the link directly to the data?
Thanks.
https://www.cpc.ncep.noaa.gov/data/indices/wksst9120.for
- Nino 3.4, is at -0.8 vs -0.6 a week before
- It appears that they've just restated past weeks to reflect on the new dataset. Remember my post about that last week's showing a 0.7 cooling from 0.0 to -0.7? Now last week shows only a 0.1 cooling from -0.5 to -0.6
-
1
-
-
It doesn't get much more awesome than today with temps in the low 70s and dewpoints in the low 40s here...near ideal weather for outdoors!
-
2
-
-
It is a shame (for those who prefer cold E US winters) that there is virtually no correlation of Oct NAO to winter NAO during La Niña because there's a chance for it to be the most -NAO October on record for a non-El Nino (back to 1950), which is currently 2012’s -2.06. For whatever reason, the monthly NAO is often close to double what the dailies average out to. At a minimum, it seems to be at least 1.67 times the daily average. Based on that, this month has a good chance of ending up sub -1.8 and could easily end up sub -2.0 (see GEFS based forecast below).
Here is the link to the monthlies back to 1950:https://www.cpc.ncep.noaa.gov/products/precip/CWlink/pna/norm.nao.monthly.b5001.current.ascii.table
The following Octs were sub -1.7:
1960, 1968, 1980, 1992, 1997, 2002, 2006, and 2012
The subsequent DJF NAO along with ENSO:
1960: +0.3/not El Niño
1968: -1.4/El Niño
1980: +0.7/not El Niño
1992: +0.9/not El Niño
1997: -0.2/El Niño
2002: -0.2/El Niño
2006: +0.4/El Niño
2012: 0.0/not El Niño
Only one of the 8 subsequent winters had a strong -NAO (1968) and it was El Niño. Two others were slightly -NAO and they were also El Niño. The 4 non-El Niño winters were in the 0.0 to +0.9 range and averaged +0.5. Looking at all 8 winters, they averaged +0.1.
Conclusion: Despite the forecast for Oct of 2021 to have one of, if not THE, most -NAO on record for any Oct, it by no means is predictive of a -NAO this winter. Of course, that doesn’t mean it can’t end up that way. I’m just saying that history says that this month being so strongly -NAO doesn’t mean an increased chance for -NAO this winter vs climo based chances. Furthermore, this winter being La Niña, if anything, reduces the chances based on ENSO climo.
Here’s the impressive GEFS NAO forecast:
-
Today's SOI was +28 (though that should be a peak for awhile as it will now drop) , the 30 day is +11, and the 90 is at +9.
-
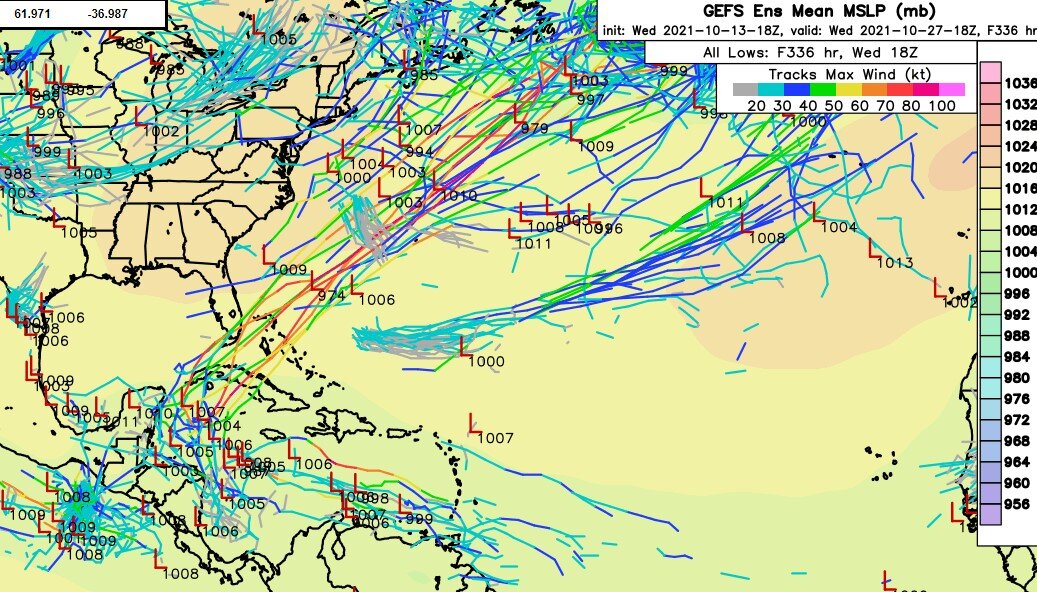
The 0Z GEFS maintains the moderate signal for W Caribbean genesis mid to late next week that then moves NE toward far south FL or FL Straits.
-
1 hour ago, cptcatz said:
18z GEFS has an impressive swath of strong storms heading up through the Bahamas/Florida
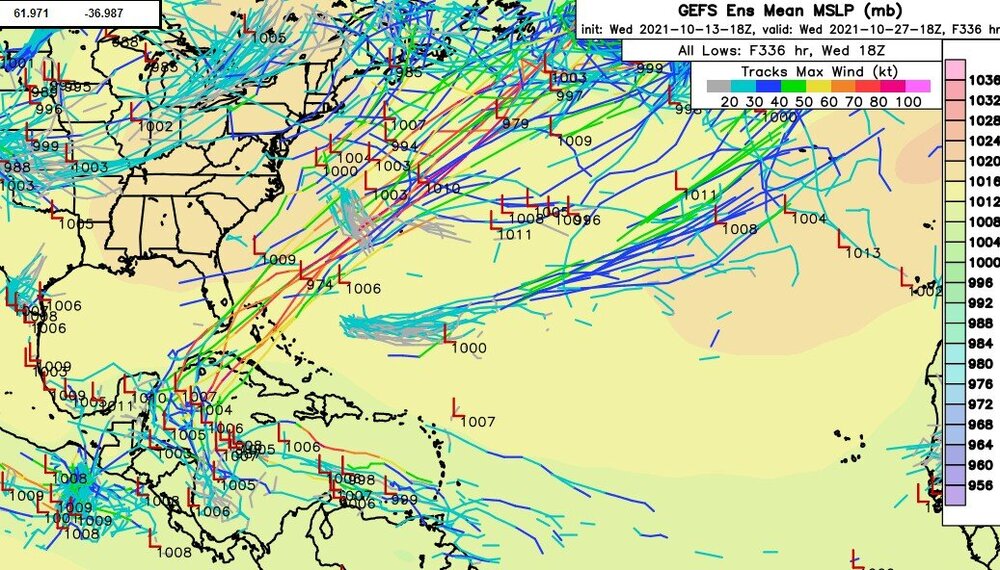
The period in and around 10/17-21 has been quite active in terms of frequency on and near south Florida/Bahamas based on past seasons. It is essentially the final peak period for that area for the season. Will there be another for around that period? The 12Z GEFS was also pretty active. Perhaps this one isn’t a fake like the one earlier. Let’s see if future GEFS runs persist with this activity.
-
Model consensus is suggesting that the SOI will spike up to the +30 to +40 range within a few days before a short term plunge that may take it briefly slightly negative before it rises back up.
-
9 minutes ago, raindancewx said:
The big drop off in SSTs this week likely is from CPC switching data sources.
For the 1951-2010 period, 26.50C is average in Nino 3.4 We're not 0.5C below that yet on the weeklies. Still running well warm of last year to the east, and somewhat warm of last year in Nino 4.
Starting this week, the weekly sea surface temperature data is based on OISSTv2.1 (Huang et al., 2021). This impacts slides #4-9. The source data is available at this link.
                Nino1+2      Nino3        Nino34        Nino4
 Week          SST SSTA     SST SSTA     SST SSTA     SST SSTA
 01SEP2021     20.3-0.2     24.7-0.3     26.5-0.3     28.4-0.3
 08SEP2021     20.7 0.2     24.6-0.3     26.4-0.4     28.5-0.3
 15SEP2021     20.6 0.2     24.3-0.6     26.3-0.4     28.4-0.4
 22SEP2021     20.6 0.2     24.5-0.4     26.4-0.3     28.2-0.5
 29SEP2021     20.5-0.0     25.1 0.3     26.8 0.0     28.2-0.6
 06OCT2021     20.7 0.1     24.7-0.2     26.1-0.7     28.0-0.7
 02SEP2020     18.9-1.7     23.6-1.4     25.8-0.9     28.4-0.4
 09SEP2020     19.5-1.0     23.4-1.4     25.7-1.0     28.5-0.3
 16SEP2020     20.0-0.4     23.6-1.3     25.9-0.8     28.2-0.5
 23SEP2020     19.6-0.8     23.6-1.2     25.7-1.0     28.1-0.6
 30SEP2020     20.1-0.4     23.8-1.1     25.6-1.1     27.9-0.8
 07OCT2020     19.5-1.1     23.4-1.5     25.5-1.2     27.8-0.9
Lol, I had just posted the same thing about the changed data source while you were typing. So, how much of the 0.7 drop is due to it is an unknown. There could still have been a legit decent drop embedded in that.
-
1 hour ago, 40/70 Benchmark said:
I'm actually glad to see the steep drop in 3.4 because it was looking pretty modoki for a bit. People need to remember that this once every ten year drop occured with region 3.4 at neutral, so let's not get carried away.
I'm not getting carried away. I just think the rarity is interesting, not necessarily important from a predictive standpoint. Besides, a big move like this is hardly ever immediately folIowed by another big move in the same direction. It is almost as if it needs to take a breather.
I also noted a similar rarity here a couple of months ago when Nino 3.4 warmed by 0.6 in just one week. Rare large moves in either direction are fun for me to compare vs history.
So, Nino 3.4 is now at -0.7, which is still a good ways from implying an oncoming moderate 3 month (ONI) peak. The weeklies would likely have to reach -1.3 or so.
Having said all of this, something very interesting was noted in today's weekly ENSO report:
"Starting this week, the weekly sea surface temperature data is based on OISSTv2.1".
So, a portion of today's "cooling" may have been due to a changed dataset.


Mid to Long Range Discussion ~ 2022
in Southeastern States
Posted
Caution is advised when looking at any Canadian based output due to cold bias. Posted below is a comparison at 2 meters for tomorrow at 7AM EST between RGEM, NAM, WRF, and GFS and the RGEM is ridiculously colder all over like in Jackson, MS, Birmingham, Wash DC, much of VA and TN, etc.
At Jackson, MS, for example, it has 16 vs 30 for the other models. It has Birmingham at 23 vs low 30s on others. Washington, DC, at 12 vs 20s others. Richmond at 14 vs 26 on others.
That’s not to say there can’t or won’t be any ZR in NC the next day, but I hope the cold bias is taken into account.