

GaWx
-
Posts
11,514 -
Joined
Content Type
Profiles
Blogs
Forums
American Weather
Media Demo
Store
Gallery
Posts posted by GaWx
-
-
1. KATL highs 89 yesterday and 88 today. No more chance at another 90 til late week. So, that means that as of July 21st, KATL should still be at only 7 90+ days YTD, WAY below average.
2. Here in SAV, the nearly daily afternoon thunderstorms have been continuing. We’ve probably reached close to 7” this month with over 4” from Elsa. No widespread drought in GA or SE heatwave in sight! Loving this summer!
-
 1
1
-
-
90 at KATL at 3 PM for first 90 of the month! Congrats, you did it! Now 7 90+ days YTD, still way below average.
-
KATL had 11.51" of rainfall in May and June, combined. That makes it the 18th wettest out of 143 (~87th percentile).
I looked at all May-June periods at 10"+ of rainfall at KATL through 2020, which is 31 of them (22% of them). 25 of the 31 had July hottest below the long-term average July hottest of 95.4. Wet soils are clearly helping to keep Atlanta highs down. So far this month, the hottest at KATL is only 89 and that may not change through the next couple of days.-
2
-
-
KATL has had only six 90+ days YTD. They're projected to have no more than ~7-9 90+ through 7/17, with no major heat or dry period through 7/24 per model consensus. That means KATL will have a decent chance to not exceed 12 90+ YTD through July 31. I thought it would be fun to speculate on what it would mean based on climo (records back to 1879) for Aug-Oct 90+ days if KATL were to not exceed 12 90+ through July:
- 37 years back to 1879 with 12 or fewer 90+ through July
- Not even a single one of these 37 years exceeded 13 90+ days during Aug-Oct
- The average of these 37 was only 7 90+ days for Aug-Oct, which is a mere half of the average of 14 for all years
- So, not even one of the 37 even hit the average of 14
- The average for the other 105 years is ~16.5, well over double the 37 years with 12 or fewer 90+ through July
What about the hottest day in Aug-Oct?
- For the 37 years with 12 or fewer 90+ days through July, the average hottest day in Aug-Oct was only 92.4 vs the average hottest Aug-Oct day for the other 105 years of 95+.
- For all 37 years, the hottest day in Aug-Oct was only 97 (that was in 1927) with only 5 of the 37 years having the hottest day of 95+ and 26 of the 37 having the hottest Aug-Oct day of only 93 or lower.
So, the climo implications of the number of 90+ highs at KATL staying low through July are huge for Aug-Oct as far as the relative lack of intense heat is concerned. That is largely because the relatively moist soil conditions that keep heat in check through July normally persist beyond July. So, I'm quite curious to see where KATL ends up as of 7/31.
-
3
-
 1
1
-
-
This 2nd Danny band is a doozy here in SAV, Ga, with lots of CTG lightning, some very closeby, and heavy rains. I hope I don't lose power!
-
5
-
-
Center aiming for Hilton Head or just north. Thunderstorms again here in SAV now with this 2nd band. Skies are dark. Winds are light.
-
1
-
-
2PM PDT vs 24 hours ago:
Portland 112 (+3)(warmed 2 last hour)
SeaTac 103 (+5) (warmed 4 last hour)
Pendleton 109 (+2)(no change last hour)
Walla Walls 107 (-2)(warmed 1 last hour)
Spokane 101 (0)(warmed 2 last hour)
Yakima 105 (+1)(warmed 2 last hour)
-
Per radar and trends, we (SAV) look to get the heaviest rainfall from a couple of bands on the west/SW side of Danny starting shortly and going for a couple of hours on and off. I wouldn't want to be driving then as tropical bands like this are often very heavy. It looks to be coming at a bad time, drive home time. So far, only occasional very light rain has fallen with light winds but is getting dark now.
-
1PM PDT vs 24 hours ago:
Portland 110 (+6)(warmed 5 last hour)
SeaTac 99 (+3) (cooled 3 last hour)
Pendleton 109 (+3)(warmed 4 last hour
Walla Walls 106 (0)(warmed 1 last hour)
Spokane 99 (+1)(warmed 1 last hour)
Yakima 103 (+1)(cooled 1 last hour)
-
Noon PDT vs 24 hours ago:
Portland 105 (+7)
SeaTac 102 (+8)
Pendleton 105 (-1)
Walla Walla 105 (+2)
Spokane 98 (+3)
Yakima 104 (+3)
-
1
-
-
52 minutes ago, GaWx said:
A little good news. The 4 PM Washington and Oregon readings that I've been following were all either the same or cooler than 3 PM.
Here's something weird. After all of the 6 stations in Wash/Ore either dropped 1-3 F or were steady the previous hour, they all rose 1-2 F this most recent hour (5 PM PDT)! The hottest hourly of the day was reached at both Portland (112) and Yakima (107).
-
B.C. heat wave shatters Canadian record for highest temperature ever recorded | CBC News
This also says new Canada record of 46.1C but could it also be wrong?
A little good news. The 4 PM Washington and Oregon readings that I've been following were all either the same or cooler than 3 PM.
-
1 PM PDT vs 24 hours ago:
Portland 104 (+11)
SeaTac 96 (+4)
Pendleton 106 (+5)
Walla Walls 106 (+5)
Spokane 98 (+5)
Yakima 102 (+2)
-
As of Noon PDT vs 24 hours earlier, this is how much hotter it is:
Portland 7 F
SeaTac 6 F
Pendleton 6 F
Walla Walla 5 F
Spokane 4 F
Yakima (airport) 2 F
-
My feeling is that if they’re going to investigate this that it be today rather than tomorrow afternoon, when it would already be nearly onshore.
-
1
-
-
Looking at 10AM PDT readings vs 24 hours ago:
Portland, Walla Walla, Pendleton, and Yakima are 6 F warmer.
Spokane area is 4-5 F warmer. SeaTac is 3 F warmer.
Keep in mind that June records were already obliterated in Portland, Seattle-Tac, and other locations yesterday!
-
@donsutherland1and others,
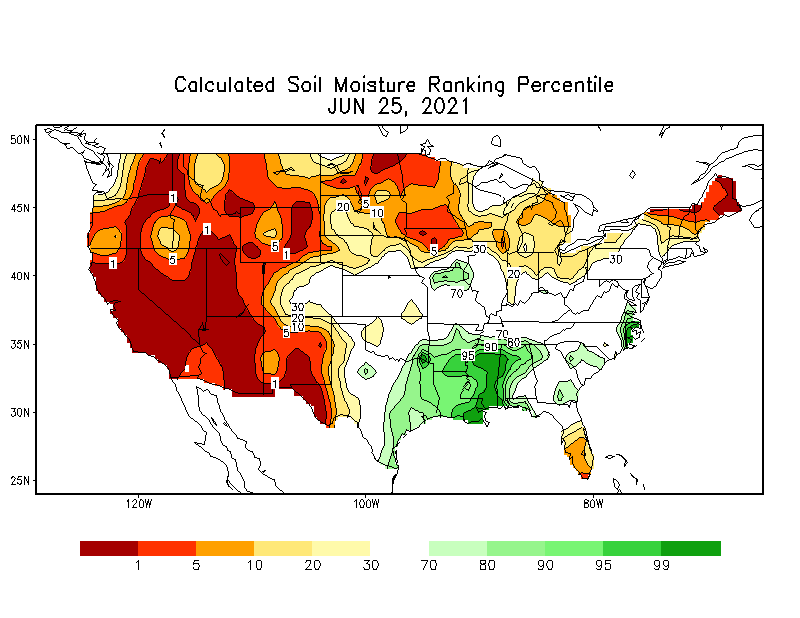
Do I think AGW is contributing to this? I strongly feel that way. The globe is ~2F warmer than it was just since the 1970s and ~3 warmer than 1900 if I’m not mistaken. And this is the fourth extreme heatwave just this month to go along with Desert SW, N Plains, and Russia as Don pointed out. But is the likely contribution to this more than, say, 2-3F? That’s impossible to know. One thing that is an additional major contributor is the widespread drought in the area (see below), likely caused largely by La Niña, combining with the very anomalous Pacific NW ridge.
Do y’all think the AGW contribution to this heatwave is likely more than ~2-3F? Do you think that the widespread W US drought is a bigger contributor? I'm strongly suspecting it is based on the physics of air heating up more over drier soils due to their much lower specific heat levels. Would we be looking at a historic heatwave had there been no drought? I have a lot of doubt about that and also suspect that there wouldn't be as strong a ridge there without the drought. Also, note that the 3 big US heatwaves have all occurred in widespread drought regions as per the map below:
-
19 minutes ago, FPizz said:
Lines up well with population increase
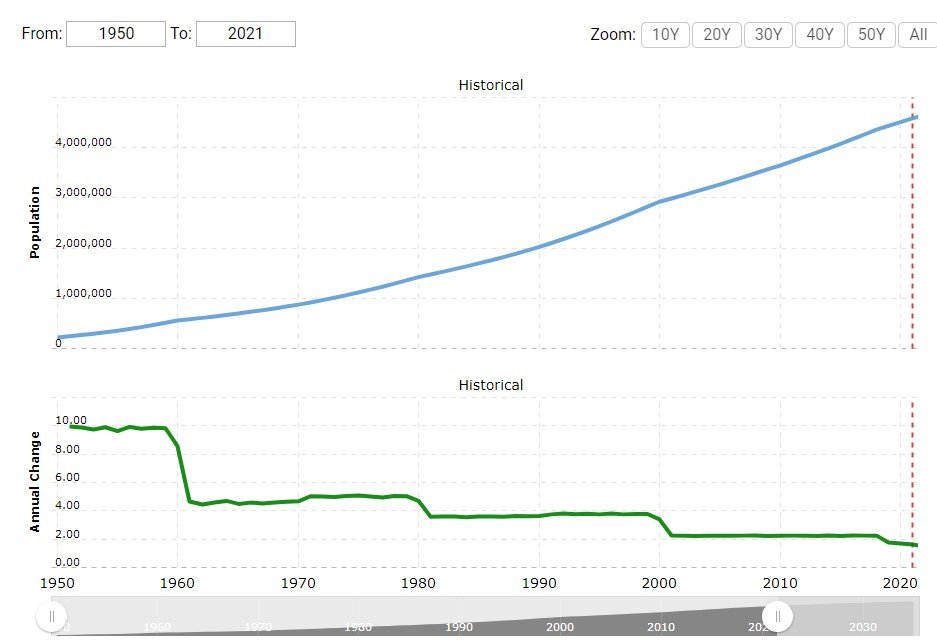
It appears you're indirectly referring to UHI, which I think is a legitimate significant factor for Phoenix in addition to AGW as I mentioned. But keep in mind that UHI mainly affects minimums. The increase in average maximums is likely mainly related to AGW imo and Don mainly emphasized maximums.
-
2
-
-
@donsutherland1, excellent analyses from one of the best and most objective analyzers of data here.
As much as I like your posts ITT, I think they would have been even better if you had mentioned the very likely additional significant role of UHI on mainly Phoenix’s minimum temperatures. I assume you’d agree that UHI has contributed much more to higher minimums than to higher maximums and is I believe the main reason why minimums have increased by a significantly higher amount vs the increase for maximums. So, I feel that higher minimums are due to a combo of UHI and AGW, with each having significant effects.
For this reason, in order to get the best feel for AGW’s effects independent of UHI, I tend to focus only on maximums as I believe that the vast majority of those increases has been due to AGW. To be fair, you have focused much more on those.
-
2
-
-
On 12/16/2019 at 4:21 PM, donsutherland1 said:
The high temperatures at Yakutat, Alaska for the past three days and for today (preliminary value) were:
December 13: 56° (old record: 49°, 2017)
December 14: 58° (old record: 49°, 2017)
December 15: 61° (old record: 48°, 2005)
December 16: 57° (old record: 50°, 2005)All four days exceeded the previous December record high temperature of 52°, which had been set on December 8, 1960. The 61° temperature yesterday broke the meteorological winter record of 58°, which was set on January 19, 1930 and tied on December 14, 2019 and was also above the November monthly record of 59°, which was set on November 1, 1947. Prior to yesterday, the latest 60° temperature on record occurred on October 13, 1969 when the temperature reached 60°. Daily records go back to May 1, 1917.
Hi Don,
I respect you immensely and therefore feel the need to tell you that it looks like there’s a major problem with the Yakutat temperature sensor. Please check out this link to hourlies for the last few days:
https://w1.weather.gov/data/obhistory/PAYA.html
a
t
eTime
(akst)Wind
(mph)Vis.
(mi.)Weather Sky Cond. Temperature (ºF) Relative
HumidityWind
Chill
(°F)Heat
Index
(°F)Pressure Precipitation (in.) Air Dwpt 6 hour altimeter
(in)sea level
(mb)1 hr 3 hr 6 hr Max. Min. 17 17:53 E 5 10.00 Overcast BKN037 OVC055 36 29 76% 32 NA 29.33 993.3 17 16:53 NE 7 10.00 A Few Clouds FEW029 35 28 76% 29 NA 29.34 993.6 17 15:53 E 3 10.00 Mostly Cloudy SCT030 SCT040 BKN050 36 30 79% NA NA 29.35 993.8 17 14:53 E 9 10.00 Overcast OVC036 36 30 79% 29 NA 29.36 994.2 17 13:53 E 8 10.00 Light Rain OVC040 36 30 79% 30 NA 29.37 994.6 17 12:53 E 6 10.00 Light Rain FEW027 BKN040 OVC055 35 32 89% 30 NA 29.37 994.5 17 11:53 Calm 10.00 Light Rain BKN038 OVC045 NA NA NA NA NA 29.36 994.4 17 10:53 Calm 10.00 Mostly Cloudy SCT046 BKN055 NA NA NA NA NA 29.35 994.1 17 09:53 NE 3 10.00 Mostly Cloudy BKN050 NA NA NA NA NA 29.35 994.1 17 08:53 Calm 10.00 Partly Cloudy SCT085 NA NA NA NA NA 29.33 993.4 17 07:53 Calm 10.00 Partly Cloudy SCT120 NA NA NA NA NA 29.33 993.4 17 06:53 Calm 10.00 Mostly Cloudy BKN110 NA NA NA NA NA 29.34 993.7 17 05:53 Calm 10.00 Partly Cloudy SCT110 NA NA NA NA NA 29.36 994.4 17 04:53 Calm 10.00 Partly Cloudy SCT100 NA NA NA NA NA 29.38 995.1 17 03:53 NE 5 10.00 A Few Clouds FEW038 NA NA NA -11 NA 29.41 996.1 17 02:53 E 3 10.00 Mostly Cloudy BKN044 NA NA NA NA NA 29.44 997.1 0.01 17 01:53 NE 5 10.00 Overcast SCT034 OVC042 NA NA NA -11 NA 29.47 998.1 17 00:53 E 5 10.00 Mostly Cloudy BKN028 NA NA NA -11 NA 29.50 999.1 16 23:53 NE 7 10.00 Overcast BKN026 OVC033 NA NA NA -13 NA 29.54 1000.5 0.01 0.01 16 22:53 NE 8 10.00 Overcast BKN023 BKN036 OVC044 NA NA NA -14 NA 29.57 1001.5 16 21:53 E 9 10.00 Overcast OVC021 NA NA NA -15 NA 29.58 1001.8 16 20:53 E 8 10.00 Overcast BKN020 BKN025 OVC033 NA NA NA -14 NA 29.60 1002.5 0.07 16 19:53 NE 7 10.00 Mostly Cloudy FEW018 SCT025 BKN120 NA NA NA -13 NA 29.61 1002.9 16 18:53 NE 7 10.00 Overcast FEW021 BKN055 OVC110 NA NA NA -13 NA 29.62 1003.2 16 17:53 E 6 10.00 Overcast SCT018 OVC120 NA NA NA -12 NA 29.64 1003.9 0.01 0.07 16 16:53 Calm 5.00 Light Rain BKN017 OVC023 NA NA NA NA NA 29.65 1004.2 0.04 16 15:53 E 7 10.00 Overcast OVC011 NA NA NA -13 NA 29.66 1004.6 0.02 16 14:53 E 5 4.00 Rain BKN009 OVC013 NA NA NA -11 NA 29.67 1004.9 0.08 0.24 16 13:53 E 10 8.00 Light Rain OVC008 NA NA NA -16 NA 29.66 1004.6 16 12:53 E 8 10.00 Overcast OVC006 NA NA NA -14 NA 29.66 1004.6 0.07 16 11:53 E 9 3.00 Light Rain FEW008 BKN013 OVC023 48 38 68% 44 NA 29.64 1003.7 0.06 0.09 16 10:53 E 9 3.00 Light Rain OVC012 52 37 57% NA NA 29.63 1003.3 0.03 16 09:53 E 8 3.00 Light Rain Fog/Mist OVC016 37 36 96% 31 NA 29.61 1002.7 16 08:53 E 10 10.00 Light Rain OVC033 37 35 57 37 93% 30 NA 29.59 1002.1 0.04 0.13 16 07:53 E 8 9.00 Light Rain OVC027 37 35 93% 31 NA 29.58 1001.8 0.04 16 06:53 E 5 10.00 Light Rain OVC026 48 35 61% 46 NA 29.58 1001.8 0.02 16 05:53 SE 3 10.00 Light Rain OVC030 51 33 50% NA NA 29.58 1001.5 0.01 0.03 16 04:53 SE 7 10.00 Light Rain OVC034 55 32 42% NA NA 29.57 1001.3 0.01 16 03:53 SE 7 10.00 Light Rain OVC034 55 34 45% NA NA 29.55 1000.7 0.01 16 02:53 E 9 10.00 Light Rain OVC048 56 33 61 42 42% NA NA 29.52 999.8 16 01:53 E 5 10.00 Overcast OVC046 50 28 43% 48 NA 29.53 1000.0 16 00:53 NE 6 10.00 Light Rain OVC050 55 27 34% NA NA 29.53 1000.0 15 23:53 E 5 10.00 Overcast OVC050 53 27 37% NA NA 29.54 1000.4 15 22:53 E 6 10.00 Overcast OVC060 53 25 34% NA NA 29.55 1000.7 15 21:53 E 7 10.00 Overcast OVC060 49 25 39% 46 NA 29.56 1001.0 15 20:53 NE 12 10.00 Overcast BKN070 OVC090 51 24 60 36 35% NA NA 29.58 1001.6 15 19:53 E 6 10.00 Overcast FEW055 BKN070 OVC100 58 26 29% NA NA 29.61 1002.8 15 18:53 E 6 10.00 Overcast OVC055 51 27 39% NA NA 29.64 1003.6 15 17:53 E 5 10.00 Mostly Cloudy BKN055 49 28 44% 47 NA 29.65 1004.2 15 16:53 SE 5 10.00 Overcast OVC055 54 29 38% NA NA 29.68 1005.0 15 15:53 E 3 10.00 Mostly Cloudy FEW050 BKN060 BKN075 37 30 76% NA NA 29.70 1005.9 15 14:53 Calm 10.00 Partly Cloudy SCT046 40 29 56 40 65% NA NA 29.73 1006.7 15 13:53 E 6 10.00 Overcast FEW049 OVC065 49 30 48% 46 NA 29.76 1007.8 15 12:53 NE 8 10.00 Mostly Cloudy BKN035 BKN046 43 30 60% 38 NA 29.78 1008.5 15 11:53 NE 8 10.00 Overcast SCT033 BKN040 OVC047 52 31 45% NA NA 29.81 1009.4 15 10:53 E 9 10.00 Overcast BKN040 OVC048 56 29 36% NA NA 29.83 1010.0 15 09:53 E 6 10.00 Light Rain OVC041 54 29 38% NA NA 29.84 1010.4 15 08:53 E 6 10.00 Overcast FEW033 BKN046 OVC060 51 30 54 41 45% NA NA 29.84 1010.4 15 07:53 E 6 10.00 Mostly Cloudy BKN048 BKN065 51 30 45% NA NA 29.84 1010.6 15 06:53 NE 8 10.00 Overcast OVC048 46 30 54% 42 NA 29.86 1011.0 15 05:53 NE 9 10.00 Overcast OVC046 47 31 54% 43 NA 29.87 1011.6 15 04:53 NE 7 10.00 Overcast OVC044 47 31 54% 44 NA 29.89 1012.1 15 03:53 NE 6 10.00 Overcast OVC043 47 31 54% 44 NA 29.90 1012.5 15 02:53 NE 7 10.00 Overcast OVC046 49 31 51 38 50% 46 NA 29.91 1012.7 15 01:53 E 5 10.00 Overcast OVC048 43 31 63% 40 NA 29.92 1013.3 15 00:53 NE 6 10.00 Overcast OVC048 46 31 56% 43 NA 29.93 1013.6 14 23:53 E 5 10.00 Overcast OVC047 46 32 58% 44 NA 29.94 1013.7 14 22:53 E 3 10.00 Overcast FEW024 BKN039 OVC049 46 32 58% NA NA 29.94 1013.7 14 21:53 E 6 10.00 Overcast FEW026 SCT037 OVC047 50 32 50% 48 NA 29.94 1013.7 14 20:53 E 3 10.00 Overcast OVC034 50 32 55 39 50% NA NA 29.94 1013.9 14 19:53 E 3 10.00 Mostly Cloudy BKN120 55 32 42% NA NA 29.94 1014.0 14 18:53 NE 6 10.00 Mostly Cloudy BKN038 46 34 63% 43 NA 29.95 1014.3 D
a
t
eTime
(akst)Wind
(mph)Vis.
(mi.)Weather Sky Cond. Air Dwpt Max. Min. Relative
HumidityWind
Chill
(°F)Heat
Index
(°F)altimeter
(inDon, here are just 2 examples of hourlies that look bogus:
1. 16:53 on 12/15 is at 54 F, a rise of a whopping 17 in one hour from the 37 the previous hour while overcast?? That can’t be. And the winds didn’t change much. Light E to light SE. So, no major warm front/airmass change it would appear.
2. At 9:53 on Dec 16th it was 37 and it then rose a whopping 15 in one hour under light rain to 52 with continued light E winds.
I may post more later about the problems with this station when time permits.
-
1
-
-
http://www.cbsnews.com/news/whats-behind-the-floods-in-texas-and-heat-in-india/
So, no mention of the current El Niño being a factor at all? Even the alarmists have to admit that this is a gross misrepresentation!
-
Paywall. Meh.
We'd have to see how he reconciles all the components. It is certainly not in line with most of the literature which places a large majority of the warming in the 20th century as anthropogenic. There's a lot of studies that place the majority of the warming in the early 20th century on natural variation from a combo of increased solar activity, decreased volcanic activity and internal variability in the oceans...but there is still a smaller anthropogenic component and then you have the post-1950 warming which is mostly anthropogenic.
ORH,
But what about the fact that 1950-2000 was by a good margin the most active 50 years for solar in at least 350 years? I still wonder about that possibly having contributed a significant % of the 1950-2000 warming. Possible? I'm admittedly still waiting for a cooldown to finally commence in the wake of the recent very slow cycle.
-
"'This suggests that while some portion of the temperature change observed in the 20th century was probably caused by greenhouse gases, there is a strong likelihood that the major portion was due to natural variations,' Lloyd wrote in his study."
Any comments? Anything to this? This is from a former lead author of a UN intergovernmental panel on climate change.
I personally still question how much could have been due to the most active 50 year period solar wise in 350+ years during 1950-2000 though I'm still waiting for evidence of a cooldown to finally get going in the wake of the slow most recent solar cycle.
-
We'd have to see a noticeable cooling by 2017-2018 or so because by that point, we'd be more than 3 years beyond the weak solar max we had in cycle 24. It's been argued by some that the weak solar maxes are more important than the mins during decreased acitivty...so you can pretty much discard the theory if by 2018 the effects of the weak max and subsequent min have not been felt to a significant degree. I'm fairly skeptical though on it having a large impact. We may see a muted effect like we did from 2008-2012...we'll find out soon enough.
I agree with about a 2018 deadline to finally see some cooling impact from a solar minimum. That's been near my put up or shut up time for a few years in this forum.
July 2021 Observations
in Southeastern States
Posted
Getting dark here to our west with lots of rumbling thunder and then I just saw that there is a severe thunderstorm warning for this area! Rain is just starting.