

GaWx
-
Posts
19,197 -
Joined
Content Type
Profiles
Blogs
Forums
American Weather
Media Demo
Store
Gallery
Posts posted by GaWx
-
-
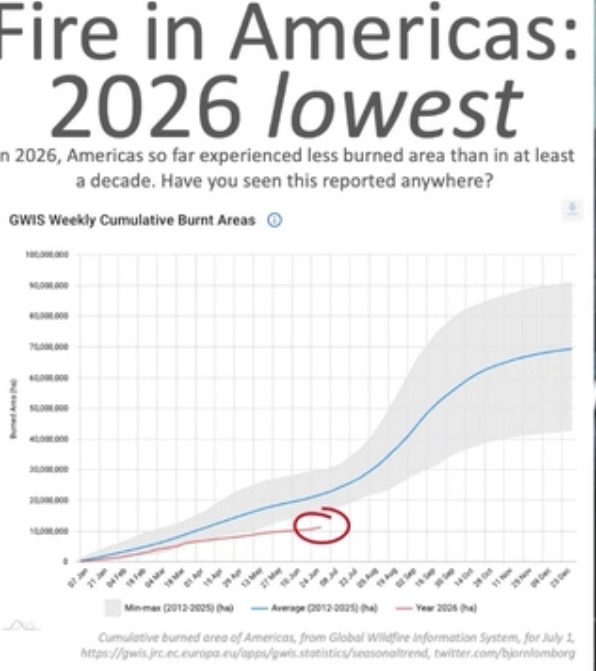
Opinions about this, which shows lowest cumulative YTD burnt area as of July 1st in Americas since at least 2012?@donsutherland1@WolfStock1
-
27 minutes ago, bluewave said:
No red herrings involved. My first post showing the warmth this month was based on the warmest 1991-2020 averages. So that is why I kept it for continuity between posts.
But your cooler base period doesn’t show any material difference from the main point how much warmer this summer has been than past developing El Niños due to the record ridging from north of Hawaii across the CONUS.
So it just seems like you are inventing ways to be argumentative without addressing the main point.
I never said this summer wasn’t hot and never said 1987 was as hot. But 1987 was still hot and not normal for Nino. That’s why I pointed it out as another hot summer exception for Nino. That’s all.
Edit: I agree with your original idea that 2026 hot summer to date is atypical of pre-super-Nino. Then I brought up ‘91 being hot because it was the other exception to pre-super Nino hot summers. Then you correctly said that ‘91 was still just weak during summer. Then I brought up 1987 because it was mod to strong Nino in summer and hot.
-
 1
1
-
-
4 minutes ago, GaWx said:
Chris,
1. Just “A little warmer in the East” relative to the rest of CONUS”? For summer, which has relatively lower variance, this is not just “a little”.
2. This discussion started based on you posting cool Nino summer US maps. Why are you bringing up “Pacific to the Atlantic”? Red herring again.
3. I never said 1987 summer was as warm as 2026 summer to date. But it was still warm in the E US, which is not normal for Nino.
-
6 minutes ago, bluewave said:
It matches the El Niño composite in most areas from the Pacific to the Atlantic. So a little warmer in the East relative to the rest of the CONUS isn’t really a dealbreaker. This summer so far is much more of an outlier than 1987 was.
Chris,
1. Just “A little warmer in the East” relative to the rest of CONUS”? For summer, which has relatively lower variance, this is not just “a little”.
2. This discussion started based on you posting cool Nino summer US maps. Why are you bringing up “Pacific to the Atlantic”? Red herring again.
-
1
-
 1
1
-
-
2 hours ago, snowman19 said:
@Gawx Over/under that the MEI is already at or above +2 given the current obs of the parameters it measures? If so, given that those parameters are projected to only get stronger the next few months and the record-breaking rise since April, I think we set a new MEI record (old record: +2.9)…..


Over
-
1
-
-
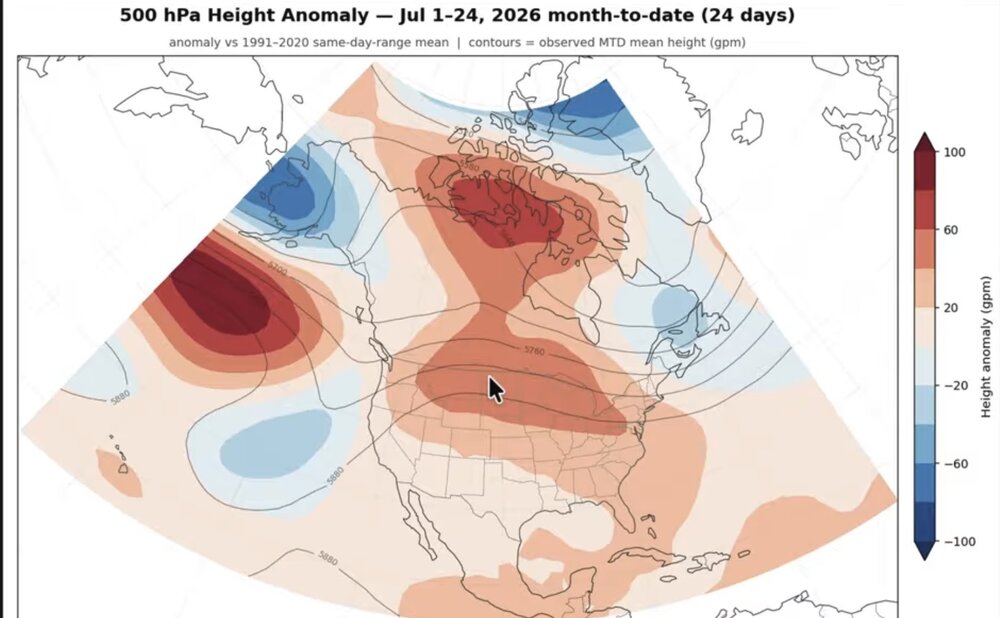
3 hours ago, bluewave said:
2026 is near the warmest July on record in my first post using 1991-2020 climate normals at +2.5 since that is the base period Brian used. The departure would be even higher if an older base period was used.
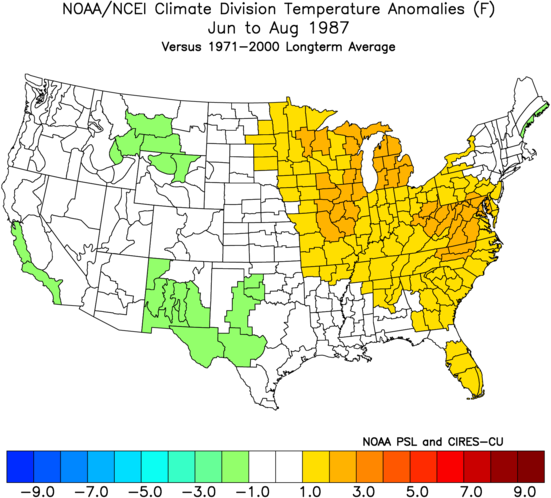
My 2nd post uses 1971-2000 climo and even that cooler one shows that 1987 wasn’t a warm summer for the CONUs even during the 1980s. Notice the warmest summer of that decade was 1988 which came in the summer after the El Niño and not before. So this El Niño is getting off to a much warmer start than usual.
It’s El Ninoish since it matches most of the pattern for an El Niño summer from the Pacific across to the Atlantic. Every spot isn’t going to be a 100% match. But most of the area from the Pacific to the Atlantic is a reasonable 500 mb match whatever the base period is used for an El Niño summer.
A hallmark of a developing very strong El Niño pattern during the summer is higher 500mb heights further north and lower heights underneath from the Pacific to the Atlantic. This summer the pattern is reversed which lead to all the record warmth across the CONUS.
The record ridge north of Hawaii this month is the reason that the PDO had the steep drop in July. This is not the 500 mb pattern that we have typically had during any El Niños which were on their way to super status. So this event is in a league of its own in numerous ways.
Here’s 1980-89 summer mean vs 1971-2000 climo: 1980s were NN
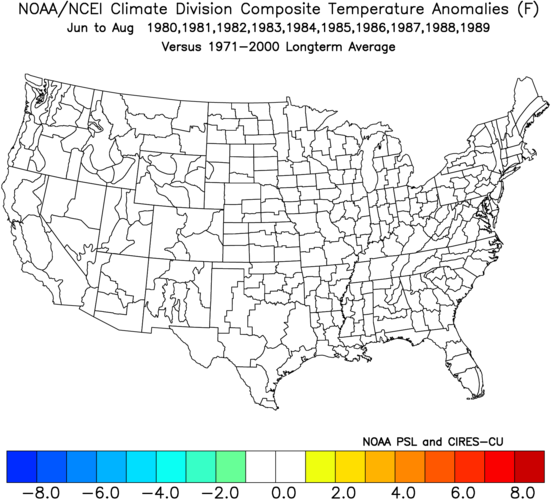
Here’s 1987 summer vs same climo: notably warmer than the NN 1980s mean E 1/2 US and it did that during Nino: that was not Ninoish at all; comparing it to other hot summers like 1980, 1983, or 1988 is a red herring as they weren’t Nino

-
22 minutes ago, 40/70 Benchmark said:
No one thought it was right with a straight Modoki in the seasonal mean.
The maps I was basing my post on were from weathermodels.com and were using 1991-2020 for base climo.
But since I posted that, the WxBell Aug 1st version came out. It uses 1981-2010 for climo. WB had the warmest anomalies centered in Nov near 180 for the April-June 1st runs and significantly further E (near 160W) for the July 1st run. WB (using 1981-2010 base) has its Aug 1st Nov warmest centered near 150W, which is C based/basinwide and not E based like weathermodels.com’s (1991-2020 base) 130W. So, the WB 1981-2010 base version also moved E, but not nearly as far as the weathermodels 1991-2020 base version, which has it all the way E to 130W (pretty E based):
WB 7/1/26 SSTa run for Nov (1981-2010 base) centered ~160W

WB 8/1/26 SSTa run for Nov (1981-2010 base) centered ~150W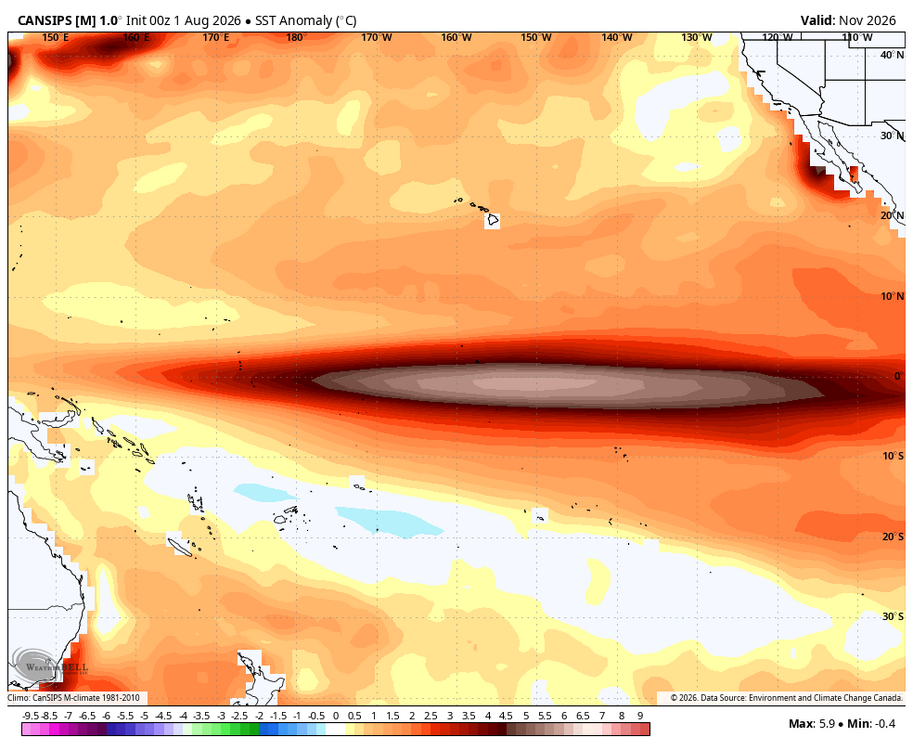
-
1
-
-
19 minutes ago, bluewave said:
Deflect from what? 1987 had a summer pattern that was a reasonable match for El Nino expectations.This summer is completely different.
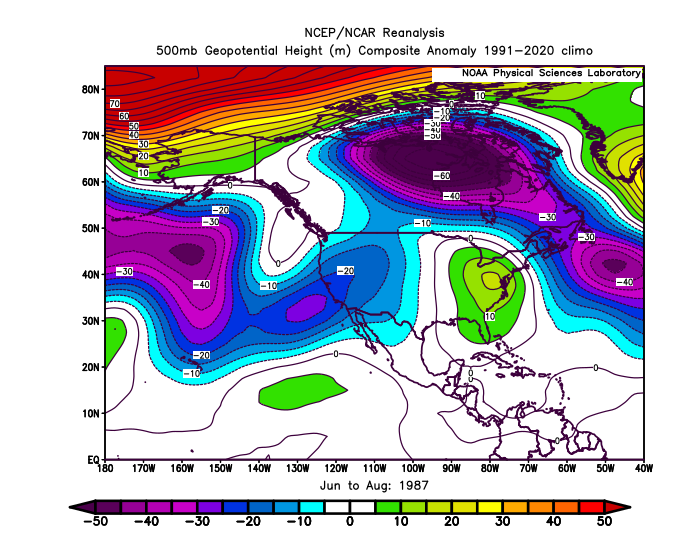
1. Why are you using 1991-2020 for climo for a 1987 summer? That diminishes the above normal H5 in the E US on your 1st map.
2. The highest height anomalies/warmest temp annomalies are in the E US, regardless. How is that El Ninoish?
-
2
-
-
6 minutes ago, bluewave said:
But the summer of 1987 was hot based on the climo centered on the period it was within as I posted. Why are you comparing it to more recent (hotter) climo that makes it not seem as hot? Also, the hottest was in the E 1/2 of the US regardless of what climo you use.
-
 1
1
-
-
OHC is at a new high on this graph:

-
2
-
-
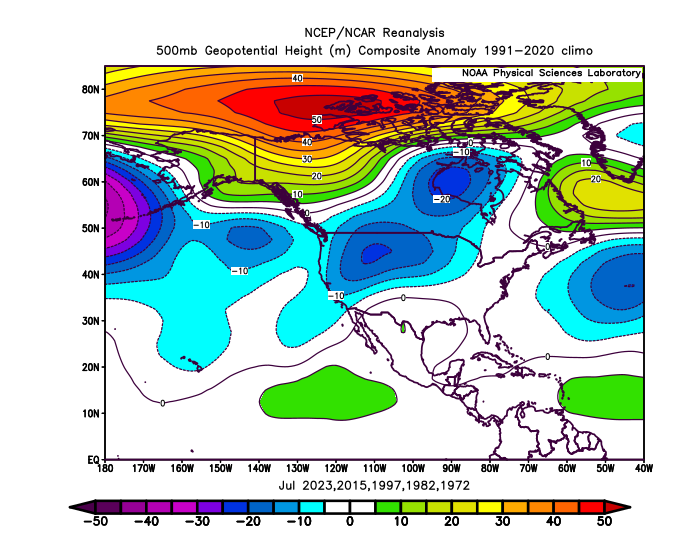
1 hour ago, bluewave said:
The summer of 1991 only had a weak El Niño in progress as opposed the strongest on record this summer. July did have some similarity to the composite.
But sometimes weaker El Niño summers in the past had more heat than the stronger developing ones. This was the case in 2002 also.
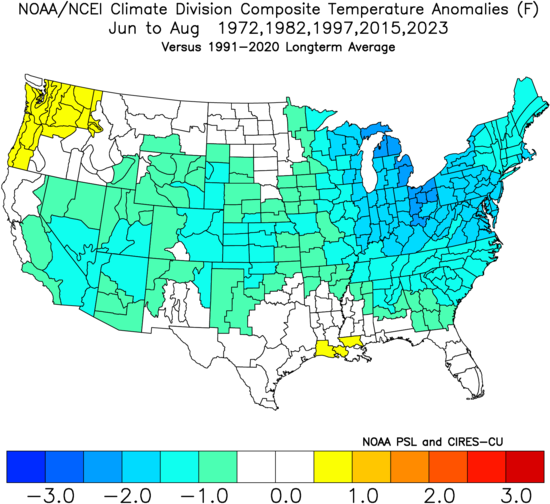
So it has been common in the past for weaker El Niños to have less influence in the midlatitudes than during developing super El Niños like 2023, 2015, 1997, 1982, and 1972 which had the more typical cooler summers.
The big story this summer is how out of phase the mid-latitudes and tropics are for the magnitude of this event.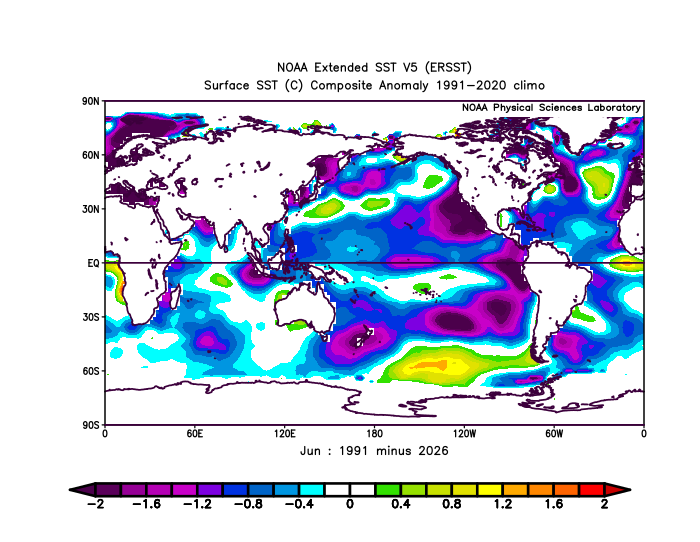
Here’s another unusual one: the summer of ‘87 was similarly hot in the E 1/2 of the U.S. overall and El Niño wasn’t just weak as it was moderate to strong that summer:
-
1
-
-
A cluster of thunderstorms has moved E into the SAV area. Rain started here just after 3PM. Heavy rain started at 3:25PM.
-
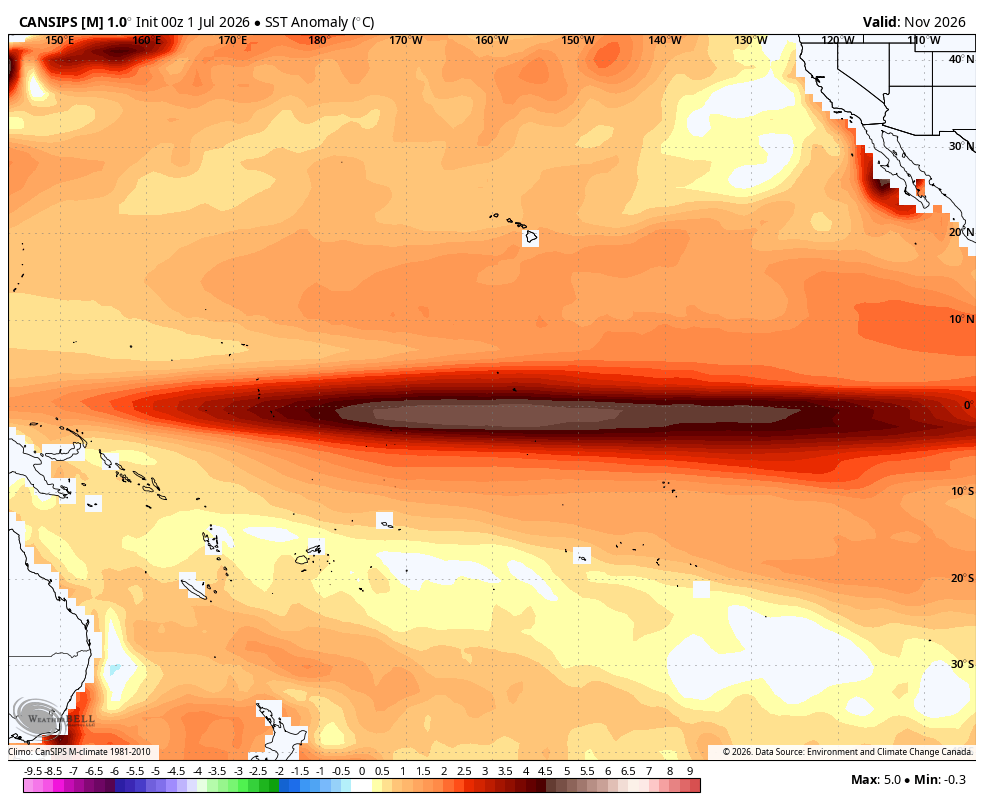
Hot off the press from another source posting the 8/1/26 Cansips run of Nino SST anomalies. It is continuing the CanSIPS run trend of moving the strongest warm SST anomalies further and further east at the ~Nov peak. That’s not surprising because I’ve been suspecting a Modoki bias for it based on the past few years of analyzing it as I’ve posted a number of times here before.
The April-June 1st runs had the warmest anomalies near the Dateline/straight Modoki (W based) in the peak month of Nov. Then the July 1st had warmest anomalies in Nov further E near 160W, more of a cross between central based and Modoki.
The new Cansips run’s Nov peak shows the warmest anomalies centered near 130W, which would be centered in E Nino 3.4/Nino 3 making it pretty E based. Though this run is not as E based as 1997-8, stay tuned to future runs because the E trend of the strongest anomalies on Cansips from run to run may very well not be done due to this suspected Modoki bias.
I can’t post it because the file size is much too large for me to have room in my account. But when it comes out on TT and WxBell, those will be smaller files and thus postable.
-
2
-
-
1 hour ago, michsnowfreak said:
My sister was born July 18, 1991. I was 8 years old and I remember how brutally hot and humid it was. My mom always talks about how it was so hot when she was born.
Out of the dozens of (pre) El Niño summers, 1991 was the 2nd hottest at Detroit on record with only the pre late developing weak Nino summer of 2018 hotter! The 3rd hottest Nino summer was 2002, which preceded a very snowy and cold winter that was one of the coldest and snowiest moderate or stronger El Niño winters there as you know.
-
1
-
-
Darwin’s pressure has averaged 1015+ mb, a high pressure for there, for 22 straight days! That’s a new record (back to 1991) that breaks the old record of 20 days that was set during another developing super Nino, July of 2015. I’m expecting that streak to finally end tomorrow.
-
2
-
-
1. The July SOI comes in way down at -26.8, by far the lowest July SOI on record. The only lower ones during met. summer were the -27.7 in June of 1905 and the -27.0 in June of 1896, both incoming El Niños.
2. This brings us to 82 straight days of -SOI. Going back to when records are readily available (since 1991), this is second only to the 100 days of 1998! It’s too early to tell whether or not the current streak will reach 100 days.
-
1
-
1
-
-
8 minutes ago, donsutherland1 said:
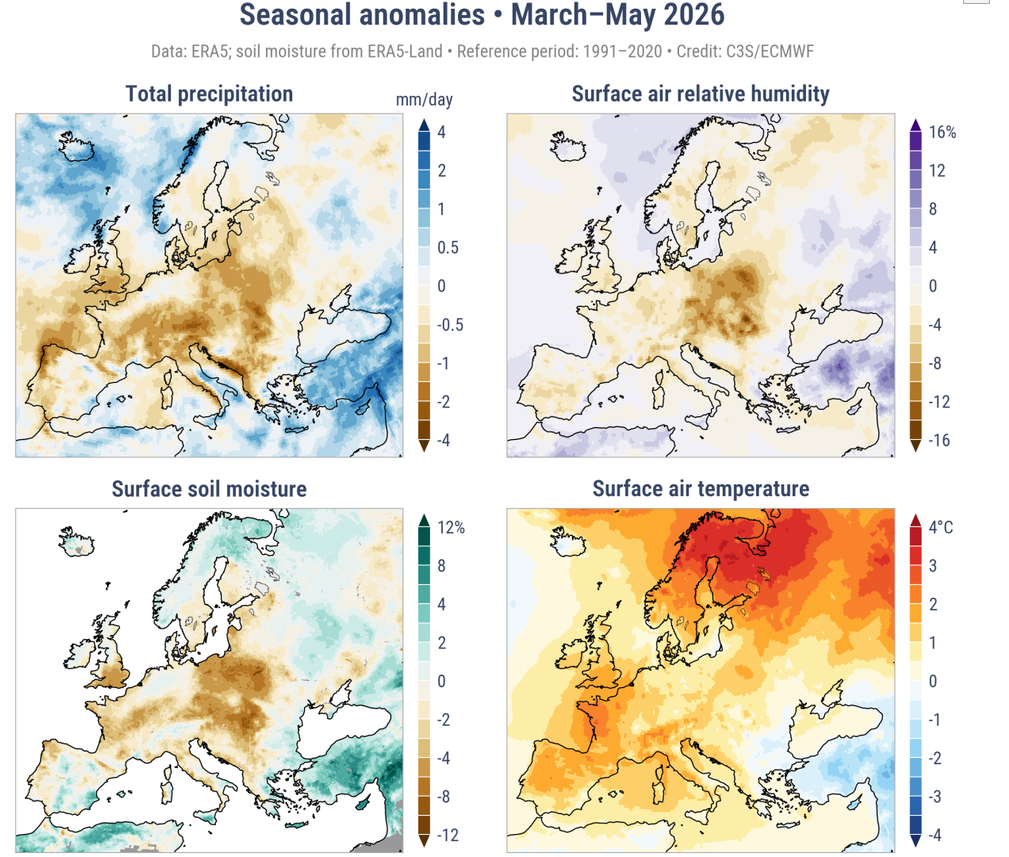
Even as the NOAA's ongoing retreat from data has eliminated updates to the product you posted, the Copernicus provides data showing that European Russia had near to above normal precipitation during spring 2026. The part that had been somewhat dry during spring saw much above normal precipitation in June.
Compare and contrast the surface air relative humidity in Russia vs. France/Spain both in Spring and then June. The data suggested that France/Spain had explosive fire potential given the dry conditions that had emerged there.

June 2026:
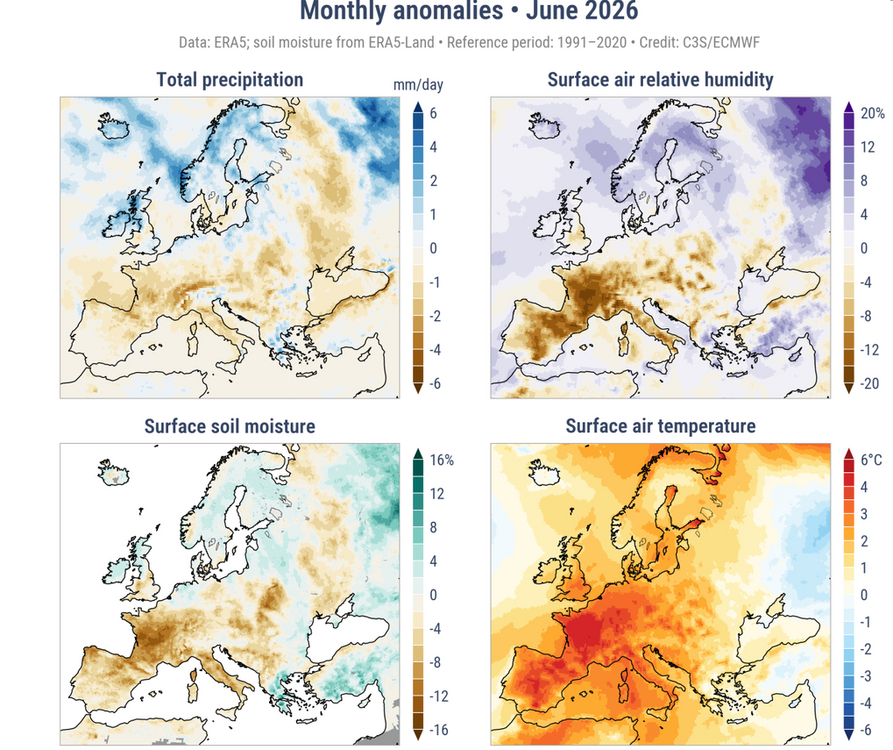
It should also be noted that a wet conditions followed by drought lead to the worst fire potential. Europe saw a severe drought develop this spring.
Relevant excerpt from the scientific literature:
"The combination of abundant fuel (resulting of the 2025 wet spring; Fig. S3d), exceptional heat, and severe summer drought fueled the intense fires that raged across northwestern Spain last year."
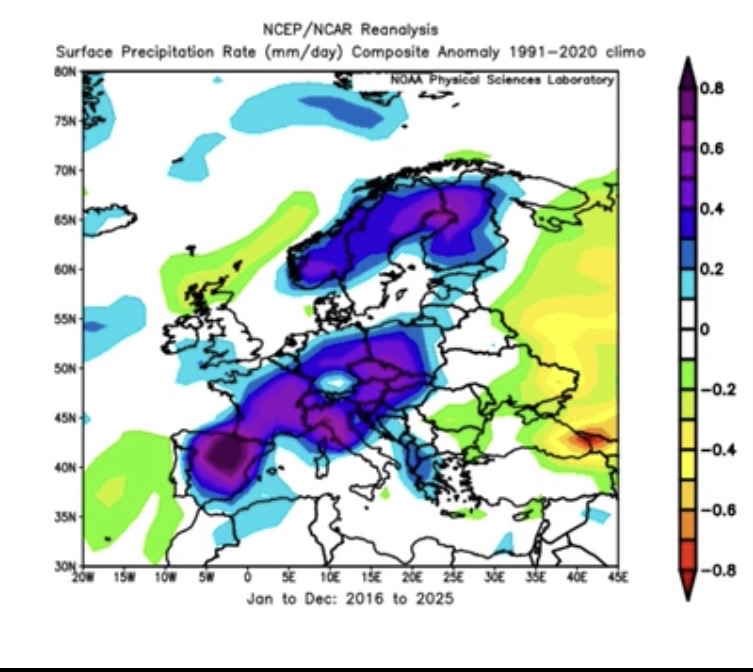
Thanks, Don. But do you have any comments on the wet W, C, and N Europe (~+7”/year) averaged out year-round 2016-25 per the map I posted and how it does or doesn’t relate to CC?
-
2 minutes ago, wncsnow said:
Models are trending towards another heatwave starting late next week
.thumb.png.3d18bf0876b9f8273ee2d0f4e946a01f.png)
Thanks. I see that this is calling for the hottest being 101 at CAE, which would be their hottest of the summer to date. This reminds me that I forgot to mention that CAE finally reached 100 on July 28th although Augusta still hasn’t.
-
1 hour ago, bluewave said:
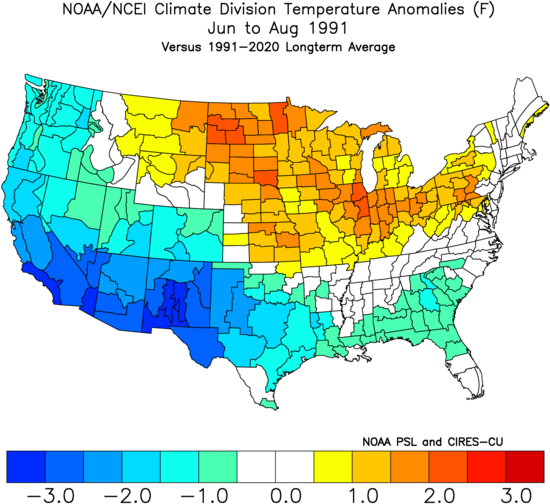
July 1991 actually had a cooler El Niño-like -0.52 pattern across the CONUS compared to the record warmth this July at +2.4.
July 1991 73.87°F -0.52°F It's going to be a close call, but it now appears more likely than not that July 2026 will be the warmest month on record in the Contiguous U.S. As of today, we are essentially tied with July 1936 and July 2012.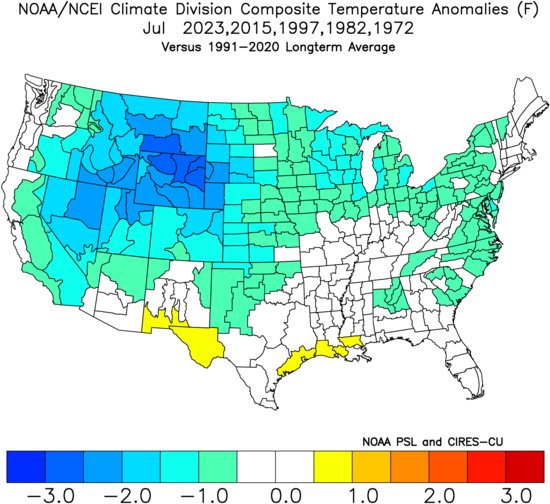
Chris, my point is that the summer of 1991 didn’t follow the pattern of the mean of the other 5 as it was net warmer than normal in the E 1/2 of the Conus vs it being colder than normal for the other 5 years averaged out:
-
Whereas far W Russia/E Ukraine have averaged drier than normal, check out the W, C, and N Europe precip. anomalies over the last 10 years. They’ve been averaging wetter than normal by ~0.5 mm/day, which is ~0.02”/day or ~7”/year wetter than normal. Is this by chance driven by wetter winters? Does anyone have a breakdown by seasons?
Any comments?
-
35 minutes ago, PhiEaglesfan712 said:
I can even see the el nino being so strong that it carries over into a 2nd year, but ending in fall 2027. This will give a head start to developing la nina, which peaks very strong in 2028-29, kind of like 1988-89. It will probably be a one-year la nina, but boy, will it be very strong.
Do you mean El Niño possibly carrying over like 1957-8/1958-9? That’s the closest I could find followed perhaps by 1940-1/1941-2.
-
38 minutes ago, WolfStock1 said:
Re: "Wildfire swept" - I hope people don't think that's due to CC. Because if so - look what Europe as a whole shows:
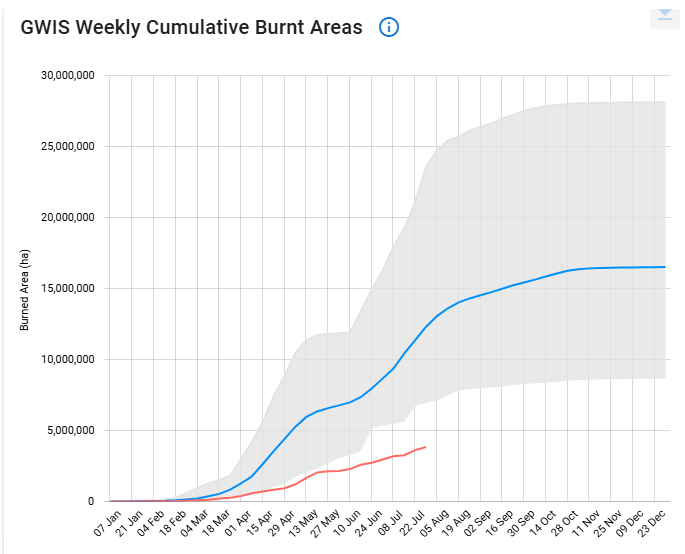
It's an extremely low wildfire year across Europe as a whole.
https://gwis.jrc.ec.europa.eu/apps/gwis.statistics/seasonaltrend
Based on all that I’ve read, the role of CC in overall wildfire frequency/avg size is complex. One thing it is doing is increasing the green-ness of the Earth overall, which is a good thing but which itself also increases amount of fuel for burning. Also, where it is causing drier conditions on average, that along with heat increases fire danger. But wildfire stats, depending on what you examine, don’t necessarily show that wildfires have increased over the decades and in some cases have shown marked decreases. Some of that is likely due to better firefighting resources.
-
Even down here the dewpoints are actually down to 66-67! That’s the lowest I’ve seen quite possibly all month. Temp is 93.3 here vs 100.5 exactly 24 hrs ago (high was 101.1). Skies still have ugly haze with only a few clouds. Winds are light/variable vs yesterday’s hot SW winds.
-
1
-
-
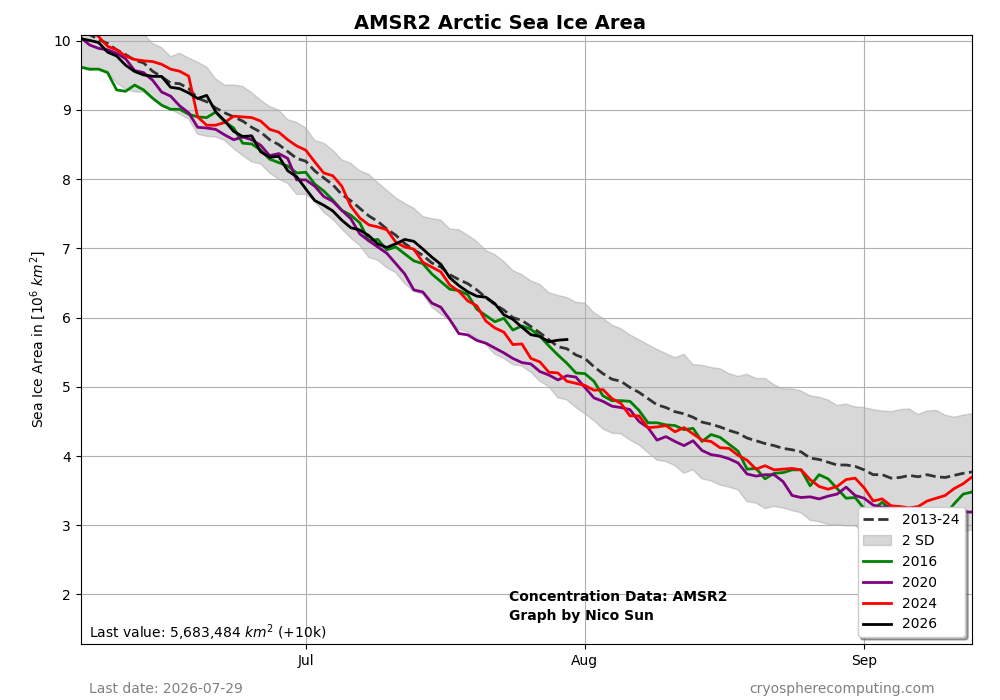
Arctic ice area currently isn’t doing bad at all vs the avg for 2013-24, perhaps helped by the relatively cold 80N+:
-
1
-


.png.9ce195db87904ead3fbfa58cdab17e41.png)

2026-2027 Super El Nino
in Weather Forecasting and Discussion
Posted
They are overall although not the BN Arctic interestingly enough.