

GaWx
-
Posts
11,398 -
Joined
Content Type
Profiles
Blogs
Forums
American Weather
Media Demo
Store
Gallery
Posts posted by GaWx
-
-
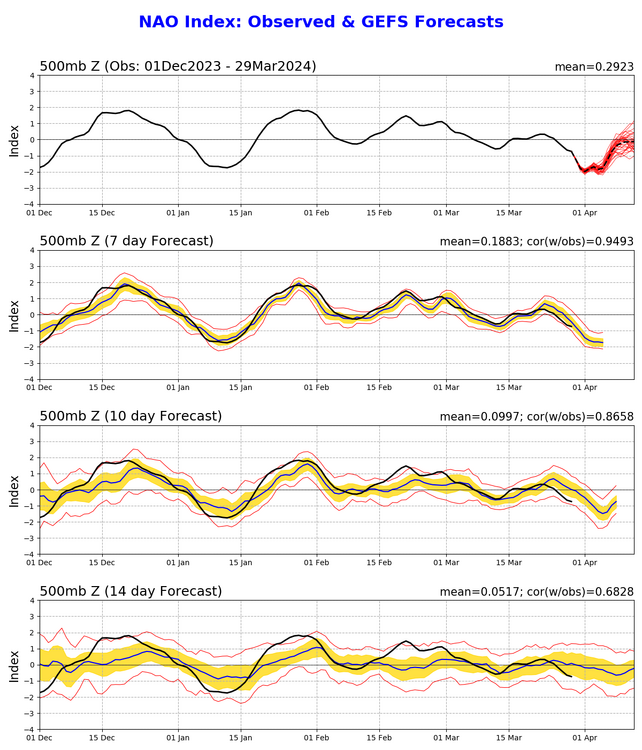
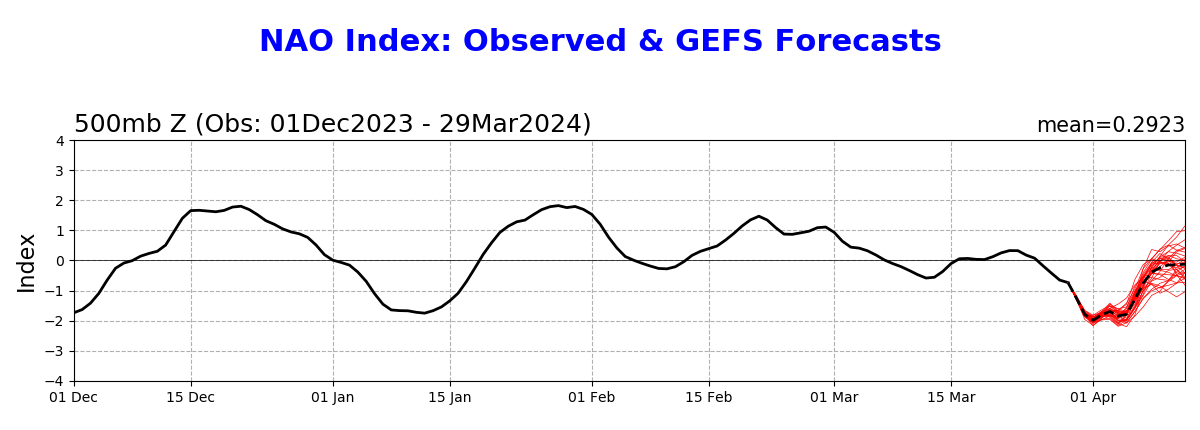
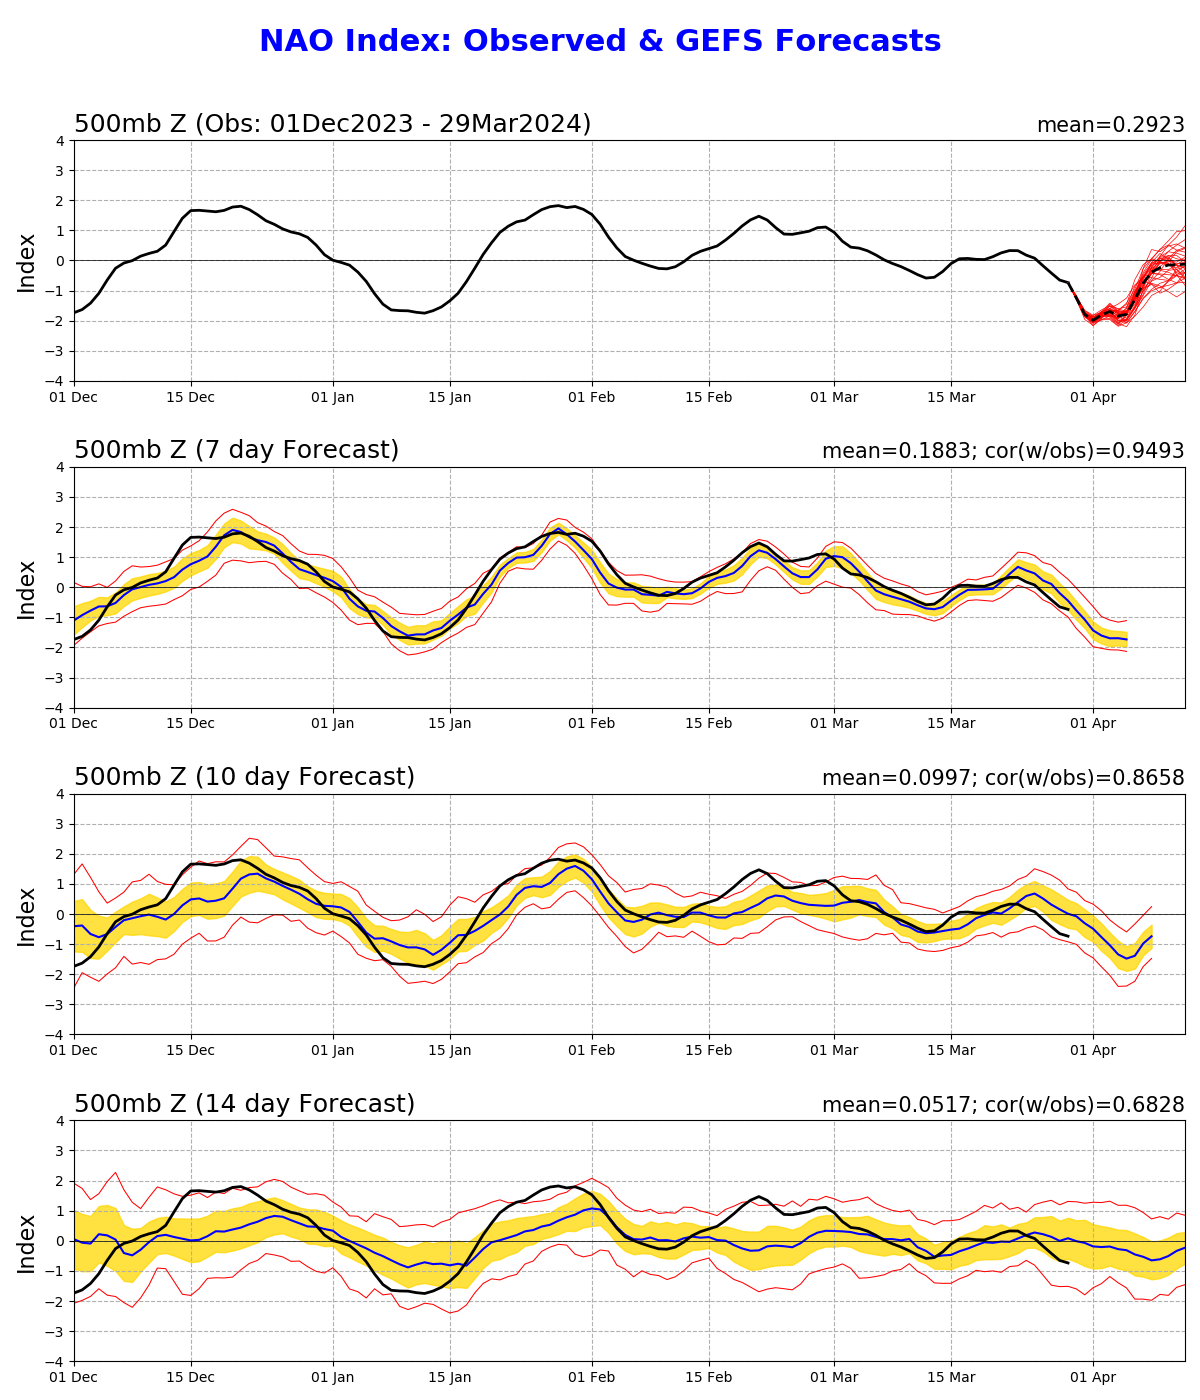
- The 3/29 0Z GEFS run’s mean NAO prediction (see image below) of ~-1.75 for 3/31 is ~tied for the daily record low NAO for all of March (records go back to 1950)! The current March record is -1.75 (3/22/1980). It will also easily beat the current record low for March 31 of -1.3 (1975).
- This run is predicting the lowest NAO to be ~-1.95 to -2.00 (on 4/1). Should that verify closely, it would be a record low NAO (back to 1950) for the entire period covering Feb 15th through April 7th! It will also obliterate the current record low for April 1 of -1.2 (1975).
- This run implies there will be daily record low NAOs March 31-April 2nd and possible daily record lows April 3rd-5th.
- Related to this, the model consensus has a very strong nor’easter for ~April 4th.

Daily NAO back to 1950:
https://ftp.cpc.ncep.noaa.gov/cwlinks/norm.daily.nao.cdas.z500.19500101_current.csv
-
4 hours ago, MJO812 said:
This needed to happen in February
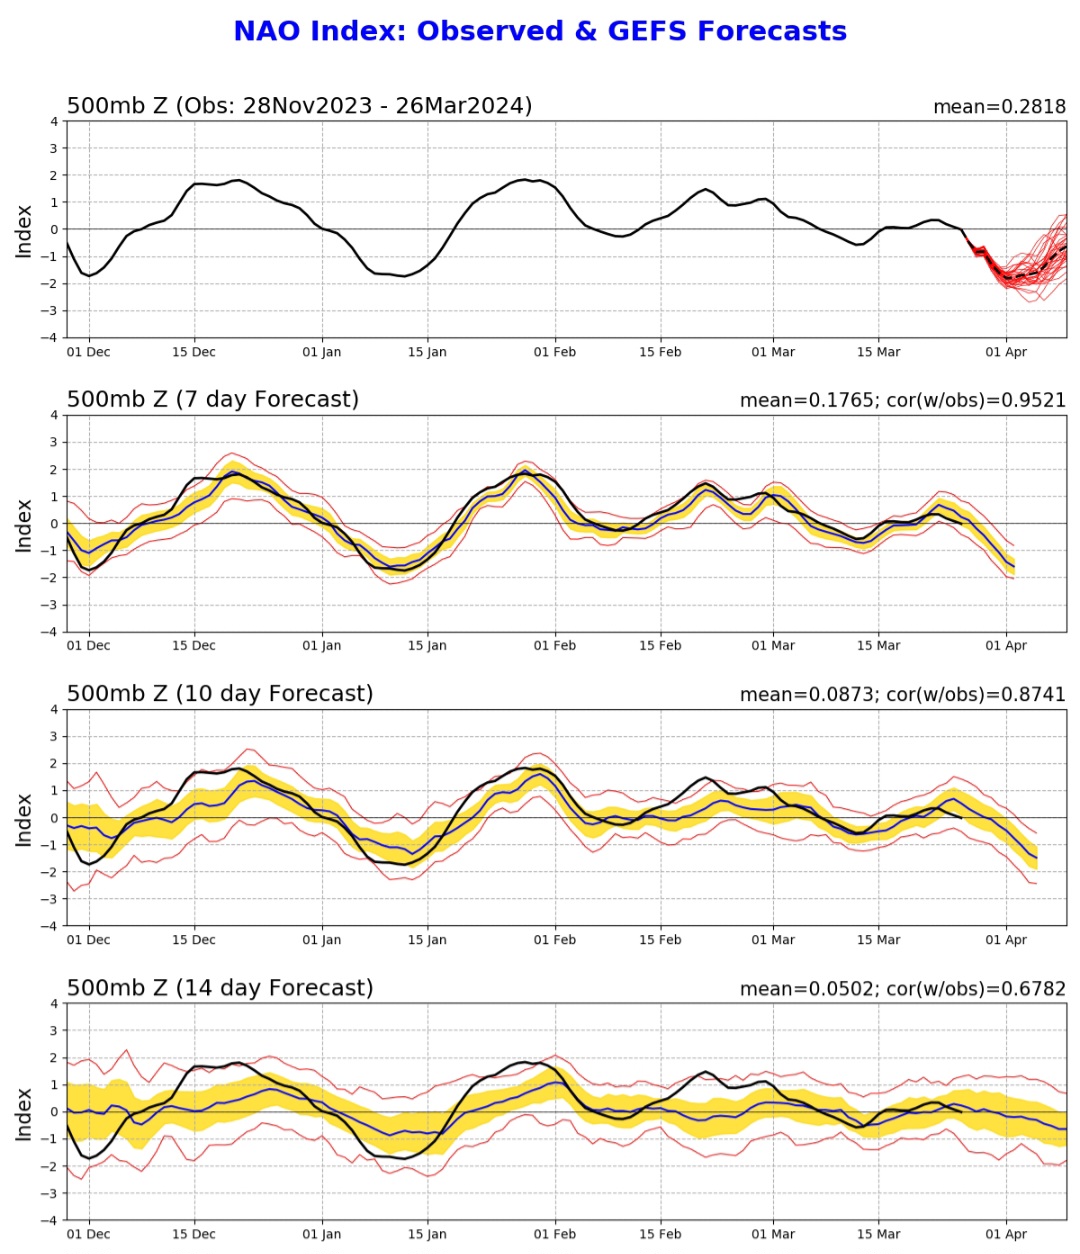
- This 3/29 0Z GEFS run’s mean NAO prediction of ~-1.75 for 3/31 is ~tied for the daily record low NAO for all of March (records go back to 1950)! The current March record is -1.75 (3/22/1980). It will also easily beat the current record low for March 31 of -1.3 (1975).
- This run is predicting the lowest NAO to be ~-1.95 to -2.00 (on 4/1). Should that verify closely, it would be a record low NAO (back to 1950) for the entire period covering Feb 15th through April 7th! It will also obliterate the current record low for April 1 of -1.2 (1975).
- This run implies there will be daily record low NAOs March 31-April 2nd and possible daily record lows April 3rd-5th.
- The progged very strong ~April 4th nor’easter is tied to this very strong -NAO.
Daily NAO back to 1950:
https://ftp.cpc.ncep.noaa.gov/cwlinks/norm.daily.nao.cdas.z500.19500101_current.csv
-
 3
3
-
-
4 hours ago, MJO812 said:

- This 3/29 0Z GEFS run’s mean NAO prediction of ~-1.75 for 3/31 is ~tied for the daily record low NAO for all of March (records go back to 1950)! The current March record is -1.75 (3/22/1980). It will also easily beat the current record low for March 31 of -1.3 (1975).
- This run is predicting the lowest NAO to be ~-1.95 to -2.00 (on 4/1). Should that verify closely, it would be a record low NAO (back to 1950) for the entire period covering Feb 15th through April 7th! It will also obliterate the current record low for April 1 of -1.2 (1975).
- This run implies there will be daily record low NAOs March 31-April 2nd and possible daily record lows April 3rd-5th.
Daily NAO back to 1950:
https://ftp.cpc.ncep.noaa.gov/cwlinks/norm.daily.nao.cdas.z500.19500101_current.csv
-
 1
1
-
-
Beneficial generous rains (0.8”) fell in the Fayetteville, NC, area during the last 24 hours as well as east of there in E NC in the previously dry areas, which were still there as of TUE (3/26). Thus I’m expecting some improvement on next week’s map. Overall, the SE looks great for now as regards a lack of drought in advance of the oncoming La Niña.

-
1
-
-
The 6Z GFS for Apr 4-6 is the coolest since the 6Z of two days back for the SE as a whole. Dewpoints are quite low. Great for outdoors. Frost would be possible in especially some of the colder low lying areas well inland on Apr 5 due to light winds, mainly clear skies, and dewpoints in the upper 20s.
-
-For the period 1955-80, 43% of all months were -NAO (-0.25 or lower) vs 40% +NAO (+0.25+).
-For the period 1981-2023, only 36% were -NAO vs 45% +NAO.
-So, -NAO month frequency has dropped from 43% 1955-80 to only 36% 1981-2023 while +NAO freq has increased from 40% to 45%
-Winter -NAOs during 1955-80 were much more common than they’ve been since.
-Summer -NAOs since 2007 have become much more common than they were previous to 2007.
-1981-2023: only 19% of Jans had a -NAO vs 35% of Aprils, 47% of both Mays and Junes, and 44% of Julys.
I’m wondering how likely AGW/CC has been a major factor in these changes. Anyone have any idea? @bluewave
@LibertyBell may have an opinion.
-
1
-
-
20 minutes ago, LibertyBell said:
So, -NAO aren't becoming less common, they are only becoming less common in winter and early spring.
Somewhere around 50% is what should be expected with how the index is constructed, so rather than assuming they are getting more common in late spring and summer, they are probably becoming less common in winter and early spring.
1. Accommodating for calling -0.24 to +0.24 neutral, I estimate 42% of all months to be expected to be -NAO.
2. In addition to becoming much less common during winter since 1981, they actually have become more common in summer since 2007. @bluewave has posted about a theory that the increased frequency in summer is related to AGW/CC (I think related to increased melting of ice but not sure).
-
1
-
-
3 minutes ago, LibertyBell said:
Check out May too, it's probably even higher than April.
Indeed, 47% of Mays 1981-2023 had sub -0.25 NAO. Also, 47% of Junes and 44% of Julys.
https://www.cpc.ncep.noaa.gov/products/precip/CWlink/pna/norm.nao.monthly.b5001.current.ascii.table
-
1
-
-
44 minutes ago, MJO812 said:
Where was this in Janaury?
1) Only 19% of Januaries 1981-2023 had -NAO (sub -0.25). -NAOs were three times more frequent in Jan during 1955-80 (58%)!
2) This 19% of Jans with -NAO 1981-2023 contrasts with 35% of Aprils during the same years.
3) Actually though, the GEFS chart shows a forecasted -NAO in April similar to that of early to mid Jan. Jan 15-21 near the end of that -NAO was the coldest week of the winter along with two snows.
NAO monthlies:
https://www.cpc.ncep.noaa.gov/products/precip/CWlink/pna/norm.nao.monthly.b5001.current.ascii.table
-
1
-
1
-
-
Is the 12Z GFS on crack? Inquiring minds want to know.
-
 3
3
-
-
56 minutes ago, PhiEaglesfan712 said:
List of El Nino to La Nina transition years (bolded are best analog years for 2024-25)
1954: Weak El Nino -> Weak La Nina (followed by Strong La Nina in 1955-56)
1964: Moderate El Nino -> Weak La Nina
1970: Weak El Nino (preceded by Moderate El Nino in 1968-69) -> Moderate La Nina
1973: Super El Nino -> Strong La Nina
1983: Super El Nino -> Weak La Nina (followed by Moderate La Nina in 1984-85)
1988: Strong El Nino -> Strong La Nina
1995: Moderate El Nino -> Moderate La Nina
1998: Super El Nino -> Strong La Nina (repeated in 1999-2000)
2005: Weak El Nino -> Weak La Nina
2007: Weak El Nino -> Strong La Nina
2010: Strong El Nino -> Strong La Nina
2016: Super El Nino -> Weak La Nina (repeated in 2017-18)
2020: Maybe Weak El Nino (preceded by Weak El Nino in 2018-19) -> Moderate La Nina (repeated in 2021-22 and 2022-23)
I love this kind of stuff! Thanks for posting.
1) I’ll do the same with pre 1950 using Eric Webb’s table: Nino to Nina
1856: mod Nino to mod Nina
1869: mod Nino to weak Nina
1886: mod Nino to mod Nina
1889: super Nino to mod Nina
1903: strong Nino to weak Nina
1920: weak Nino to weak Nina
1924: mod Nino to mod Nina
1942: mod Nino to mod Nina
2) There were nine strong to super Ninos 1850-1950. Of these nine, none transitioned directly to a strong to super Niña, which is very much unlike the four out of the nine strong to super Ninos that you showed did so from 1950-present:
Pre-1950: 1 went to mod Niña, 1 went to weak Niña, 5 went to neutral, 1 went to weak Nino, 1 went to mod El Nino
Webb’s data from here:https://www.webberweather.com/ensemble-oceanic-nino-index.html
-
1
-
-
1 hour ago, PhiEaglesfan712 said:
If we get a strong la nina, then I don't see us having another El Nino until at least 2027-28. There were 4 times we have gone from strong el nino to strong la nina, and each time, the next el nino was at least 3 years later.
1973 - Next el nino was 1976-77 (3 years later, moderate repeated following year)
1988 - Next el nino was 1991-92 (3 years later, strong)
1998 - Next el nino was 2002-03 (4 years later)
2010 - Next el nino was 2014-15 (4 years later, following year would be a super el nino)
There have been 8 strong la nina years. Only once, in 1976 (following the 3rd year of a la nina), did we transition to any type of el nino.
Interesting! With a strong Niña quite possible and even more possible on a RONI basis, I feel your analysis is pertinent. I was just getting ready to post the last times we had a Nino/Niña/Nino progression for any strength of Nino/Nina, which I assume you know at least back to 1950:
1) 2004-5/05-06/06-07 but they were all only weak
2) 1963-4/64-5/65-6 but 1963-4/64-5 were only moderate/weak
3) 1923-4/24-5/25-6 but 1923-4/24-5 were only moderate
4) 1902-3/03-4/04-5: 1902-3 was a strong Nino but 1903-4 was only a weak Nina
5) 1885-6/86-7/87-8 but 1885-6/86-7 were only moderate
The above list fwiw suggests to me that there might be a better shot if 2024-5 were to end up only a moderate La Niña like 1924-5 and 1886-7. After all, it is still way too early to say that it is a forgone conclusion that 2024-5 will peak as a strong Niña. Also, keep in mind the unusual situation of this massive undersea volcanic eruption. Is it possible that analogs are not as useful as they’d otherwise be?
-
1
-
-
Per the link below that pertains to long term impact from the 2022 Tonga volcano, we may very well go right back to El Nino in 2025-6 and quite possibly a multi-year version. Note how the DJF temperature anomaly pattern over the US in figure 7a (which covers the progged peak period of effects 2025-2029 or the interval of 3-7 yrs after eruption) comes rather close to a typical El Niño, including the cool SE and mild NW. Also, note especially figure 11d, which shows an El Ninolike Pacific SSTa pattern:"The MiMA simulations confirm the robustness ofthe SWV-induced wave structure in the Pacific (Fig. 11ef),and they produce tropical surface temperature anomaliesconsistent with an El Ni˜no-like pattern (Fig. 11a-d). Thisheating is produced by the zonally asymmetric distributionof SWV in the tropics, and consistent with the increasedsurface downward longwave flux over the tropical Pacificin WACCM (Fig. 9a). Thus, it is possible that the SWVforcing from the eruption would favor a positive phase ofENSO on a multi-year timescale, but further work is re-quired to confirm this, in particular with a model includingfully interactive ocean and cloud feedbacks."So, @George001may very well be doing several years in a row of “how strong will El Niño get” starting with 2025-6 if this publication were to have a good clue.
-
1
-
-
CANSIPS has Aleutian high/-PNA/+EPO/+NAO/+AO/-PDO in its latest fcast for next winter: yippee I can’t wait
 /hope it is wrong. Regardless, winter is still my favorite season since even a mild one would be 25+ colder with way less humidity than the typical miserable summer here (along with no bugs
 ") ). Also, even a mild one would be far more interesting than summer with much more day to day volatility.
). Also, even a mild one would be far more interesting than summer with much more day to day volatility.

-
2
-
-
On 3/22/2024 at 11:21 AM, GaWx said:
I’ll believe a legit +PDO is coming next winter when I see it.
Posted below is the latest WCS PDO chart showing -0.37 as of March 20. But keep in mind that a -0.37 WCS is comparable to a much more negative NOAA PDO. The Feb 2024 NOAA PDO was still down at -1.33 despite this WCS chart showing every Feb daily being above -0.75 and Feb averaging -0.45 to -0.50:
https://www.ncei.noaa.gov/pub/data/cmb/ersst/v5/index/ersst.v5.pdo.dat
So, the current NOAA PDO is likely ~~-1.20, still a solid -PDO. Also, the chart below shows that the WCS PDO has been oscillating around this same territory since late Jan (despite how warm most of the E US has been since then). Thus, I still see no indication of a clear move toward a +PDO.
For there to be just a weak NOAA based +PDO next winter (say +0.25 to +0.50), the WCS dailies would likely need to rise all of the way to near the +1.00 to +1.25 range. With what appears to be a moderate to strong La Niña coming (probably even stronger on RONI basis as it has averaged a whopping 0.4 cooler than ONI for the last year), that’s highly improbable as of now.
The last La Niña winter with a +0.25+ NOAA PDO was way back in 2005-6 (barely with +0.27) and that one was just a low end moderate Niña at most. The subsequent nine Ninas were either -PDO (7 of the 9) or neutral PDO (2016-7 and 2017-8). Prior to 2005-6, the last +PDO Niña was 1995-6 (moderate Niña). Keep in mind that there’s a good chance for a high end moderate to strong Niña (RONI based) next fall/winter.
There have been 11 seasons with a sub -1.20 low on a RONI basis since 1949-50, which is very likely where we’re headed next fall/winter. None of those winters had a NOAA based +PDO:
1949-50: -1.6
1955-6: -2.2
1973-4: -1.1
1988-9: -0.9
1998-9: -1.0
1999-0: -1.8
2007-8: -1.3
2010-1: -1.8
2017-8: +0.1 (the only neutral PDO and that was with RONI dip to only -1.25)
2020-1: -0.9
2021-2: -2.3
AVG winter PDO for sub -1.2 RONI: -1.3
Based on the above analysis as well as SSTa progs for next winter that I’ve seen, I’m betting heavily that there will not be a NOAA based +PDO (+0.25+) next winter.

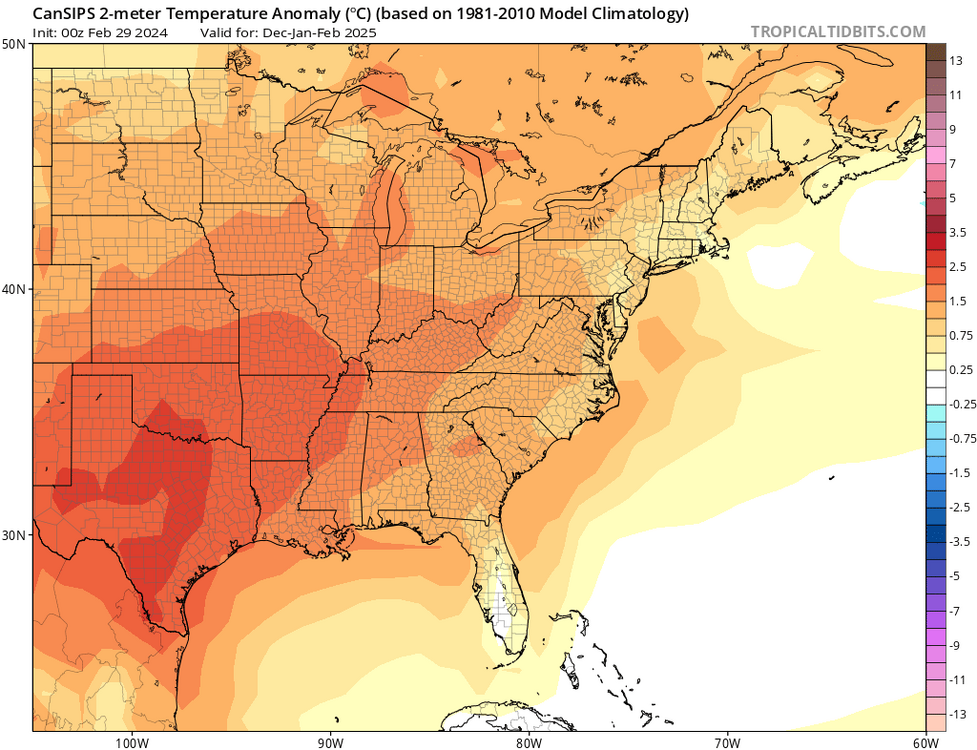
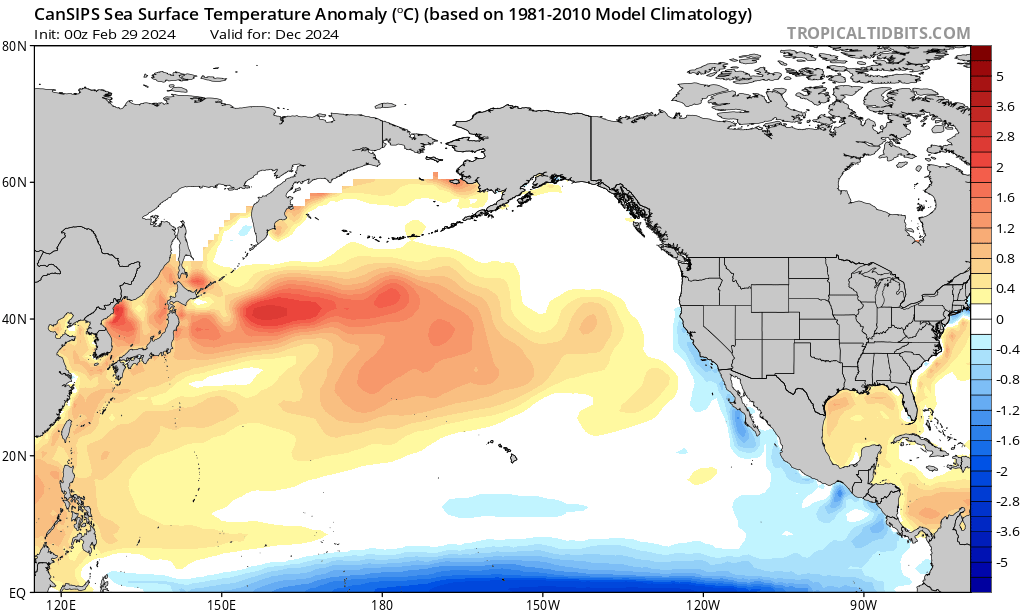
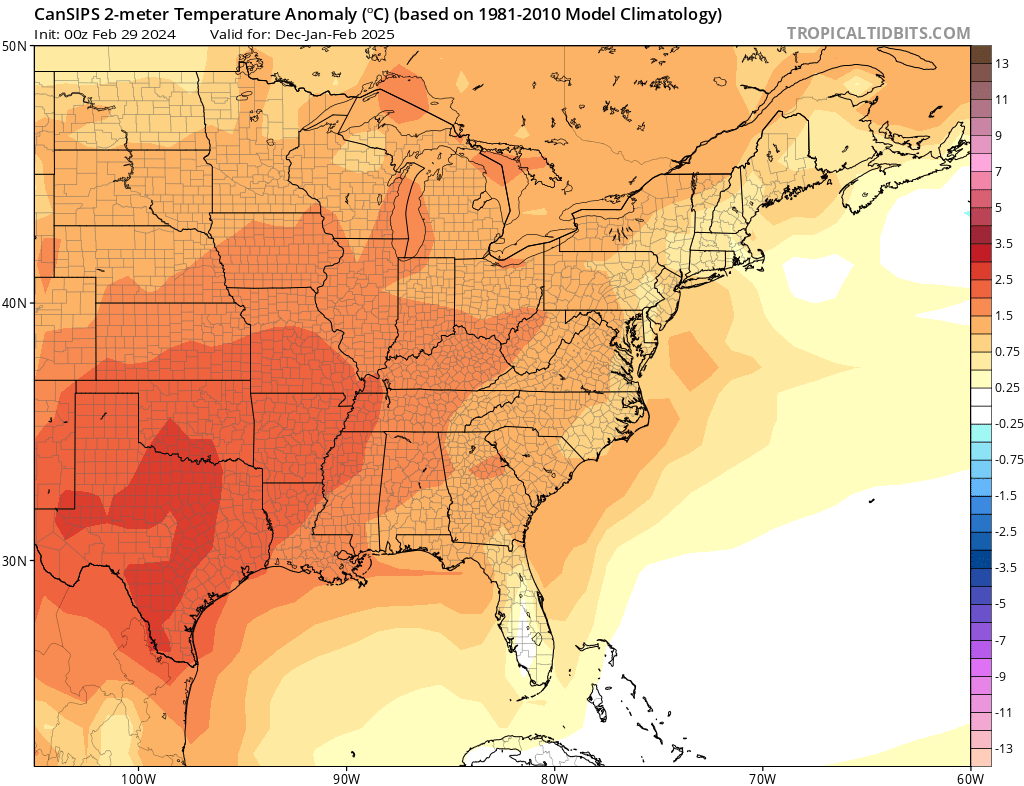
Supporting the above for a -PDO next winter (CFS is similar) (Note that if this verified it wouldn’t at all be E based Niña/closer to Modoki than E based):

2m vs 1981-2010 climo (would be little cooler vs 1991-2020 but keep in mind the cold bias of most models):
-
1
-
-
On 3/23/2024 at 4:23 PM, LibertyBell said:
hmm what kind of la nina was 2010-11?
https://www.cpc.ncep.noaa.gov/data/indices/ersst5.nino.mth.91-20.ascii
-What distinguishes 2010-1 was the combo of a record avg -NAO/-AO for DJ for La Niña.-Feb +NAO/+AO ended that
-Since 1979-80, there have been only 6 -NAO winters (sub -0.25 avg) with all of them occurring during low sunspot #s (sub 35): 1984-5, 1986-7, 1995-6, 2009-10, 2010-1, 2020-1. To compare, the last 2 winters’ sunspots averaged ~120. AGW is quite possibly a factor in limiting -NAO winters while also increasing their frequency during summer.
-
1
-
-
15 hours ago, raindancewx said:
The PDO continues to reverse from pretty negative despite the El Nino falling apart. That's worth watching. The +PDO La Ninas are an interesting bunch.
+PDO tends to be cold East, La Nina tends to be cold North. It's the opposite of last winter where -PDO tends to be cold West, and El Nino tends to be cold South. Years like 1995-96 and 2017-18 are +PDO La Ninas.
I see some indications that the WPO may flip pretty negative in the Fall. That's often accompanied by early Fall snows nationally, but we'll see how that goes.
I’ll believe a legit +PDO is coming next winter when I see it.
Posted below is the latest WCS PDO chart showing -0.37 as of March 20. But keep in mind that a -0.37 WCS is comparable to a much more negative NOAA PDO. The Feb 2024 NOAA PDO was still down at -1.33 despite this WCS chart showing every Feb daily being above -0.75 and Feb averaging -0.45 to -0.50:
https://www.ncei.noaa.gov/pub/data/cmb/ersst/v5/index/ersst.v5.pdo.dat
So, the current NOAA PDO is likely ~~-1.20, still a solid -PDO. Also, the chart below shows that the WCS PDO has been oscillating around this same territory since late Jan (despite how warm most of the E US has been since then). Thus, I still see no indication of a clear move toward a +PDO.
For there to be just a weak NOAA based +PDO next winter (say +0.25 to +0.50), the WCS dailies would likely need to rise all of the way to near the +1.00 to +1.25 range. With what appears to be a moderate to strong La Niña coming (probably even stronger on RONI basis as it has averaged a whopping 0.4 cooler than ONI for the last year), that’s highly improbable as of now.
The last La Niña winter with a +0.25+ NOAA PDO was way back in 2005-6 (barely with +0.27) and that one was just a low end moderate Niña at most. The subsequent nine Ninas were either -PDO (7 of the 9) or neutral PDO (2016-7 and 2017-8). Prior to 2005-6, the last +PDO Niña was 1995-6 (moderate Niña). Keep in mind that there’s a good chance for a high end moderate to strong Niña (RONI based) next fall/winter.
There have been 11 seasons with a sub -1.20 low on a RONI basis since 1949-50, which is very likely where we’re headed next fall/winter. None of those winters had a NOAA based +PDO:
1949-50: -1.6
1955-6: -2.2
1973-4: -1.1
1988-9: -0.9
1998-9: -1.0
1999-0: -1.8
2007-8: -1.3
2010-1: -1.8
2017-8: +0.1 (the only neutral PDO and that was with RONI dip to only -1.25)
2020-1: -0.9
2021-2: -2.3
AVG winter PDO for sub -1.2 RONI: -1.3
Based on the above analysis as well as SSTa progs for next winter that I’ve seen, I’m betting heavily that there will not be a NOAA based +PDO (+0.25+) next winter.
-
2
-
1
-
-
On 3/19/2024 at 12:10 PM, GaWx said:
Indeed, it looks wet for many areas of the SE late week into the weekend. Also, the latest drought map for the SE overall looks good and way better than it looked 2.5 months ago thanks to El Niño. I know N GA could use a break from recent heavy rains with plentiful creek/river flooding (I saw it) and fortunately it doesn’t look too heavy there. My area (SE GA) has averaged near normal though not too far away in Charleston it has been too wet.
This is how bad it was 12/26/23:
Fantastic improvement most areas since then with dry area of E NC in line for heavy rain by weekend:
Drought monitor map from today (as of 3/19/24): far NW GA dry area gone, but E NC area expanded slightly including in the Fayetteville vicinity. Based on most model runs’ precip progs for the next 10 days (i.e., assuming the 6Z GFS won’t verify), there may be no yellow in NC.

-
3
-
-
On 3/19/2024 at 1:01 PM, NorthHillsWx said:
Yep the drought from last fall has been erased but we haven’t had measurable rain since March 9 and it’s quickly dried out during that time. Friday should be wet but we’ve seen a lot of recent systems fall apart for central NC this spring so hopefully that trend is halted. April and May are typically dry months for us so going into them dry can be a bad thing as we start to really warm up.
After the late week/weekend expected good rains in a decent portion of the SE, mid to late next week also looks wet for much of the SE on most runs of the various models, including ensembles. However, the 6Z GFS was a good bit less wet for mid to late next week than most prior runs. Then again, its own ensemble mean says the op is a dry outlier.
-
24 minutes ago, michsnowfreak said:
Assuming that's a typo on the bottom graph (meaning it should be 2020-21) I'd have to say his forecast was dead on here. The "normal" line runs through Detroit and DTW finished the winter +0.1°.
Also, am I reading correctly? Did he actually forecast 2013-14 to be a warm winter

1. Yes, that’s a typo on the bottom graph.
2. He actually did well with his cooler revision for 2020-1. My point in showing that though was to show that he’s not held onto a mild forecast for that region since at least 2013-4 due I assume to having a cold bias/warm winter forecasts are bad for business. There are companies that are more objective and will not be afraid to go warm giving them much more credibility.
3. My bad due to poor wording. I don’t know what he forecasted for 2013-4. The only reason I referred to it is that the furthest back ones I can find only go back to 2014-5.
-
1
-
-
Anyone want to bet that Joe Bastardi won’t go 3+ F warmer than normal for the bulk of the Ohio Valley, Mid-Atlantic, and New England for his FINAL winter forecast for 2024-5? I’m not talking about any preliminary forecasts. I actually hope I’m wrong because I’d like to see him do it for a change for his final. I can’t tell you how long it has been since he did just that. One at the very least has to go back to 2013-4 for the final one to possibly be that warm. I actually don’t know what he had for 2013-4 or earlier because I can’t find them. WxBell started ~2010.
His preliminary winter forecast for 2020-1 was ~+3 to +4 for the bulk of the Mid-Atlantic and much of the Ohio Valley (New England was +2 to +3):
But then he cooled it way down for the final to mainly +0.5 to +1: that’s why I say wait until the final is released

-
On 3/18/2024 at 6:44 AM, NorthHillsWx said:
Hopefully we get some good rains Friday-Saturday because it looks exceptionally SE-ridgy/dry beyond the weekend and it truly hasn’t rained much here lately. Western areas and South Carolina a different story
Indeed, it looks wet for many areas of the SE late week into the weekend. Also, the latest drought map for the SE overall looks good and way better than it looked 2.5 months ago thanks to El Niño. I know N GA could use a break from recent heavy rains with plentiful creek/river flooding (I saw it) and fortunately it doesn’t look too heavy there. My area (SE GA) has averaged near normal though not too far away in Charleston it has been too wet.
This is how bad it was 12/26/23:
Fantastic improvement most areas since then with dry area of E NC in line for heavy rain by weekend:
-
3
-
2
-
-
No snakes today and a great walk with mid 60s temp and dewpoints near 38 along with a nice NW breeze.
-
2
-
-
Cool time lapse of the big mid-March snowstorm in Evergreen, CO, located at 7.2K ft 20 miles WSW of Denver or 10 miles SW of Golden:
https://m.facebook.com/WeatherNation/videos/3-days-worth-of-snow-in-24-seconds/732334295379764/


Historic -NAO intensity coming Mar 31 through early April
in Weather Forecasting and Discussion
Posted
Not much directly as it will fortunately be over before then.