

GaWx
-
Posts
11,398 -
Joined
Content Type
Profiles
Blogs
Forums
American Weather
Media Demo
Store
Gallery
Posts posted by GaWx
-
-
I’ve taken thousands of walks and until yesterday evening I had never seen three snakes in one walk. I don’t know if I’ve even seen two though I may have once or twice. 99% of the time I see none. So, seeing three yesterday was so ridiculously improbable! Two were poisonous and both apparently were Copperheads of different types. I’d post pics of them here but can’t due to attachment limits.
Temperatures were in the 70s while dewpoints were in the 50s. The breeze was light.-
 2
2
-
-
There are some model hints that the period around 3/23-5 might include interesting wx in a good portion of the SE. Keep in mind that “interesting wx” and “winter storm” are not one and the same even though a winter storm is obviously interesting.
-
3
-
-
The models are near unanimous in showing a sub -20 mean 10 mb (strat.) wind at 60N on March 15th. That would be the 2nd most negative 10 mb wind in March since records started in 1959.
-
2
-
-
1 hour ago, iluvsnow said:
Was just reading about the "most anomalous" weather month in US history....March 1843. Fascinating reading. It included a huge midmonth snowstorm in Tennessee and 25 degree below normal temperatures for the month of March for much of the central and eastern US. Fort Snelling in St. Paul Minnesota averaged an unbelievable 4 degrees above zero for the month. Snow fell in Tennessee well into April. Just wonder what kind of meteorological setup could have produced such weather.
https://www.researchgate.net/publication/284436645_March_1843_The_Most_Abnormal_Month_Ever
March of 1843 was truly amazing! From David Ludlum:
Confirmation that the cold and snowy regime of March 1843 was widespread across the Southland came from a new observing post in southwestern Arkansas.
In 1840 Nathan D. Smith of Washington; Hempstead County, near Texarkana, commenced a series of very good records which continued at least until the opening of the Civil War. The period from 1840 to 1859 was published in tabular form by the Smithsonian Institution in October 1860, and the record in manuscript is available until April 1861.° March 1843 (35.3°) was the coldest month in Dr. Smith's record save January 1856 (34.0°).
His maximum of 70° came on the 30th, the minimum of +6° on the 16th. There were two 4-inch snowstorms, on the 15th and 24th-the same dates that Natchez received a like covering. On another occasion glaze formed on trees, and on another sleet fell.
-
1
-
 1
1
-
-
Beautiful dry spring wx is expected again the next two days.
-
On 2/3/2024 at 3:34 PM, GaWx said:
The unrounded ONI max came in at +1.97. RONI never made strong with another +1.49.
I just noticed that the unrounded ONI peak (NDJ) was revised down slightly from +1.97 to +1.95:
https://www.cpc.ncep.noaa.gov/data/indices/oni.ascii.txt
The RONI peak remained at +1.49 (OND)(border of moderate and strong):
https://www.cpc.ncep.noaa.gov/data/indices/RONI.ascii.txt
-
Yesterday was quite nippy here in the ATL area with 50s and 20 mph winds. Today was beautiful and felt much warmer with 60s highs, much lighter winds, and sunshine. It was a great day for walking at the park I was at. The water was high due to last week’s 4-5” of rainfall. I saw several turtles on the lake’s edge.
-
1
-
-
17 hours ago, StantonParkHoya said:
RDU never gets below 40 on the 6z GFS through 384
Same with the 18Z GFS it appears. The Euro suites have generally been colder. We’ll see which comes closer.
-
1
-
-
Yesterday’s was the coldest Euro Weeklies map for 3/18-25 since the first one issued. See image below. That doesn’t equate to wintry precip. even if it were to verify. It means a cool period overall would be on the way, including frost and freeze potential. In the meantime a short cool period is on the way prior to then early next week. In addition, the last week of this month has been looking cool on each run though it wouldn’t be as cool per how it is on the run.
-
9
-
1
-
-
Most of the ATL area got well over 2” of rainfall for the event ending yesterday and a similar amount is likely for Fri-Sat. Flood watches are already up.
-
1
-
-
I thought this thread and others similar to it are supposed to be for forecast discussion of any aspect of wx that any poster wants to post about rather than being restricted to just discussion of wx a particular member reading the posts wants. Am I mistaken?
Anyway, whether or not any particular member wants or cares about potentially the coldest period in 2 months near and just after St. Patrick’s Day, I’m going to continue to post about it, regardless, whenever I have the chance and feel like it. Otherwise, why does this thread even exist? I find many aspects of wx interesting.
-
17
-
1
-
-
On 3/4/2024 at 9:30 AM, GaWx said:
Model consensus is suggesting a short chilly period in one week and a potentially colder period in about two weeks (near/just after St. Patrick’s Day).
No change from the above. Ups and downs with a short chill early next week and a potentially longer and colder period starting around St. Patrick’s Day. The St. Patrick’s cold could be intense for mid to late March. Hard freezes in much of the SE wouldn’t be a shock as we will have a very weak SPV through the rest of the month favoring -NAO/-AO and mid to late March El Niños of 1881, 1885, 1906, 1914, 1915, 1926, 1940, and 1983 had hard freezes.
This obviously could be overdone but the 12Z Euro (AI) has 850s WAY BN even based on 1981-2010 climo with below 0C well down into FL! Will stupidity become a reality? We could very well see the coldest (in the absolutes, not just in the anomalies) since Jan 21st-22nd! Stay tuned ITT for further updates as they become available.
-
5
-
 1
1
-
-
Model consensus is suggesting a short chilly period in one week and a potentially colder period in about two weeks (near/just after St. Patrick’s Day).
-
5
-
-
54 minutes ago, bluewave said:
I removed the original post since you completely missed the points that I was trying to make. I will try to break it down piece by piece in this new post.
While the geographic locations of the temperature anomalies this winter we’re correlated to the El Niño, the magnitude of departures could not simply be reduced to saying it was a result of the El Niño. Sections to the north and the CONUS had their warmest winter on record with departures in spots above +10 against the warmest 30 year climate normals over the 91-20 period. The intensity of this El Niño wasn’t nearly as strong as the past winters which were previous the warmest record holders. So there was much more than just the El Niño going on this winter.
My reference to the difference in the 500 mb anomalies this winter from past El Niño instances goes to the issue of why the deeper trough which was modeled by the Euro seasonal didn’t occur in the South.
First, we saw record warmth for the WPAC basin during an El Niño. This is what I was pointing out in this thread last fall. My concern was that the risks to the winter forecasts would be much warmer than the computer models from various centers were indicating. It’s also why one dimensional model forecasts based mostly on El Niño were biased so cold. The more westward forcing even at times back to the eastern IO combined with the El Niño to produce warmth well beyond any seasonal forecast this winter. So these marine heatwaves in the warm forcing areas for North America realized through unusually active MJO 4-7 action for an El Niño contributed to the much warmer departures than a one dimensional El Niño model would suggest. So the more westward forcing for an El Niño would tend to weaken this trough and cold potential in the south. This forcing combined with the El Niño through the El Niño set of MJO composites also created the stronger 500 mb and ridge and warmth to the north.
A second reason I showed 500 mb charts was to illustrate how different a response we got from the Aleutian low this winter than has typically been the case with stronger El Niños.This was the weakest Aleutian low response we have seen from a stronger El Nino. My guess is this is related to the more westward forcing lean which actually produced a ridge south of the Aleutians and to the NW of Hawaii instead of the trough being forecast by the models. Now you can say this is related to the -PDO and to an extent this is the case. But the -PDO this winter was more defined by the warm waters near Japan and west of the Dateline rather than the usual cold ring In the east. So we have seen a shift in the way the PDO has be manifesting in recent years. Plus there have been recent studies that the PDO is more of an effect than a cause of the pattern across the North Pacific. This SST pattern may just be an effect of the predominant forcing at any given time.I would agree with you that the enhanced STJ was one of the more typical El Niño responses this winter which did work out. But the extreme flooding and record rainfall in places like California was stronger in spots than even the 97-98 El Niño which was much stronger could muster. So another example of the overlapping influences this winter.
Keep in mind that if one were to go by RONI or MEI peaks, 2023-4 was a moderate rather than a strong El Niño.
-
1
-
-
The very inaccurate extended models fwiw suggest stupid cold vs late March normals to occur in the SE after midmonth similar to El Niños of 1881, 1885, 1906, 1914, 1915, 1926, 1940, 1983. This would be 2-3 weeks after the upcoming strongest of season strat 10 mb wind reversal. The SE is way overdue for Nino late Mar stupidity. Look how often it occurred through 1940. As the great philosopher once said, winter ain’t over til it’s over.
-
5
-
 1
1
-
1
-
-
6 hours ago, michsnowfreak said:
Top 10 ACE years/snowfall following cold season
1933 DTW: 42.6"
2005 DTW: 36.3"
1893 DTW: 45.5"
1926 DTW: 46.3"
1995 DTW: 27.6"
2004 DTW: 63.8"
2017 DTW: 61.0"
1950 DTW: 42.2"
1961 DTW: 28.1"
1998 DTW: 49.5"
AVG DTW: 44.3” vs 41.1” mean (8% above mean) all years since 1874; 2 MAN, 3 AN, 2 NN, 2 BN, 1 MBN; 7 out of 10 above median.
I also note that for Modoki La Ninas snowfall is also above avg:
1973-74: 49.2"
1975-76: 55.9"
1983-84: 51.8"
1988-89: 25.1"
1998-99: 49.5"
2000-01: 39.0"
2008-09: 65.7"
2010-11: 69.1"
2016-17: 37.9"
Avg: 49.2 vs 41.1” mean (20% above mean) all years since 1874.
Question though and I apologize if I missed it. Are we just assuming this years ACE will be high? Or is it a foregone conclusion?
ACE level is never close to a foregone conclusion.
-
2
-
-
This is about the most impressive widespread cold rain of the season to date for the main CAD regions with many areas in the upper 30s, including here in much of the northern half of Atlanta metro. Definitely feels like mid-winter!
Moderators, please pin this. TIA
-
1
-
-
1 hour ago, michsnowfreak said:
Does anyone have a link to yearly ACE numbers? @raindancewx has me Intrigued lol.
https://en.m.wikipedia.org/wiki/Accumulated_cyclone_energy
Top 10 ACE years/snowfall following cold season
1933 NYC: 52.0”; BOS: 62.7”
2005 NYC: 40.0”; BOS: 39.9”
1893 NYC: 39.2”; BOS: 64.0”
1926 NYC: 22.3”; BOS: 41.1”
1995 NYC: 75.6”; BOS: 107.6”
2004 NYC: 41.0”; BOS: 86.6”
2017 NYC: 40.9”; BOS: 59.9”
1950 NYC: 9.3”; BOS: 29.7”
1961 NYC: 18.1”; BOS: 44.7”
1998 NYC: 12.7”; BOS: 36.4”
AVG NYC: 35.1” vs 28.5” mean (23% above mean) all years since 1868-9; 1 MAN, 5 AN, 0 NN, 2 BN, 2 MBN; 60% above median
AVG BOS: 57.3” vs 43.1” mean (33% above mean) all years since 1890-2; 2 MAN, 3 AN, 4 NN, 1 BN, 0 MBN; 70% above median
If you get a chance, calculate the mean/median for these same 10 years for Detroit. Each season’s snowfall can be obtained here:
https://www.weather.gov/wrh/Climate?wfo=dtx
I’m curious to see what you find. Also, DC folks can go here for their snow:
https://www.weather.gov/wrh/Climate?wfo=lwx
-
3
-
-
Went through a line of severe thunderstorms S of ATL near McDonough a little while ago during a trip to ATL. The line had gone through ATL, itself, a little earlier. The temp is only 56, about 20 colder than before the line. That’s a sharp cold front!
-
1
-
-
57 minutes ago, Terpeast said:
Good question. They aren’t so different in certain domains like ENSO, IO, MC, and even off the US West coast. But in the extra-tropical west pacific they could not be more different.
I think part of the answer is that the marine heat wave off Japan is an extreme climatological event that is neither reproducible or predictable by any climate model, let alone any seasonal forecasting models.
Find a way to dissipate that marine heat wave, then maybe we have a chance at colder winters again.
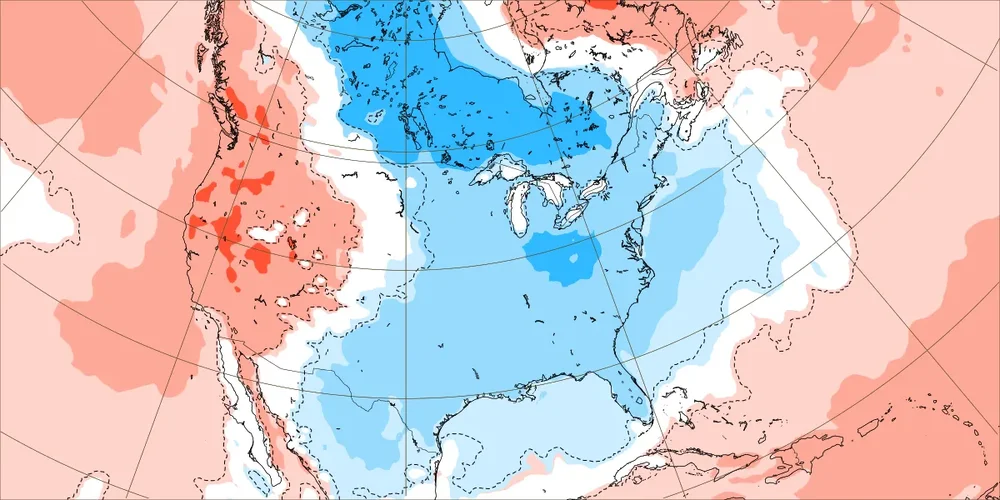
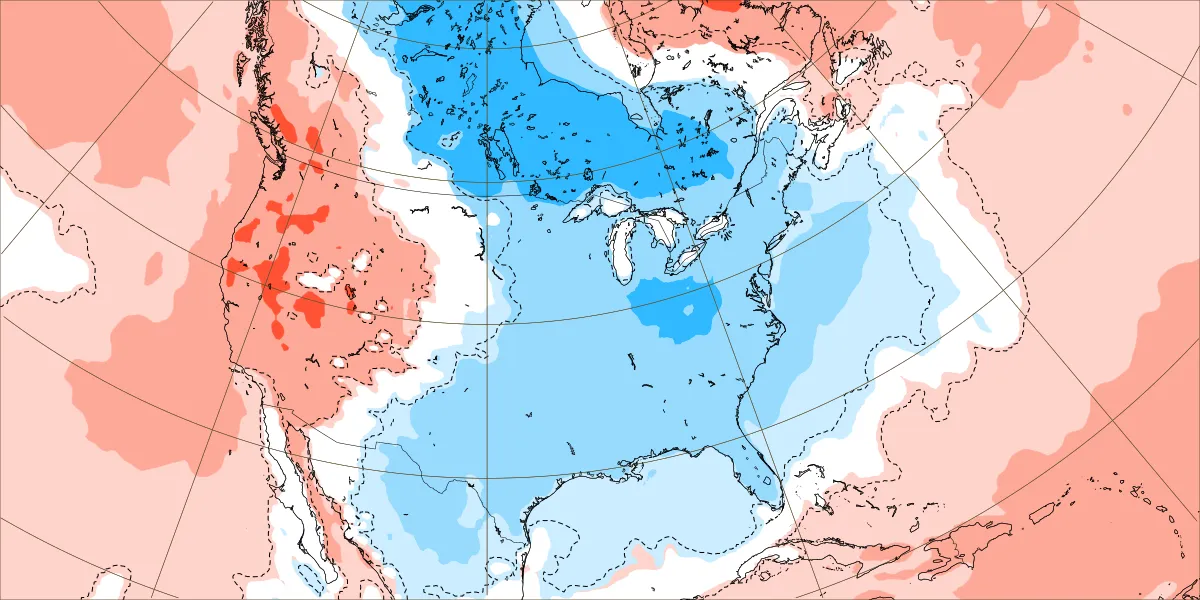
In addition to the extra-tropical W Pac, look at how much colder WB’s CFS map is vs the TT CFS map off the SE US, E of Australia, and in the W Atlantic off Argentina. All 4 of these areas have below normal/blue shades on the WB map and above normal/red shades on the TT map even though they’re both from the same model for the same month (November).
I agree about the importance of the dissipation of that marine heatwave off Japan.
-
1
-
-
3 hours ago, MDstorm said:
Thank you for the maps!
WB results for E 1/3 of US winters:
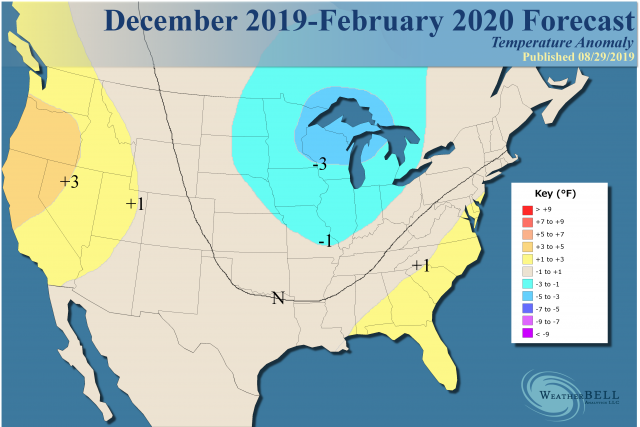
1. 2019-20: much too cold everywhere
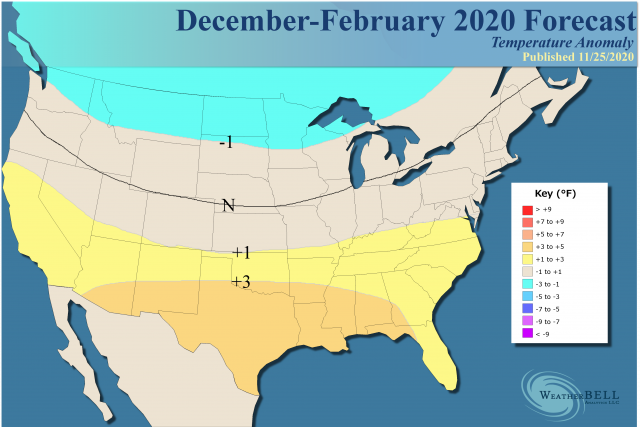
2. 2020-1: excellent Mid-Atlantic to N. Eng to Michigan; too warm SE/TN Valley; much too warm lower Gulf states to Gulf coast
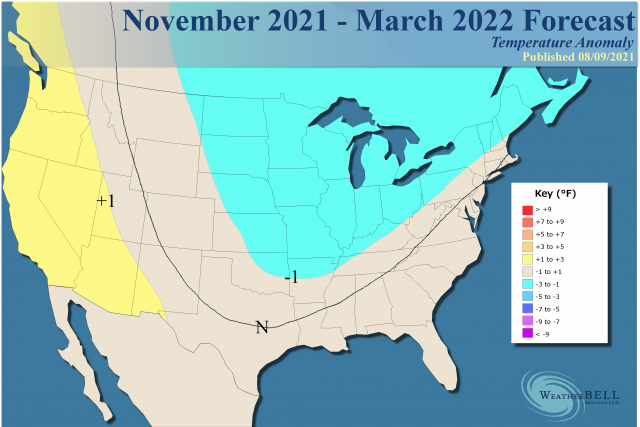
3. 2021-2: excellent N. Eng to Mich; slightly too cold Mid-Atlantic to Ohio Valley; too cold SE/TN Valley
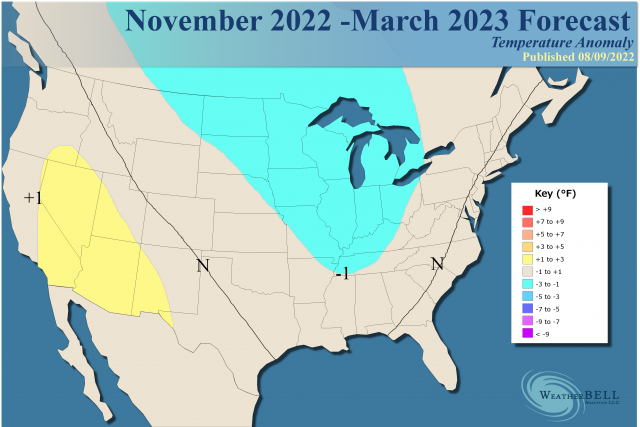
4. 2022-3: much too cold everywhere
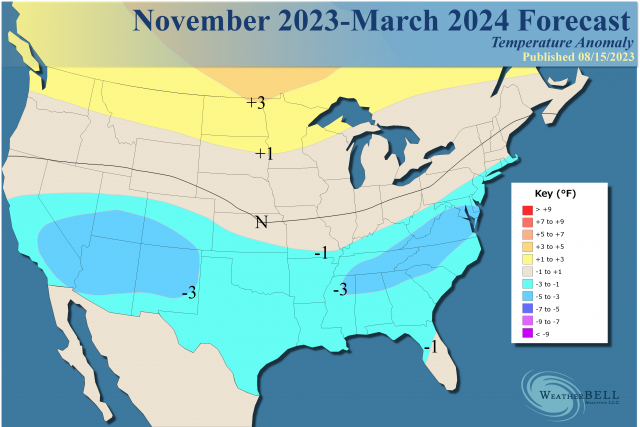
5. 2023-4: much too cold everywhere except only moderately too cold deep SE/pretty close FL
In summary for these 5 winters:-never too warm Mid-Atlantic to New England to Michigan to Ohio Valley
-too warm once SE/TN Valley/Gulf coast states
-much too cold most or all areas 3 of 5
-did very well New England to Michigan twice
My source for actual:
https://psl.noaa.gov/data/usclimdivs/
——————————————-
*Edit to include three added later:2016-7: much too cold everywhere
2017-8: excellent overall/best of the 8; most areas excellent though SE slightly too cold
2018-9: much too cold everywhere except only moderately too cold Mich and only slight misses New England
So, updated summary for all 8:
-good to excellent most of New England to Michigan 4 of 8: kudos!
-too warm one of 8 SE/TN Valley/Gulf coast states
-virtually none of Mid-Atlantic to New England to Michigan to Ohio Valley too warm even once
-combined with much too cold most or all areas 5 of 8 times suggests cold bias
-
3
-
-
I just noticed that the 2/25 and 2/26 extended GEFS runs are colder for 3/10-14 vs earlier runs and that the 2/26 run is significantly colder than earlier runs for 3/20+ fwiw. Perhaps this is the very weak SPV having a say so but who knows? And the extended models can’t be trusted regardless.
-
4
-
-
Regarding JB’s wondering about a possible +PDO next winter, I now think I know where he got that from. If interested, read this post I just made in the Mid-Atlantic forum, where they were also talking about it:
-
3
-
1
-
-
18 minutes ago, Maestrobjwa said:
So...when was the last time the PDO was positive?
For winter:
-2014-5 and 2015-6 were solid +PDOs.
-2016-7 and 2017-8 averaged pretty much neutral
-2018-9 was only modestly -PDO
-Strong to very strong -PDO since
https://www.ncei.noaa.gov/pub/data/cmb/ersst/v5/index/ersst.v5.pdo.dat
-
1
-
2
-

Historic Tennessee Valley Cold, Snow, and Ice Events
in Tennessee Valley
Posted
On this date in 1892 - A winter storm in southwestern and central Tennessee produced 26 inches of snow at Riddleton, and 18.5 inches at Memphis. It was the deepest snow of record for those areas. (David Ludlum)
Also on this date in 1892, Nashville got blasted with 17.0” of snow (17" on 3/17)! This was and still is the heaviest calendar day of snowfall on record there by a good margin. And it fell after 4.3” fell the prior two days! Chattanooga got 0.9” on 3/17 and 0.3” on 3/18. Knoxville got 3” though it was recorded on 3/18. Atlanta got 0.3” 3/17-18.