

GaWx
-
Posts
16,086 -
Joined
Content Type
Profiles
Blogs
Forums
American Weather
Media Demo
Store
Gallery
Posts posted by GaWx
-
-
There has been a significant weakening of the SPV on the Euro Weeklies for mid-Feb onward since the run of 3 days ago, especially for mid-Feb:
Here was the Jan 26 run: very strong SPV mid-Feb with 10 mb winds +31 with only one (1%) wind reversal then:

Today’s run’s mean has literally almost cut the Feb 19th wind in half to a BN +16 in just 3 runs and has ~12% with a reversal. Watch this period for possible future increases in probabilities. The CDN and FNMOC ensemble mean winds have also dropped somewhat for mid-Feb. Potential implications of a mid Feb reversal would be for early March in the E US:

-
 1
1
-
 2
2
-
-
4 hours ago, Carvers Gap said:
Just reading across other subforums, I see a lot of disappointment that winter has taken a hiatus for the first half of February. LR ext modeling has been barely budged in suggesting the cold comes back around the 14th - give or take 48 hours. Ensembles have been locked-in for weeks. The MJO has certainly led the way on this. The great thing is that modeling has been very accurate with this warm-up. That makes me think they are probably correct about having roughly a 3 week stretch of cold to close out winter. I hear the "we are giving away half of February" talk. For the past three years, we have pretty much lost all of Feb due to Nina climatology and the trough being stuck in the West. The next good thing is that global ensembles have the transition to cold. Sure, there could be some can kicking, but....the cold being depicted to return the 14-15th time frame is not can kicking. Extended LR modeling has barely budged with that timeframe. It is possible it may have shown the 10th at some point, but the 500 pattern has been consistent for some time. It is actually remarkable work by LR ext modeling if it pans out. I suspect the coldest pattern will be Feb20-29th....maybe we can score a leap year storm. I get that climatology starts to fight us, with the exception of one area....big late winter and/or early spring snow storms.
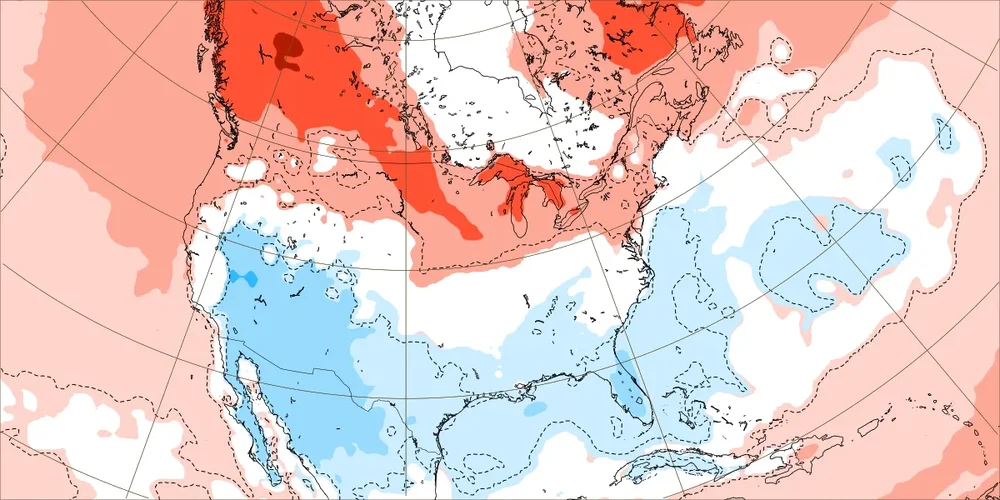
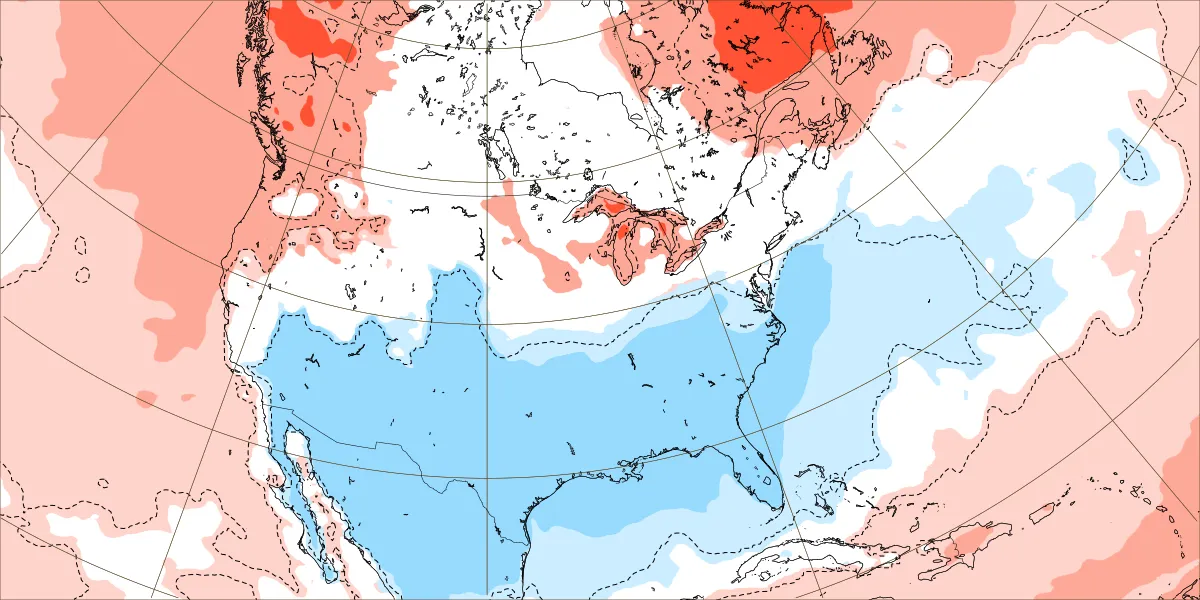
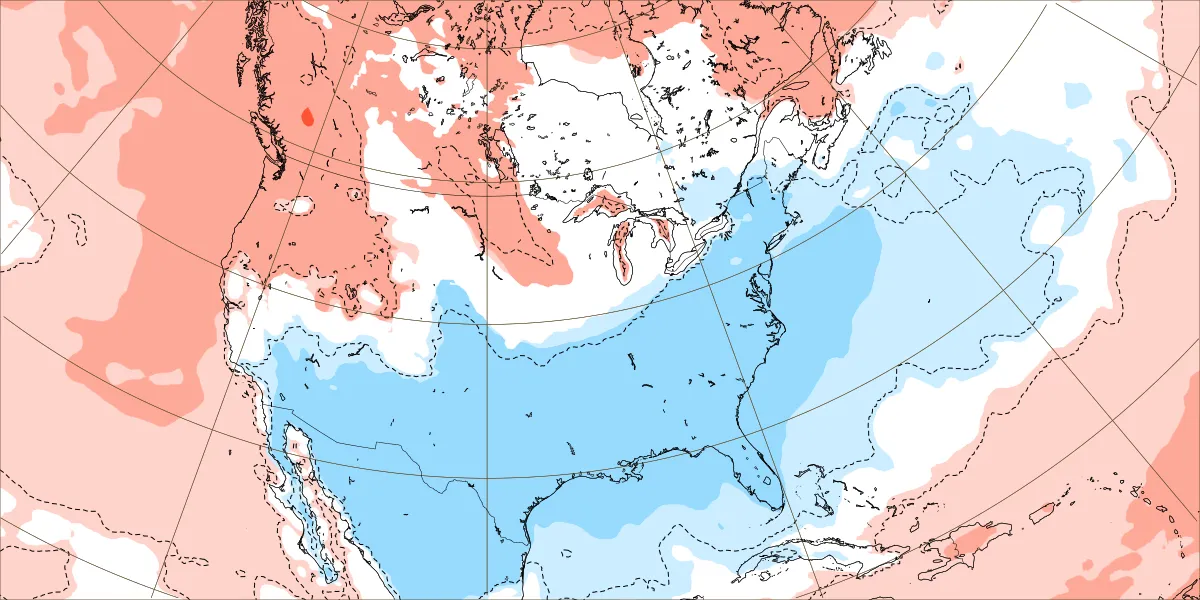
The Euro Weeklies are weaker with the SE cold for Feb 12-19 averaged out vs the run 3 days ago, which is due to a little can kicking/short delay in the start of the BN. One can see that delay by comparing the EPS daily maps for Feb 11-12 over the last couple of days.
Fri’s Jan 26 run: pretty solid signal for BN SE Feb 12-19
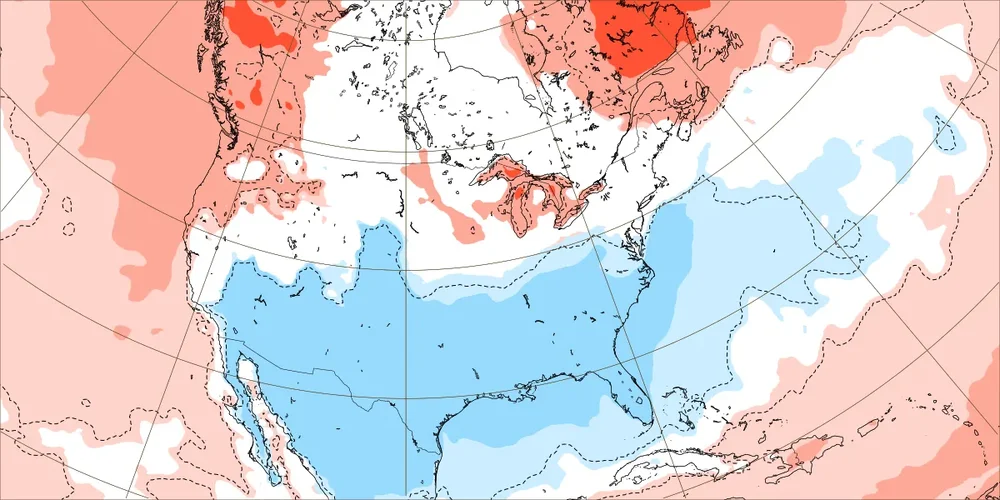
Today’s (Jan 29) run: weaker BN signal in SE for Feb 12-19 due to delay
Otherwise, the Euro Weeklies are about the same (Feb 19th+) calling for a pretty solid BN signal for 3 weeks into early March. The best opportunity for a Miller A GOM based SE winter storm in the Weeklies still appears to be during the subsequent week, Feb 19-26, though that leans more toward NC/SC/GA (more qpf).
-
4
-
-
Trend of 12Z models overall continues with the idea of a much weaker cold press from the NE/lowered wintry threat for most of the SE without that strong cold air that was on yesterday’s models and today’s 0Z ICON. There’s still time for a reversal or the possibility of some wintry from the cold air upstairs associated with the upper low, but my overall interest from a wintry aspect has dropped significantly from where it was yesterday. It was too warm for wintry when it first showed up and has now gone back in that direction quite a bit though not entirely as of yet.
-
2
-
-
3 minutes ago, wncsnow said:
ICONic
.thumb.png.09c736734bec7485cf214ad6f9c62691.png)
Far different from 0Z ICON. Cold press to the NE significantly weaker vs 0Z and further N track of storm.
-
6 minutes ago, wncsnow said:
Are the weeklies still showing a good pattern or have they moderated too?
The Weeklies clearly moderated over the weekend vs those with a stronger cold signal late last week. Also, there are some signs of can kicking of the start of the good pattern.
-
 1
1
-
-
2 hours ago, GaWx said:
OTOH I just saw that the 0Z ICON was much colder than its 12Z run along with some snow and similar to the cold 18Z and prior GFS runs. (For whatever reason, the extended portion didn’t come out until much later.) This is very much a fwiw and I‘m not buying it considering the trend of the 0Z Euro and 0Z/6Z GFS suites, which will need to reverse course to revive any significant non-mountain SE wintry prospects from this storm.
Here's the 0Z ICON clown, which I'd obviously love to verify with its 3" of snow imby (would be biggest snow since Dec of 1989) but am not at all buying now considering how much warmer are the GFS/Euro suites, the general inferiority of this model vs those, how much colder this run is vs yesterday's 12Z ICON, it still being out a week, and the extreme rarity of snows like this here:

-
1
-
-
2 minutes ago, wncsnow said:
The trough is too far northeast. The lack of cold air is alarming much like December again. It's going to take time to cool North America back down. We were punting until Mid Feb anyways right?
The 6Z EPS continues the 0Z Euro suite trend toward a further NE trough/less cold air available for this storm.
-
1
-
-
OTOH I just saw that the 0Z ICON was much colder than its 12Z run along with some snow and similar to the cold 18Z and prior GFS runs. (For whatever reason, the extended portion didn’t come out until much later.) This is very much a fwiw and I‘m not buying it considering the trend of the 0Z Euro and 0Z/6Z GFS suites, which will need to reverse course to revive any significant non-mountain SE wintry prospects from this storm.
-
1
-
-
7 hours ago, GaWx said:
The further north track and warming from recent GEFS runs to the 0Z GEFS is similar to the 0Z op GFS. The source of cold to the north in advance is much warmer than in recent runs.
The idea of there being much less cold air to the north in advance of any storm on the 0Z GFS suite was also on the 0Z Euro suite vs its 12Z run as well as on the 6Z GFS suite. Not a good trend on these last two GFS suites or the 0Z Euro suite for SE wintry prospects as they’re too warm. They’re going to need to reverse course or else that would be all she wrote for SE wintry prospects from this system.
-
2
-
1
-
-
45 minutes ago, JoshM said:
0z GFS came north a lot, but it's too warm. 540s up in Pennsylvania.

The further north track and warming from recent GEFS runs to the 0Z GEFS is similar to the 0Z op GFS. The source of cold to the north in advance is much warmer than in recent runs.
-
Feb is setting up to be quite an interesting month this year in the SE as it often is during El Niño. Some and possibly many will ultimately be disappointed but hopefully many will instead be pleased. Regardless, the forecasting discussion threads should be quite interesting and busy as we speculate on possibilities!
-
3
-
-
On 1/23/2024 at 10:33 AM, GaWx said:
After topping in Nov (fairly typical timing of a top), the OHC is already 0.9 lower than where it was then and is at its lowest since way back in early March of 2023 with it only near +0.6:

Now look how low the OHC is: ~+0.25

-
2
-
-
14 hours ago, BooneWX said:
Murphy to Manteo to Hogtown to Atlanta and in between. That’s what this board needs. Don’t even care if Charleston to Hogtown to Valdosta gets by far the most.
Fixed your post.
-
 2
2
-
-
11 hours ago, LibertyBell said:
This is wild Larry-- what was 1998's and 2016's?
-23, -22
-
1
-
-
Take it with a grain/don’t trust it, but fwiw the new Euro Weeklies run is easily the coldest overall yet for mid Feb through early Mar. Once the BN temperatures set in Feb 12-19, they remain through the end of the run (Mar 4-11). The week of Feb 19-26 is by far the coldest for that week of any run yet and may, when also considering El Niño climo, have the most winter storm potential in the SE of any single week per this run with Miller A/GOM potential written all over it (combo of Aleutian Low/+PNA, -NAO, -AO, and moist subtropical flow/split flow):


-
4
-
3
-
-
5 minutes ago, so_whats_happening said:
We may set the record here unless we have some large negative values coming up, maybe the last day of the month can offer a large negative spike?
Indeed, we may. I had thought these last 3 days were going to be more negative than they ended up being. It may be close.
-
1 hour ago, WestMichigan said:
Does 1.99 or 2.00 really matter other than for classification purposes? I don't think the atmosphere is going to say oh, it is only 1.99 so I need to behave differently.
Not in the least bit. This is purely for fun, bragging rights, and contest purposes. It will be in the record. Don’t forget that we have a contest in another thread.
Edit: In light of the next post, I want to restate that this would make a difference between strong and super on an UNROUNDED basis, which I go by since we have the unrounded available. I call +1.50 to +1.99 strong and +2.00+ super-strong. For those going by rounded (i.e., what shows in the well-known table), it will be quite difficult for it not to end up at +2.0 unless the ERSST/OISST relationship were to be far different in Jan vs the Aug-Dec average.
-
2
-
-
The 12Z GEFS starts to establish a strong Aleutian Low toward the end of the run (Feb 10-11), which would be right on schedule with regard to the longer term long modeled more favorable pattern getting established for mid to late month. I’m not trusting it but I’d rather see it than not. So far, no can kicking…fingers crossed.
-
3
-
-
The 12Z GEFS run suggests a good chance for no more widespread multiple day warmth for quite awhile in the bulk of the SE (including NC/VA lol) after this weekend. We’ll see though as ensemble means smooth out extremes due to timing differences. It wouldn’t surprise me if there are still a couple of warm ones sneaking in during Feb 1-10 before the hoped change to more sustained BN soon after.
-
1
-
1
-
-
-Jan 1-25 has averaged +1.86 on the cyclonicwx.com’s OISST.
-The Nov and Dec ERSST combined averaged +2.045. That means that Jan ERSST needs to average +1.90+ to end up with a +2.00+ NDJ ONI (super Nino).
-ERSST averaged 0.08 warmer than OISST Aug-Dec.
-If I assume that ERSST/OISST relationship were to hold in Jan, that would mean that the Jan OISST would only need to average +1.82+ to end up with a +2.00+ NDJ ONI. Compare that to the +1.86 for Jan 1-25.
-What is needed during Jan 26-31 to bring the full Jan OISST down to +1.81 or lower? That would require Jan 26-31 OISST to be cooler than ~+1.65, perhaps near +1.62.
-The last week has averaged only ~+1.625 with yesterday’s +1.59 being the coolest in months.
-If Jan 26-31 were to rise back to an average of +1.65, a pretty difficult task as of now, the Jan OISST would end up at +1.82. Under the assumption of the Jan ERSST being 0.08 warmer than OISST, that would mean a NDJ ONI right at +2.00 (super). But if Jan 26-31 OISST were to instead average only +1.60 (near where it is now), Jan OISST would end up at +1.81 and NDJ ONI would end up at +1.99 (a hair cooler than super).
-So, it is literally down to the wire. These next 6 days could be crucial! Of course, if the ERSST/OISST relationship for Jan were to change much from the 0.08 difference of the prior 5 months, that could change things, too.
-
4
-
-
6 minutes ago, Tullioz said:
DT isn't always consistant, so I'm not surprised that he has conflicting definitions of what he considers to be the Mid-Atlantic. In the Facebook post I linked to he defines it this way: "So to answer the question directly when we say that term MIDDLE ATLANTIC REGION wxrsk is referring to the northern third of North Carolina ...all of Virginia - except maybe the Southeast corner-- the eastern half OF West Virginia... All of Maryland & Delaware ...all of New Jersey and most of Pennsylvania ... the southern third of New York State... NYC & Long Island."
Indeed, at this link, DT’s quite different:
https://wxrisk.com/operational-weather-forecasts/
The Middle Atlantic Operational Forecast includes coverage for the next two weeks. It is an all-purpose forecast that covers:
- West Virginia
- North Carolina
- Virginia
- Maryland
- Delaware
-
3
-
7 minutes ago, Tullioz said:
This is correct. DT considers the northern 1/3 of NC as being in the Mid-Atlantic.
https://www.facebook.com/WxRisk/posts/983420895038502The WPC includes all of NC.
DT actually includes all of NC as Mid-Atlantic. For example, Charlotte is included. Also, I didn’t know that WPC includes NC in it. What a difference in what they consider SE vs what the SE includes here.
-
2
-
-
42 minutes ago, WinstonSalemArlington said:
I know how this forum breaks down geography. But DT didn’t post this on this forum. Although it’s hotly debated, many consider NC part of the Mid-Atlantic. It’s even been debated here for years, but that’s not an invitation to revisit that debate.
I just went to DT’s site and sure enough I see he has NC in what he calls the Mid Atlantic region. So, NC can now relax since he’s including it for wintry potential lol.
He has DE as the most N state in the M.A. and excludes NJ, PA, and NY, which are normally included. I’ll just say that his definition of M.A. is highly unusual in that it is centered much further S than in any other case I’ve seen it used.-
2
-
-
28 minutes ago, WinstonSalemArlington said:
Why? DT and many other people include North Carolina into the definition of “southern Mid-Atlantic.”
But our SE subforum of AmericanWx has not only NC but also VA. So, even VA is included in many other cases as SE, not mid Atlantic. Some do count VA as being in the southern Mid Atlantic. If DT’s considering NC as S Mid Atlantic, he’s off imo.
The link below has VA in pink, which it is calling S Mid Atlantic:
https://en.m.wikipedia.org/wiki/Mid-Atlantic_(United_States)
-
1
-

.png.050f3c095dcf02e5fc7afecbb190c3d4.png)


February 2024 mid/ long range
in Tennessee Valley
Posted
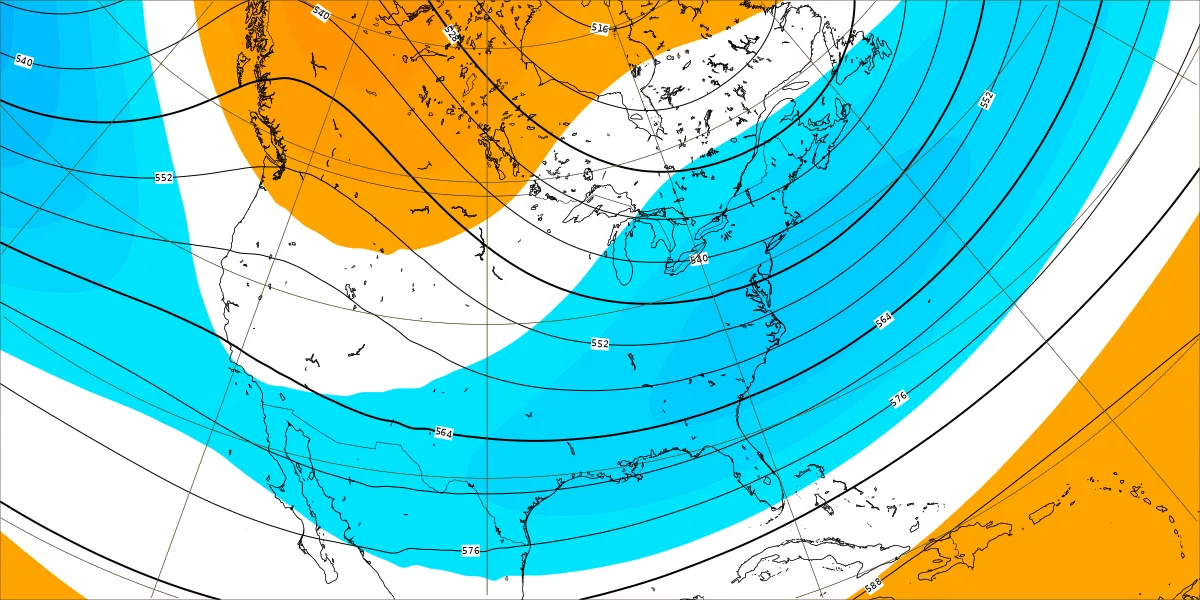
At H5, the Euro Weeklies mean for Feb 12-19 actually looks surprisingly similar over the US for the two runs with a nice setup. So, it does appear to be just a short delay. However, the -NAO and -AO are slightly weaker. Perhaps that’s helping to reduce the degree of cold.