

GaWx
-
Posts
11,398 -
Joined
Content Type
Profiles
Blogs
Forums
American Weather
Media Demo
Store
Gallery
Posts posted by GaWx
-
-
15 minutes ago, Itryatgolf70 said:
Larry, I have a question. Did the eps do good with the ao forecast? Typically, it usually has a good handle on teleconnections from what I've noticed.
0Z AO forecasts for 2/13-20
2/6: GEFS -3.5; EPS: -3.2
2/7: GEFS -3.0; EPS: -2.8
2/8: GEFS -3.2; EPS: -2.5
2/9: GEFS -2.7; EPS: -2.5
2/10: GEFS -2.2; EPS: -2.1
2/12: GEFS -1.2; EPS: -1.1
Actual for 2/13-20: -0.6Although both did horribly, the EPS was slightly less horrible. I’d go F for GEFS (avg miss -2.0) and F+ for EPS (avg miss -1.8)
-
3 hours ago, WxUSAF said:
I’d bet my retirement that 95-96 will be one of his top analogs
Yep, 95-96 would be an obvious bet for him if the PDO were to switch to positive just like that La Niña winter’s PDO switch. And then if he were to give up on the PDO switching, he could still fall back on 2010-1 with its strong -PDO Niña. Got to keep business going strong!
-
 2
2
-
-
55 minutes ago, PowellVolz said:
Seems like a PDO flip would be good for us?
.It would be good for the E US overall, but I’ve seen no evidence whatsoever that the PDO will flip. That’s especially the case with La Niña likely coming. As speculated at another subforum, Bastardi is probably trying to drum up business because he already said a -PDO/La Niña next winter would probably mean a warm one. So, now he seems to be backtracking a bit with this very highly speculative +PDO talk. This isn’t surprising because warm E US winter forecasts don’t work well for business.
-
2
-
-
13 minutes ago, Ji said:
He is trying to back track on his warm winter comments for the east coast. Disaster for businessAbsolutely. He’s done this in the past in giving early hints about a warm winter forecast only to backtrack by trying to find a reason to go colder or at least sow doubt about warmth. When was the last time he went warm throughout the E 1/3 of the US and stuck with it? I can’t even recall anything resembling that. His cold bias for the E US is awful.
-
2
-
-
18 hours ago, Stormchaserchuck1 said:
Yeah, PDO's usually go in the direction of ENSO state like 85% of the time.
Another thing too is, this La Nina is already heavily supporting -PNA.. Since the subsurface cooled, and the SOI flipped, this new High pressure pattern took over in the N. Pacific. so if that trend continues through the Spring and Summer, which I think it will, the PDO should drop further.
I was curious about Bastardi saying something about the PDO possibly flipping for next winter. So, I just looked at the SSTa progs from the CFS, CANSIPS, and NMME for as far as the models go out (Nov to Jan). Anyone can do this easily and quickly. Whereas they all clearly show La Niña forming, none show anything even remotely suggesting a change to +PDO. If anything, they show a restrengthening of the -PDO with the very warm waters from Japan eastward through most of the Pacific persisting and the waters off our W coast cooling some.
-
1
-
-
1 hour ago, Carvers Gap said:
Just reading D'Aleo over at WxBell who I respect a lot....he has a graph of one area of the Pac where the El Nino just collapsed during mid January (100-180?). I have not looked to see where that is, but I do wonder if the collapse of the El Nino has had a significant effect on the second half of winter. We kind of got the worst of both worlds - first half Nino(typically warm) and second half Nada(typically warm!). We managed about ten days of weak El Nino...and many scored.
Also, JB think the PDO is set to flip positive next winter. I see no evidence of that but haven't looked at recent metrics for it. Anyone have a forecast for it?
I was curious and for that reason at TT I just looked at the SSTa progs for the CFS, CANSIPS, and NMME for as far as the models go out (Nov to Jan). Anyone can do this easily and quickly. Whereas they all clearly show La Niña forming, none show anything even remotely suggesting a change to +PDO. If anything, they show a restrengthening of the -PDO with the very warm waters from Japan eastward through most of the Pacific persisting and the waters off our W coast cooling some.

-
1
-
-
We finally reached the coldest normal mean of any day in the Arctic, Feb 25th. Compare that to mid to late Jan for a good portion of the US, including the SE. For about the next two weeks, the daily normals only very slow warm and are still only near Jan normals. Only afterward (after Mar 10) the warming of normals accelerates. There have been many winters when the coldest Arctic day was in Mar, especially recently.
-
3
-
-
We finally reached the coldest normal mean of any day in the Arctic, Feb 25th. Compare that to mid Jan for much of the SE. For about the next two weeks, the daily mean normals only very slow warm and are still only near Jan normals. Only afterward (after Mar 10) the warming of normals accelerates. There have been many winters when the coldest Arctic day was in Mar, especially recently.

-
3
-
-
Since long term models are so accurate
") , I looked at them closely:
, I looked at them closely:
-Euro Weeklies warmest yet through 3/24
-Recent CFS ensemble runs about coldest yet for 3/10-17 along with AN precip.
-So, for 3/10-17, the Euro Weeklies have gone from cold a few days ago to NN now. That compares to recent CFS ens being BN to MBN.
-So, huge disagreement mid March. Whereas I’d love for the CFS to be right, I’m for now going for the Euro to be closer based on how this winter has gone. But I’m going to watch the forecasted strongest major SSW of the season that’s predicted ~Mar 3 along with the PNA/NAO/AO possibly going +/-/- by 3/10 to hopefully cause the Weeklies to bust too warm in mid March.
-Whereas Mar 3-9 is a high confidence period to average mild in the SE, Mar 10-17 is an extra low confidence period for whatever. And don’t forget that Mar 1 could have a bit of a wintry surprise for some of the CAD areas.
-
3
-
 1
1
-
-
4 hours ago, PackGrad05 said:
6Z GFS likes March 8 for some snow!

A full week before this, the 6Z and now the 12Z GFS is continuing for the 4th run in a row of at least the low threat for a wintry mix in a portion of the main CAD areas on Friday, Mar 1. Also, the 12Z ICON has cooled off and now has more of a wet wedge than prior runs with it as cold as upper 30s with rain in N GA on Fri.
In addition, the 12Z CMC now has a cold rain on Fri (low 40s N GA) after previously having no precip and low 50s there.
This is getting a bit more interesting with each run as it is getting more model support as we get closer (within 5 days). Could Mar 1 end up with the first wintry precip of the winter in especially some of the main CAD areas? That potential is looking to me to be somewhat less unlikely than when I first posted about it last evening.
Edit: The vast majority of 12Z GEFS members (by far the most yet) have at least a little wintry mix in a portion of the CAD areas on Mar 1 fwiw.
Edit #2: 12Z Euro still has for Mar 1 in the CAD areas the coldest with rain being upper 30s for the most part.
-
4
-
-
The newest GFS (0Z) is similar to the 18Z. The 0Z GEFS has 11 of 30 with some ZR or IP in a portion of the main CAD areas on March 1 compared with 8 on the 18Z, 2 on the 12Z, and 4 on the 6Z.
The 0Z Euro again says mainly nada with coldest upper 30s with the rain for the most part, similar to 12Z. Also, 0Z ICON/UKMET/CMC have no wintry.
So, the GFS remains on its own. If you bet on it, you’re taking a big risk. And even so, it is only marginal in a portion of the main CAD areas. But it for outside the mtns is the only wintry game in town even if only barely. So, I think it is worthy of mention.
-
2
-
-
A pretty strong CAD for the main CAD areas has been shown on some runs of the GFS, including the strongest version yet on the 18Z resulting in a very cold rain with only low to middle 30s during the day Fri 3/1. A few spots even have ZR or IP. The earlier 0Z GFS was similar though not quite as cold. However, the Euro and CMC as well as the 12Z and 6Z GFS don’t have anything like that for Fri. So, the 18Z GFS is very likely too cold with it being such an outlier and thus the worst scenario would probably be just a 40s cold rain.
-
1
-
-
13 minutes ago, Maestrobjwa said:
Haven't we had a high ACE season or two the last 8 years or so?
2017, 20
I showed stats for NYC and especially Boston that suggest a modest correlation likely really does exist in the NE. Keep in mind that any correlation is likely not strong thus meaning a good number of exceptions and also that it is more for the NE US, especially Boston area, and not so much if any for the Mid Atlantic.
-
45 minutes ago, LibertyBell said:
wow did that hit Savannah directly?
More or less. The lowlands from the upper GA coast to CHS (not downtown and nearby in SAV as it fortunately is 20-40 feet up on a bluff) were devastated by storm surge, especially many poor African Americans living on islands. It was the most destructive US natural disaster at the time. Very sad.

“Unfortunately, not all communities received the warnings. Home to more than 30,000 African Americans who farmed, worked in rice fields, and plied nearby waters for fish, oysters, shrimp, and crabs, the Sea Islands were accessible only by boat. Their remote location allowed for the preservation of the unique Gullah and Geecheeculture, but limited communication with the mainland—a fact that would carry dire consequences for residents unprepared for the coming storm.”
https://www.georgiaencyclopedia.org/articles/history-archaeology/1893-sea-islands-hurricane/
-
 1
1
-
-
18 minutes ago, LibertyBell said:
1893 exciting season a hurricane hit NYC directly!
The 1893 Sea Islands hurricane drowned ~2,000 in GA/SC and left ~30K homeless.
-
1
-
-
1 hour ago, LibertyBell said:
wow from a different era.... I'm shocked it's not 2005 with all those cat 5 storms and wilma, the strongest storm in recorded history in the atlantic.
Others in the top 13 from another era, when tropical activity was probably undercounted:
#3: 1893, a devastating season for the US
#4: 1926, a very bad season for FL/Gulf/Bermuda
#8: 1950 FL hard hit
#9: 1961
#11: 1887
#12: 1878
Hoping if there is another very active ACE that they mainly stay offshore and not like 1893, 1926, 1950, 2004, 2005, 2017, 2020, etc.
-
2
-
-
1 hour ago, LibertyBell said:
I'm surprised 2020 isn't in this list
2020 only barely missed the top 10 at #13 just behind 1887 and 1878.
-
1
-
-
Today’s Euro Weeklies are warmer for 3/11-18 and not as cold 3/18-25 vs yesterday’s run.

-
Today’s Euro Weeklies are warmer for 3/11-18 and not as cold 3/18-25 vs yesterday’s run.
-
2
-
-
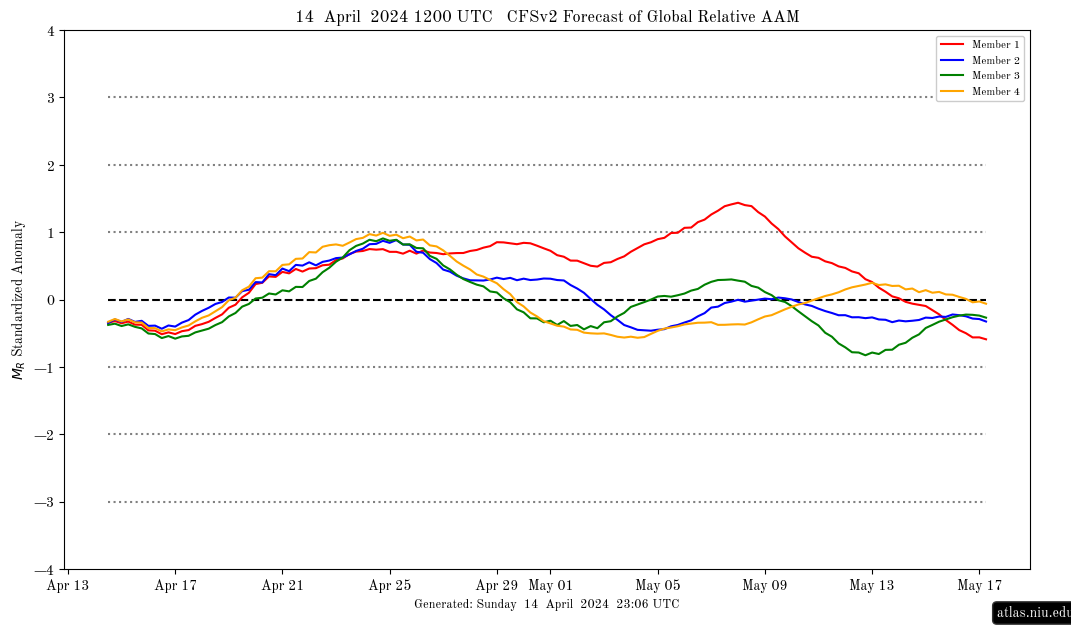
58 minutes ago, 40/70 Benchmark said:
What is the link to that?
https://atlas.niu.edu/forecast/aam/cfsv2_aam_fcst_current.png
-
2
-
-
56 minutes ago, SnowGoose69 said:
Ensembles have tended to be too strong with any SE ridging most of the winter...the area they've missed has been the PNA ridge which has tended to verify way flatter than shown in the longer range but the tendency to want to show ridging maximized outside of SE Canada or New England has failed on numerous occasions which is why despite being above normal for the winter, places from MS across to GA and into FL have been frigid relative to what they saw in Jan/Feb 2023....I have seen ATL has had only 1 high of 70 or higher the entire winter so far which explains why on web cameras I see the pear trees hae not even bloomed yet where last year as well as 18/19 and even 22 they were basically leafed out by now.
Consistent with this, much of the SE will end up only 1-2 F AN this DJF. I consider that within the NN range. To compare, 2022-23 was 4-5 AN in the same areas or 3F warmer (270 fewer heating degree days) resulting in a very mild winter.
-
1
-
-
OHC steep drop continues with it down to -0.2, an indicator of a good chance for La Niña later this year.

-
GLAAM prediction fwiw from CFS ens: goes slightly negative for next 10 days followed by a rise to weak/moderate positive mid to late March meaning an attempt of one last El Niñoish pattern then?
-
1 hour ago, Carvers Gap said:
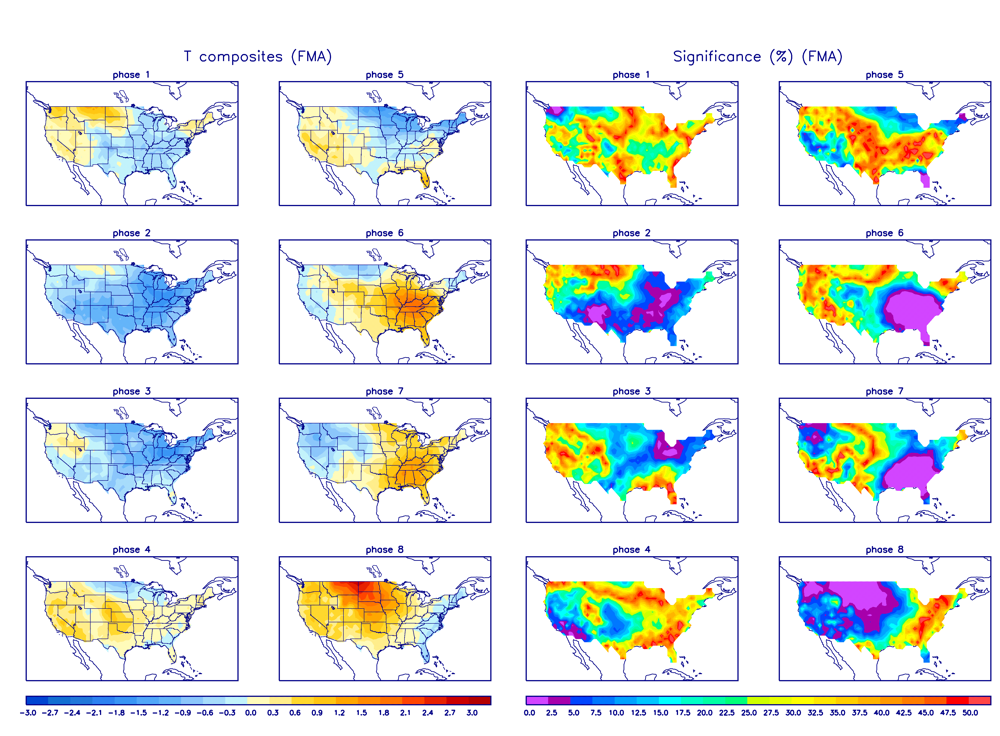
Yep. Phase 5 MJO centered on FMA is cold. If the MJO above is correct, that isn't overly warm for mid-March.
I agree that being in phase 5 in March isn’t itself a warm signal. We happened to have talked about this same thing earlier today in the SE. I had myself assumed it was similar to met winter and thus had at first assumed phases 4 and 5 had a warm signal. Then I was corrected and I agreed with the correction when I saw what’s below.
Looking closely at it, it shows both 4 and 5 averaging near normal for FMA in both the SE and TN Valley fwiw with average anomalies between -0.3C and +0.3C. I say fwiw because as we know the MJO is just one factor even though an important one. These are averages of numerous cases with some BN, some NN, and some AN. Phase 8 is also mainly near normal while 6 and 7 have averaged generally warmer than normal while 1-3 have averaged mainly colder than normal per the same source.
I saw that today’s Weeklies start off mild for most days of Mar 1-10 in much of our areas with a transition to cold dominating the 2nd half of Mar. However, I’m taking especially the 2nd half of Mar cold prediction with a huge grain due to recent too cold predictions by all of the models. The Weeklies have strong -AO/-NAO blocking along with a moderate +PNA/Aleutian troughing. The problem though is that the AO and NAO forecasts made just 2 weeks ago for now/late Feb were a huge bust:
Also, the +PNA ended much more quickly than forecasted. So, it remains to be seen to say the least whether or not these will verify though it appears that the forecast for -AO and -NAO would probably have a weak SPV to support them.
-
2
-
1
-

Late Feb/March Medium/Long Range Discussion
in Mid Atlantic
Posted
Now I see that he appears to be getting the +PDO forecast idea from the WB CFS SSTa prog for Nov. based on 10 days of runs with a 1981-2010 base: look how cold it has the IO, the area between Japan and Hawaii, the S Pacific from E of Australia out several thousand miles, the strip from off the SE US to the N Atlantic, and the SW Atlantic to just off S. America. These 5 areas are mainly BN with coldest of -2 to sub -3! Then note the warmth off W N. America with as warm as +2 off Baja. That does look like a moderate +PDO being progged on the WB map for Nov:
But compare the WB prog to TT’s CFS SSTa for Nov. (below), which is based on 3 days of runs with a 1984-2009 base: the IO’s coldest is -1.2 (vs -WB’s -2) and the other 4 areas areas are mainly warmer than normal with much of it +0.8 to +2.5 (vs WB’s mainly BN with coldest of -2 to sub -3)! In addition, the area off Baja that has its warmest of +2 on WB is only +1.0 at its warmest on the TT map and is cooler than most of the area from there to off Japan, making it a -PDO being forecasted on the TT Nov map:
How can they be so different? Any opinions? The bases aren’t that different and I don’t see for relatively stable SSTa’s how 10 days worth of runs would make much difference vs 3 days of runs. I think the main problem may be with WB’s algorithms.