

GaWx
-
Posts
11,547 -
Joined
Content Type
Profiles
Blogs
Forums
American Weather
Media Demo
Store
Gallery
Posts posted by GaWx
-
-
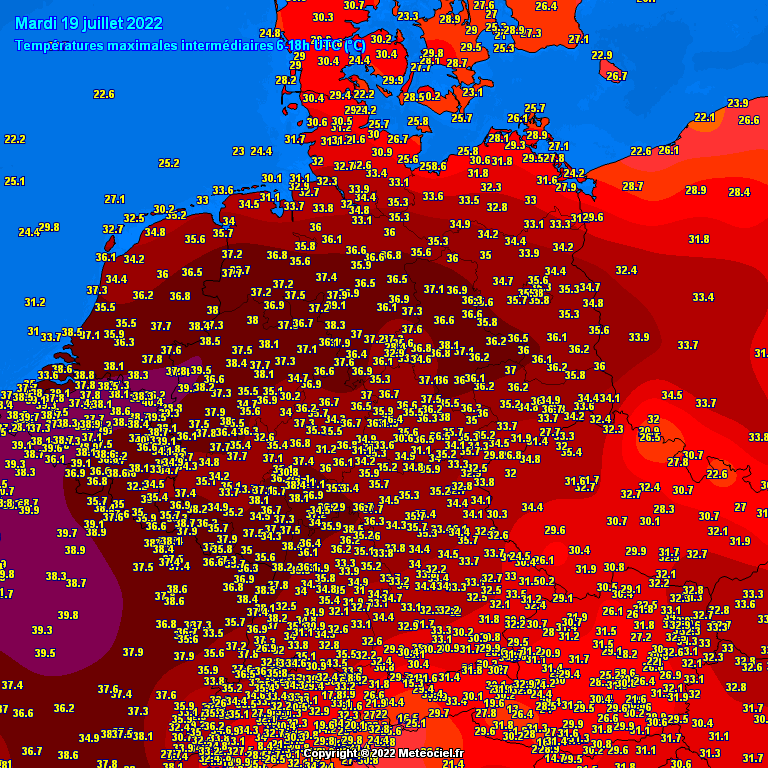
And not to forget much of France, Belgium, Luxembourg, southern Netherlands, and much of Germany: these areas on 7/19/22 had widespread highs from the upper 90s to low 100s F (37-40 C)! Although not posted, I should mention that Spain and Portugal were on fire earlier in the week as well as before that.
-
-
5 hours ago, bdgwx said:
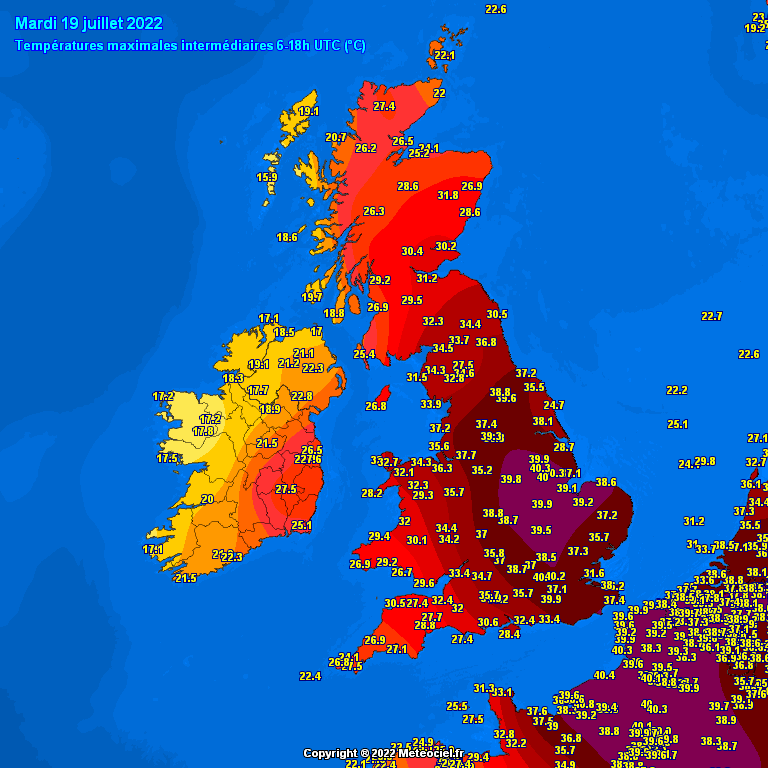
Wales shattered their all time high. The previous record was 35.2 C on Aug. 2nd, 1990. The new record is now 37.1 C in Hawarden just south of Liverpool.
12Z GFS from yesterday forecasted 37C for this area.
12Z ECMWF from yesterday forecasted 35C for this area.
Here is the 37.1 C on a map I got from the @Roger Smith high temp. link. I saw that Hawarden also had that previous record of 35.2 C in 1990. Note that Hawarden clearly sticks out as a hot spot in NE Wales as nearby stations are all 35.5 C or cooler. Some of the variation may be due to elevation differences as Hawarden is low and other differences may be due to more modification from nearby water. Regardless, the fact that the previous hottest Wales location today was 1.9 C/3.4 F hotter is all we need to know to realize the history made.

-
 2
2
-
-
After getting no measurable rainfall the last 4 days (7/14-17), I just received a decent rain from a thunderstorm over the last hour or so. Before today's rain, I was already at a way wetter than normal 10.73" MTD.
Edit: I got 1/2" today, which gets me to 11.23" MTD.
-
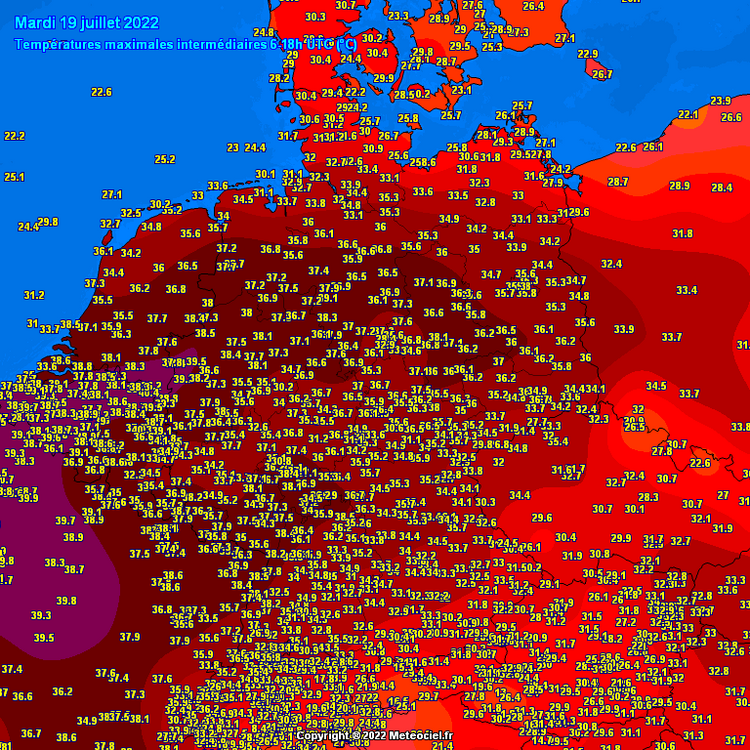
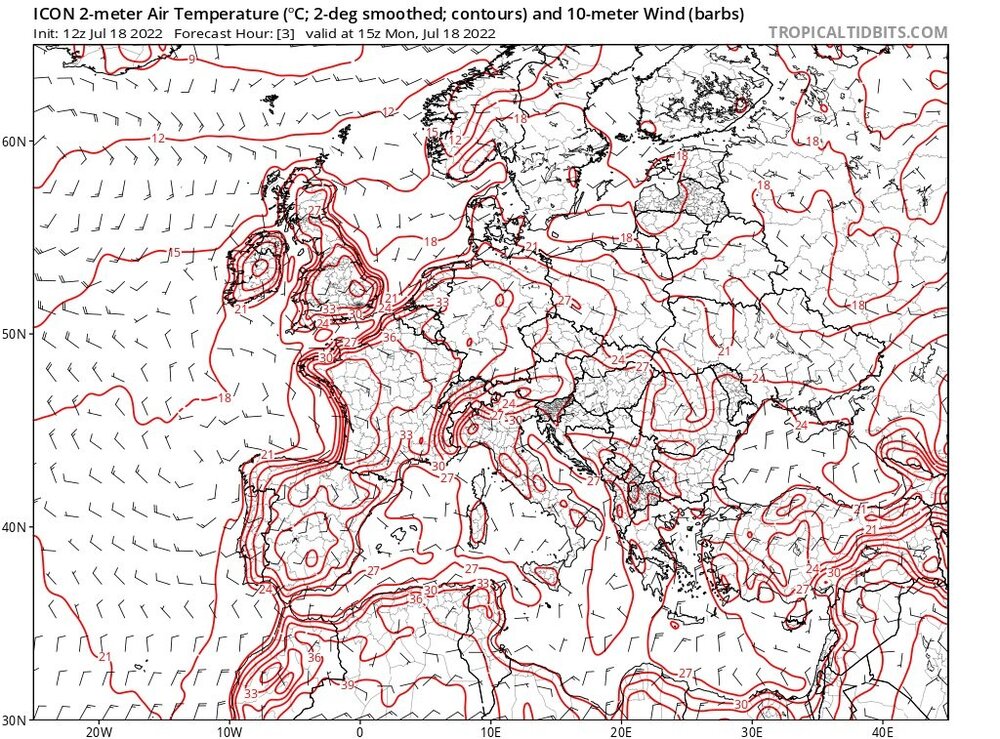
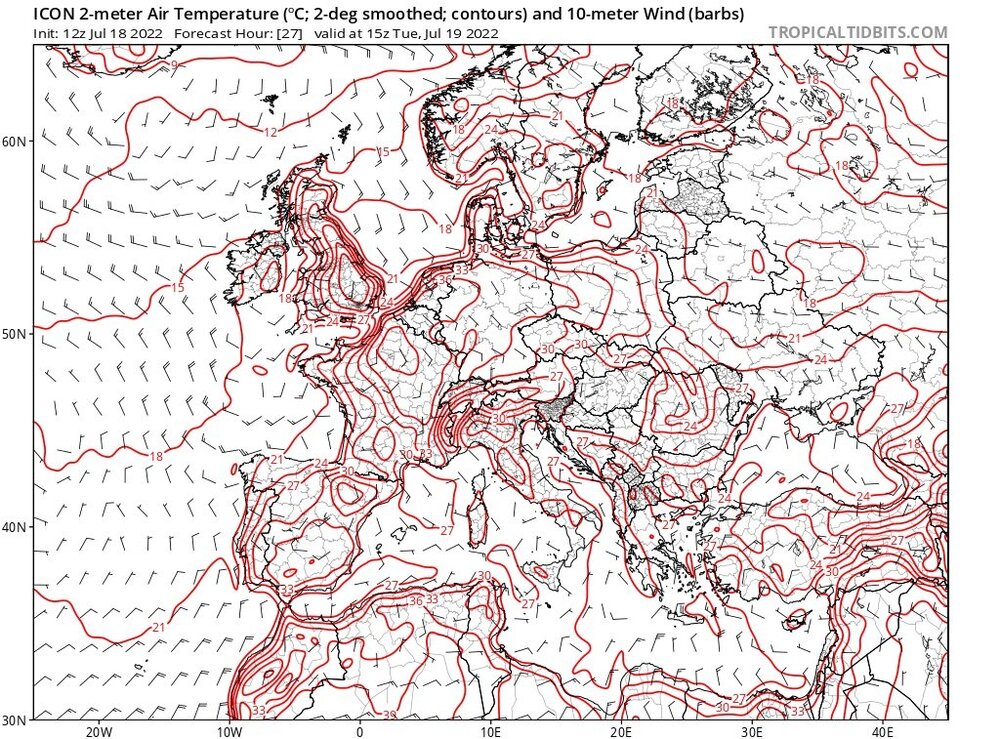
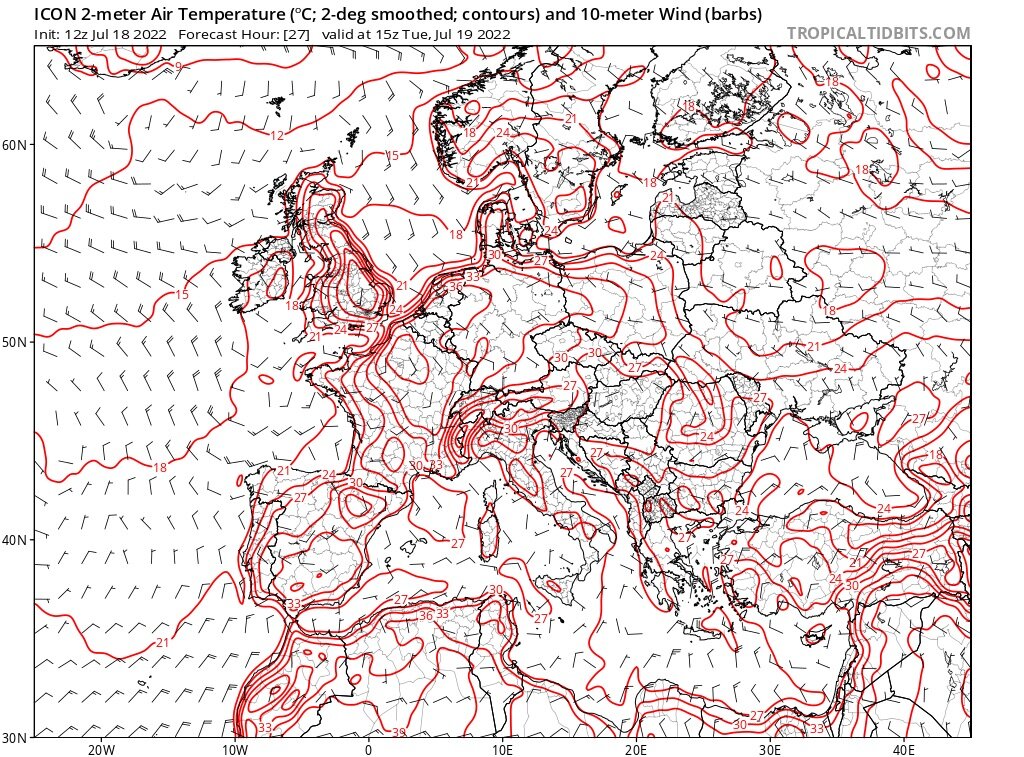
From the 12Z Icon, which I'm posting because I have three hour intervals allowing for 15Z maps, the hottest over the next two days at 2M in Wales and SW England is the 15Z map for today (7/18) (top map) while the hottest for SE England including London is the 15Z map for tomorrow (7/19)(bottom map). The 15Z map for tomorrow is actually cooler than the 12Z map for tomorrow in Wales and SW England due to cooling coming in there earlier that isn't then yet reaching SE England.
Based on temperatures that have been posted here, this model run is significantly cooler than reality. Note that the hottest contour on the top map in England (today at 15Z) is only +36 C, which is only 97 F over a small area north of London. The hottest on this top map in Wales is only +33C in far eastern Wales, which is a whopping 4C/7F cooler than the actual hottest of +37C!! Readings of over 100 F have already been noted in England. Assuming these readings are accurately reflecting reality, it appears that there's a significant cold bias at play on this 12Z Icon. With that being the case, look out for tomorrow in SE England, where this run appears to have the hottest near +38 C vs near +36 C today meaning a good 3-4 hotter than today would be implied. IF this run ends up being 4C too cool for tomorrow in SE England, the implication is that they could reach as hot as +42 C (107.6 F) in the hottest spot!!
-
1
-
-
World SST anomaly map for yesterday (7/17/22): note how warm was the western Mediterranean. Much of it is +3C+ or +5.4+ F warmer than normal. Also, the Bay of Biscay and English Channel are clearly warmer than normal. These are bodies of water that are traversed by the hot air originating in Northern Africa before reaching locations like Spain, France, and the UK. With them being so warm (likely enhanced by AGW), there's less modification by these bodies of water vs if they were closer to normal:

-
2
-
-
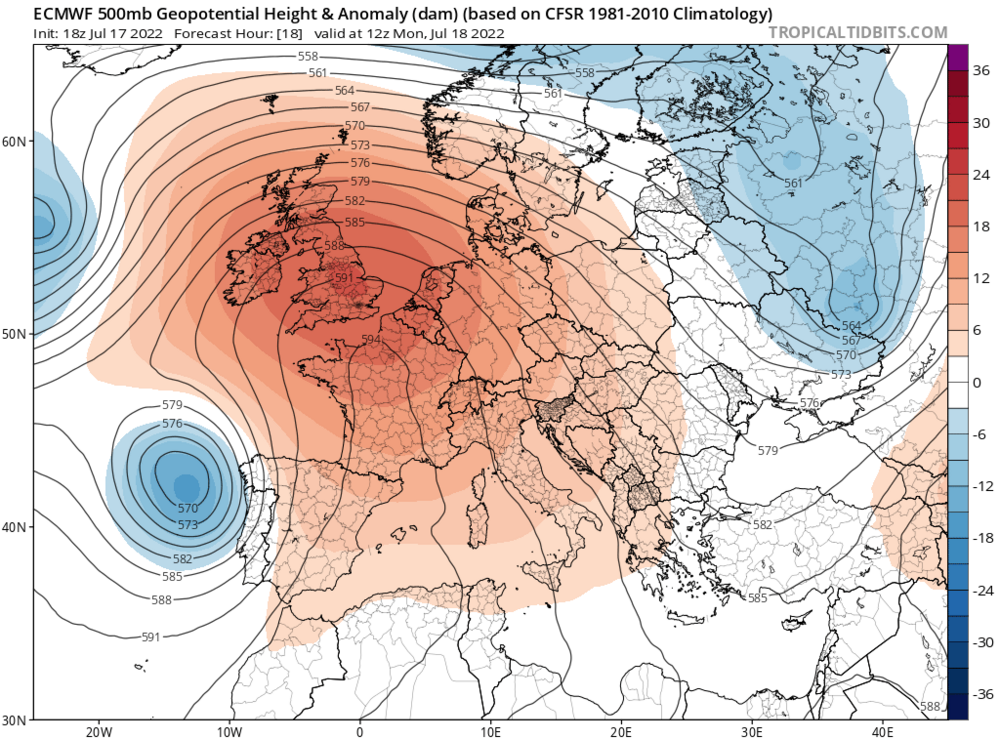
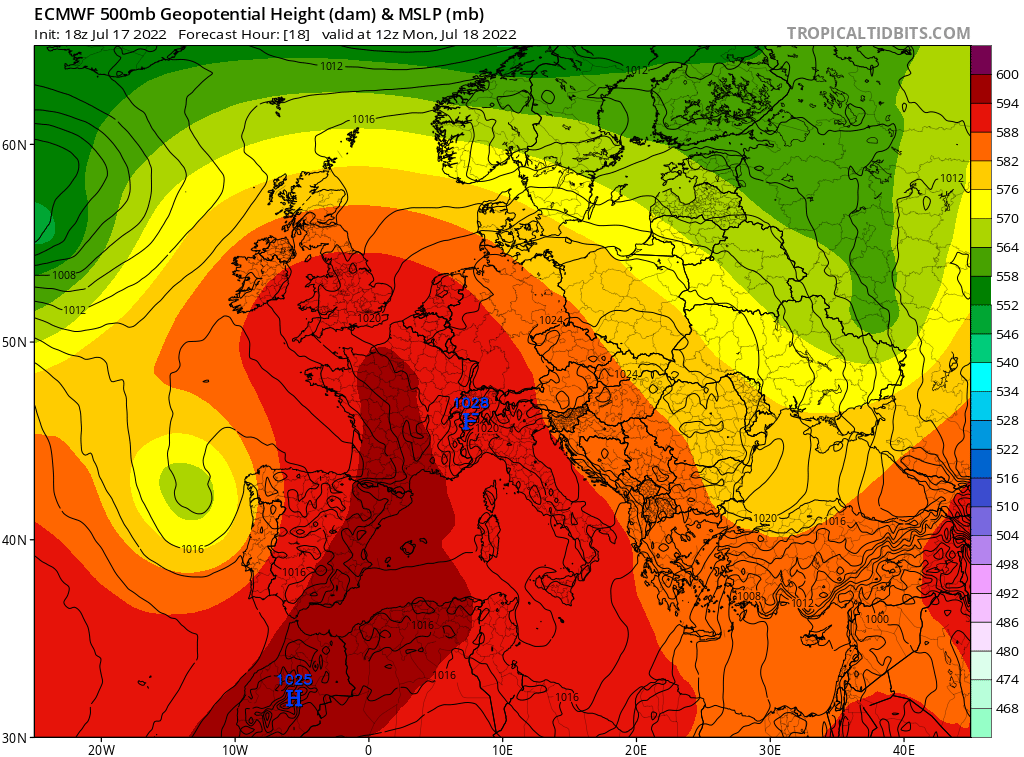
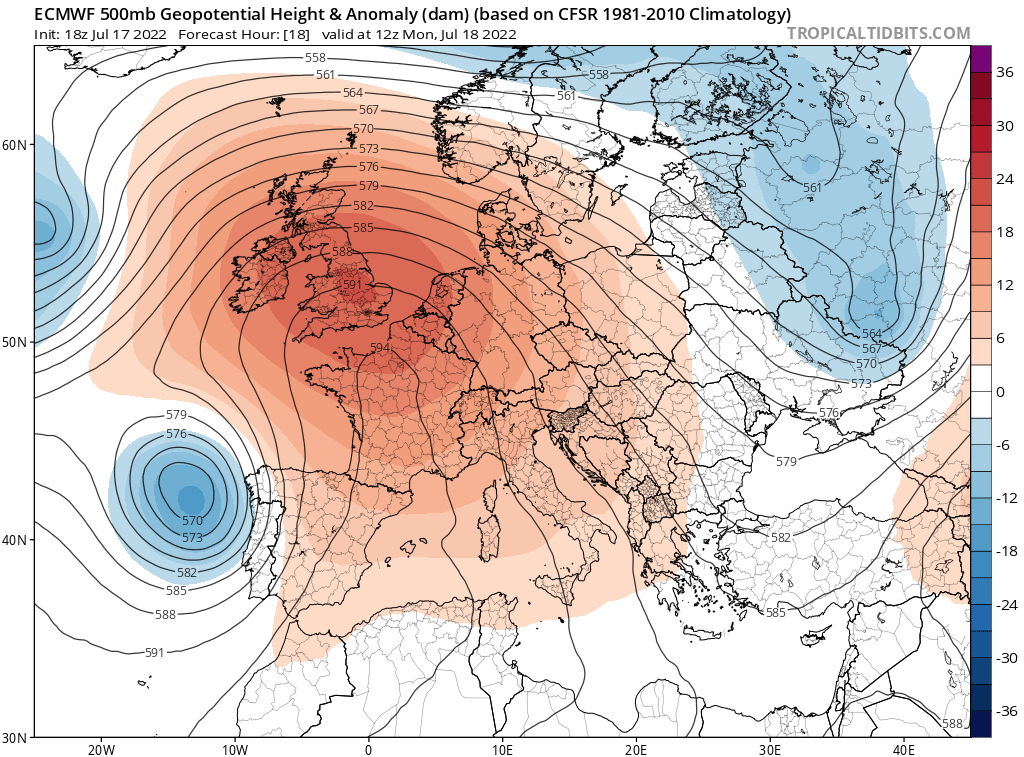
From the 18Z Euro, the peak 500 mb hts over southern England are near 592 dm at 12Z on 7/18/22:
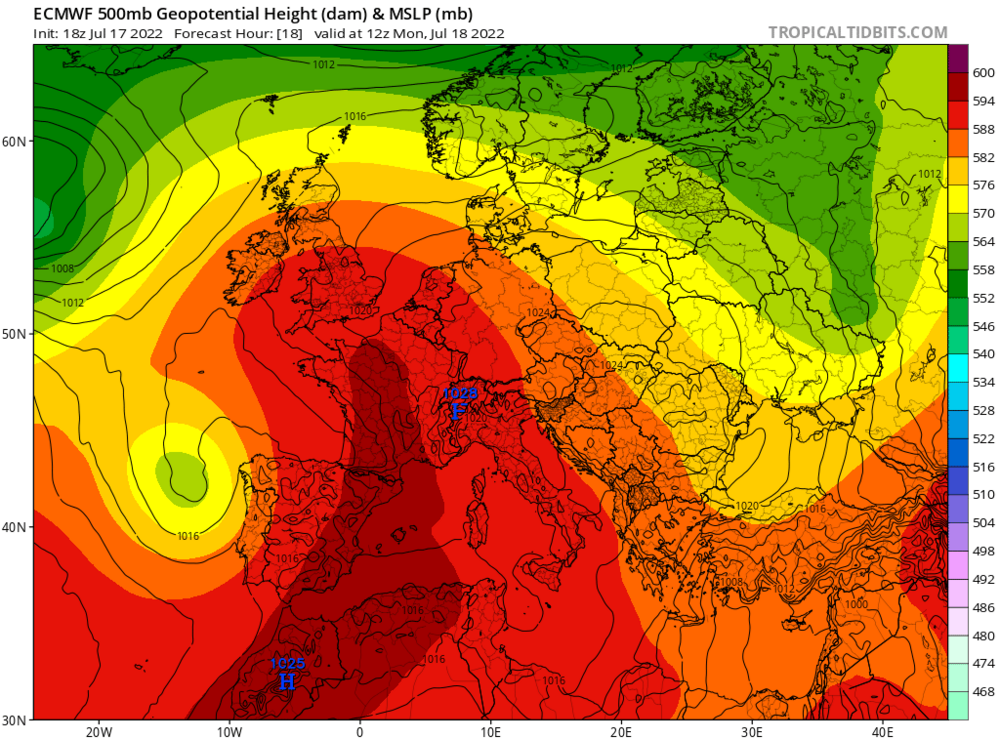
This is ~21 dm above the normal of ~571 dm:
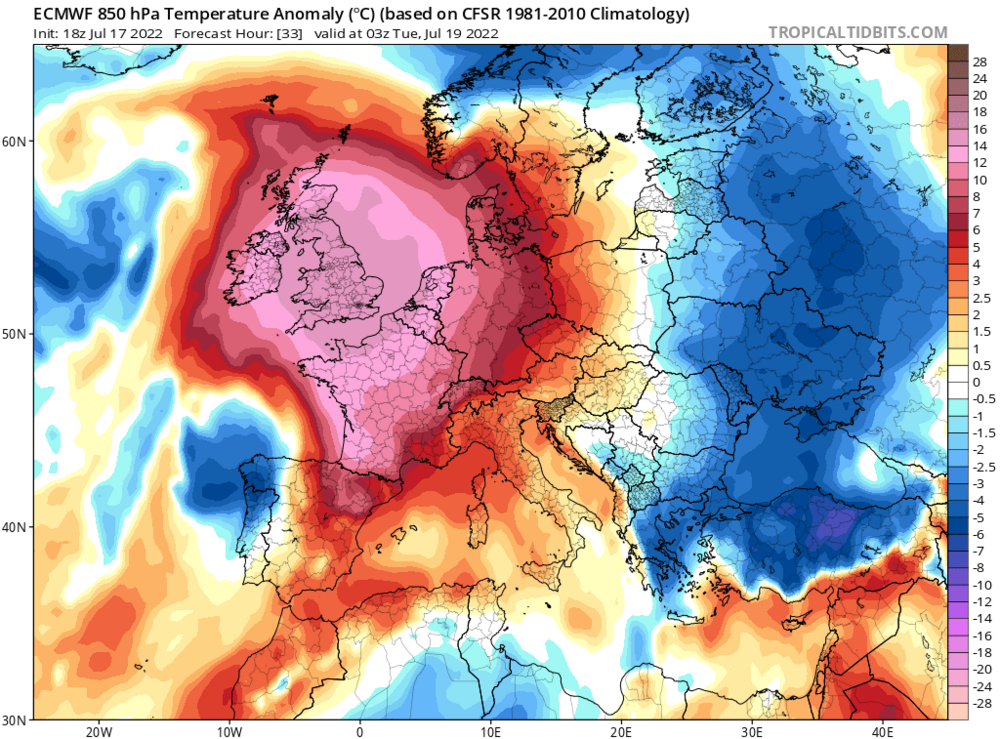
The peak 850 mb temp anomaly on the 18Z Euro over S. England is +15C to +16C (+27 to +29F) at 3Z on 7/19/22:
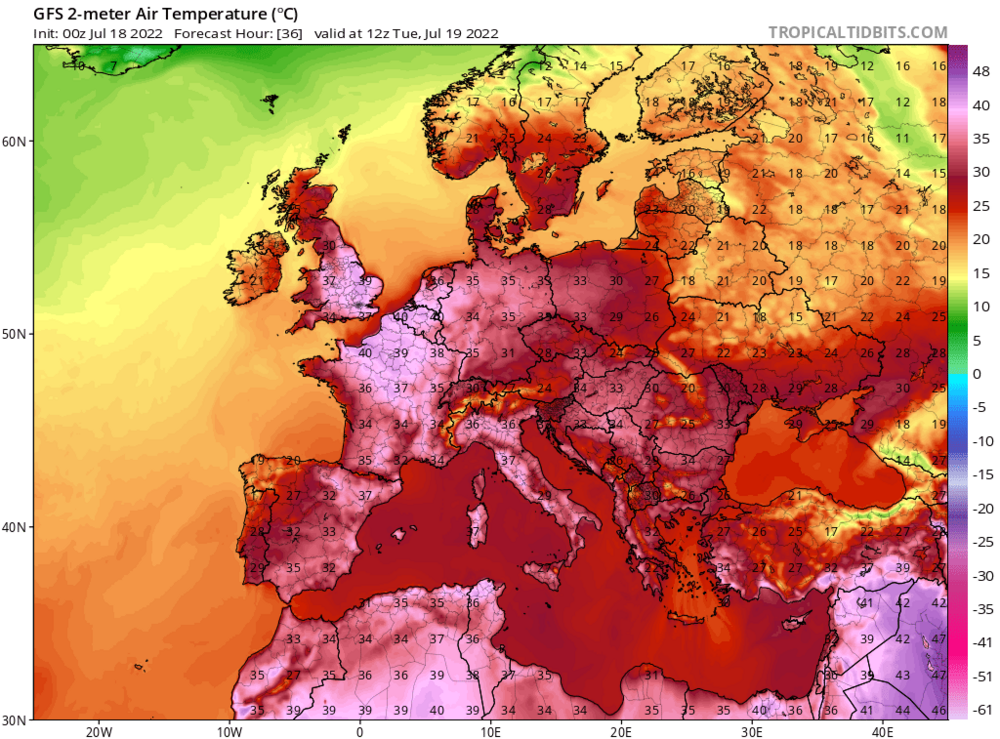
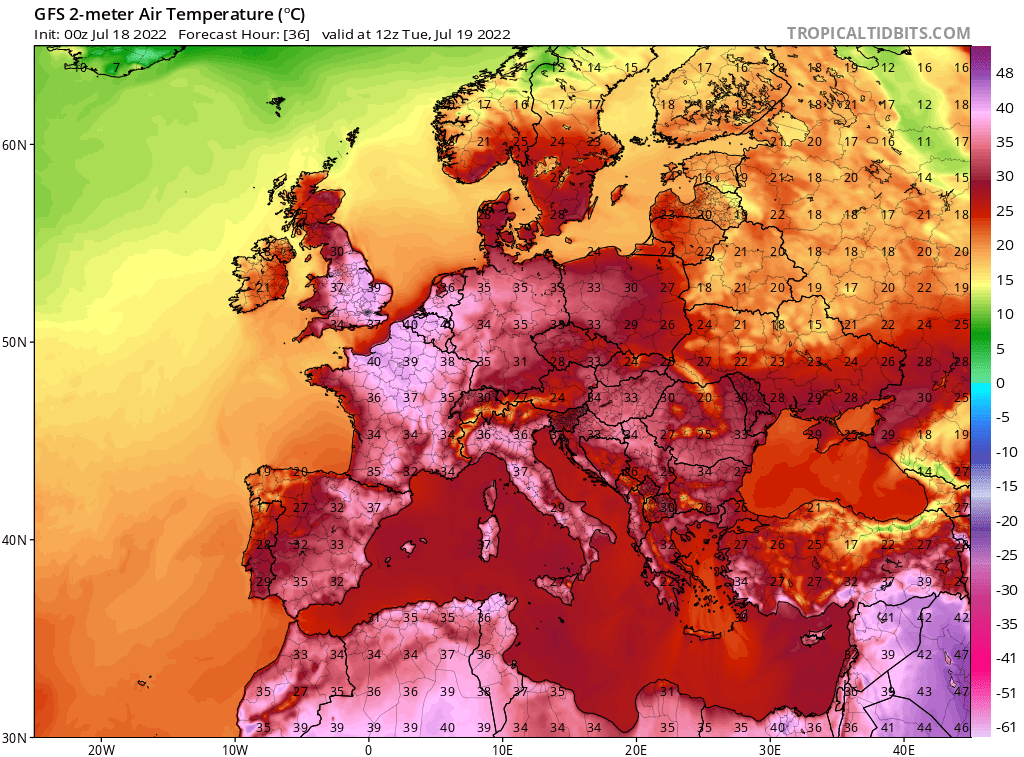
The peak 2M temperature on the 0Z GFS at London is ~+38C/+100F as of 12z on 7/19/22 but the hottest would likely be near 15Z, which I don't have. The hottest on the 0Z GFS in S England at 12Z on 7/19/22 is near +40C/+104 F, but a 15Z map would likely be hotter. (I'm not familiar with what the GFS 2m temp bias is here.)
These 2m temp anomalies are +28 to +30F:
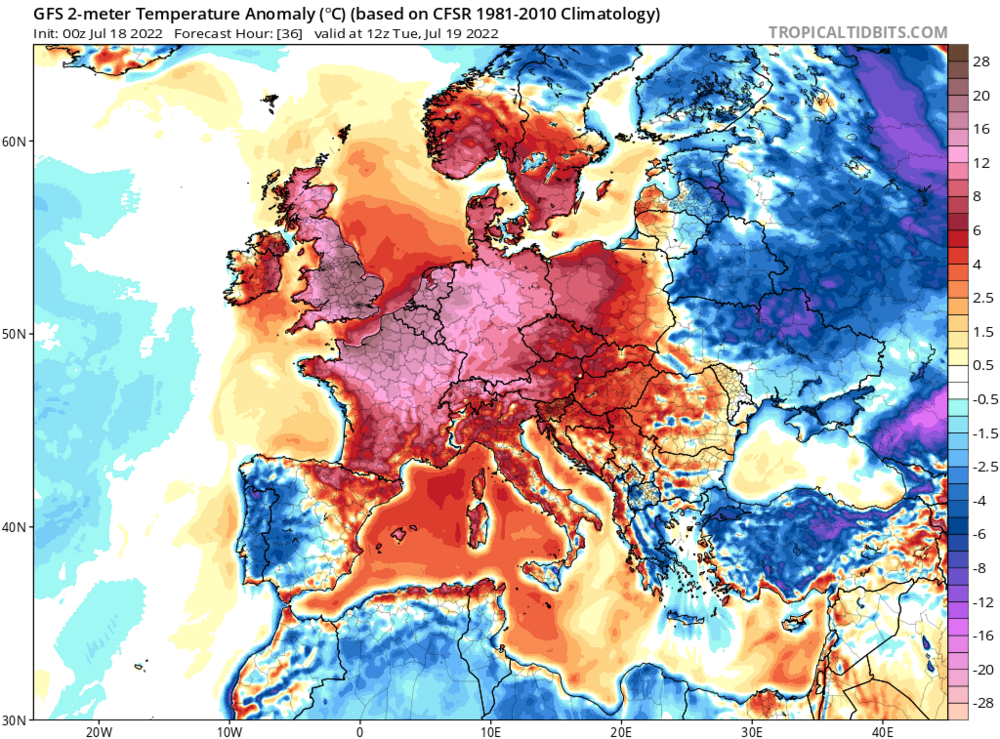
The all-time hottest daily low at London is +23.3C or 73.9F, set 7/29/1948. This has a good chance to be beaten on Tue 7/19/22 but we'll have to see if the temp drops back below that before midnight Wednesday:
https://en.wikipedia.org/wiki/Climate_of_London
This UK heat originated over N Africa and then traveled north to Spain with very little modification from the Mediterranean Sea due to traversing only a narrow portion of it. It will peak in W and N France on 7/18 before peaking in England on 7/19 on steady SSE winds meaning little modification from the English Channel. A surface low to the west of in combination with a surface high to the east is causing this hot wind flow. AGW is likely contributing several degrees to this heat. In other words, without AGW, the same setup would likely result in the peak heat being several degrees cooler than what will occur. I'd love to see the maps for similar intense historic heatwaves to compare things like peak 500 mb hts, 850 mb temps, and surface features. I assume the setups would be similar.
-
1
-
-
1 hour ago, cptcatz said:
For those responding to ldub, just remember he posted these posts in July/August 2020:
1. She/he has been bearish for the US east coast since almost as far back as the inception of the web lol.
2. With three NS as of July 17th, 2022 has been a hair more active vs the average # of NS as of July 17th in non-El Nino seasons back to 1995, which is 2.7.
3. The # of NS through July 17th for non-Nino seasons back to 1995 has had virtually no predictive power for the remainder of the season. That number of post July 17th storms has averaged 14.1 NS for non-Nino seasons back to 1995, whether active or not through July 17th.
3. After very recently analyzing some data for 3rd year La Niña seasons and comparing them to the prior season (2nd year La Niña), I've decided to lean against a hyperactive 2022. An active season that's more active than the non-Nino season average since 1995? Quite possibly. But hyperactive? I don't think so at this point. More active than 2021's active 146 ACE? While a reasonable possibility as hyperactive is quite a bit above that, I'm currently leaning to ACE not reaching 146.
Edit: 4. Based on the same data, I feel that the Gulf coast of FL is at an above normal risk the season.
-
2
-
-
55 minutes ago, bluewave said:
DMI has a nice discussion about the summer Arctic temperatures near the North Pole since 2002.
https://skepticalscience.com/DMI-data-on-Arctic-temperatures-Intermediate.html
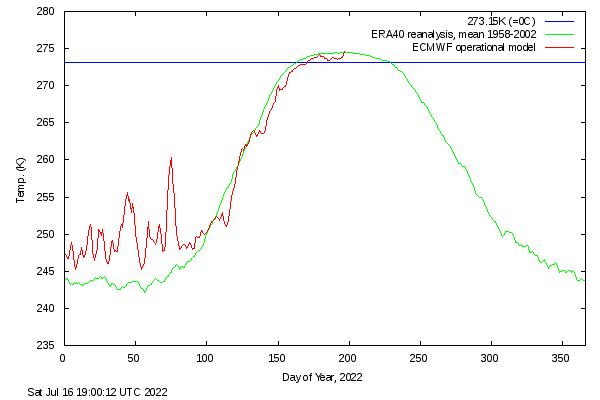
it seems that a cooling temperature trend in the Arctic summer is present, throughout the past approximately 10 years. Where 'summer' is defined as the period where the +80N mean temperature is above 273K. However, I very much doubt that a simple conclusion can be drawn from that, as there are complicating aspects to that analysis, e.g.: 1) The surface in the +80N area is more or less fully snow and ice covered all year, so the temperature is strongly controlled by the melting temperature of the surface. I.e. the +80N temperature is bound to be very close to the melt point of the surface snow and ice (273K) and the variability is therefore very small, less than 0.5K. I am sure you will find a much clearer warming trend in the same analysis applied to the winter period. The winter period is more crucial for the state of the Arctic sea ice, as this is the period where the ice is produced and the colder the winter the thicker and more robust the sea ice will become. 2) The +80N temperature data after 2002 are based on the operational global deterministic models at ECMWF, at any given time. Before 2002 the ERA 40 reanalysis is used. I.e. the +80N temperatures are based on 4 different models, the model used for the ERA 40 data set and the operational models T511, T799 and T1279. The point is that there can be a temperature bias in one or more of the models, that can cause the lower temperature level since approximately 2002.http://ocean.dmi.dk/arctic/meant80n_anomaly.uk.php

Thanks for posting. Indeed, this graph clearly shows what I had posted about regarding the slight cooling in summer despite strong warming Sept-April, with strongest warming Jan-Feb.
-
1
-
-
For the first day in over two months, the averaged Arctic 2m temperature north of 80N (red line) on July 16th went (barely) warmer than the 1958-2002 average (green line). It is ~35 F after being barely above 32 F on July 4th. The average between those two dates only barely rises. This is only one factor of many but it will be interesting to see if melting has started to turn around and increase vs the 2007-2021 average melt over the last few days since the last ORH update, which was done as of July 12th:
melt
-
My last 3 days (7/14-16) of rainfall: 0.03", none, none but heavy nighttime thunderstorms along and offshore the immediate coast moving northerly very early AM produced lots of rumbling thunder and frequent lightning in the eastern sky for several hours
10.73" is my total 7/1-16, one of the heaviest ever for the first half of July and ~triple the normal! Normal for the ENTIRE month is ~7". I'm at 17.73" since June 1st.
-
46 minutes ago, Weatherdude88 said:
Some of the climate models do have a negative feedback showing Northern Greenland and areas of high latitude getting colder with climate change.
Thank you for the detailed reply. I'll need to think through that some more to make sure I understand it.
Regarding the line that I quoted from you, would that negative feedback (colder higher latitudes with climate change) eventually result in cooling the lower latitudes back down or at least slow or even stop the warming there? In other words, is GW self-limiting/does it have a ceiling because of this? If so, where is that ceiling?
-
3 hours ago, ORH_wxman said:
I’m not sure how they are getting that data. Only issue I see is that graph is from NASA and not NSIDC….so maybe they are using a different algorithm.
Here’s a dataset of NSIDC extent and area but it stops in late 2021….
I’ve been using the below site for in-season area updates in 2022
https://cryospherecomputing.com
NSIDC has the area available somewhere on their site but it’s hard to find. The top of the first link’s data source explanation might be able to get us there but I haven’t taken the time to try and build my own spreadsheet yet based off it.
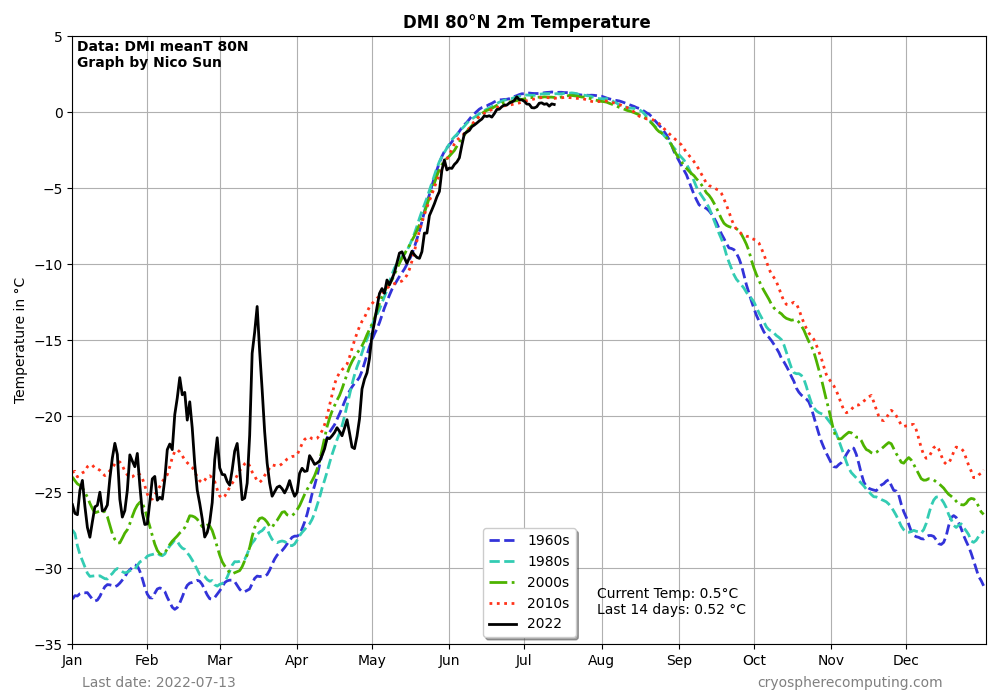
Thanks for those links. From your 2nd link, I found this interesting graph of Arctic 2m temps N of 80N by decade:
1. Temps warm as one would expect due to GW from the 1960s (dark blue) to the 2010s (red) September-April with the winter having the most intense warming, especially JF.
2. I estimate JF to be a whopping 7C (13F) warmer in the 2010s vs the 1960s (-24C vs -31C).
3. It appears to still be warming steadily Sept-April. In JF, the 2010s are 3C (5F) warmer than the 2000s (-24C vs -27C).
4. The summers, which have much smaller variance (so one will need to look carefully to see this), have oddly enough done the reverse with the 1960s the warmest and the 2010s the coldest for late May through mid-August with the 2010s ~1 F colder than the 1960s. Does less sea ice mean slightly colder in summer? If so, why?
Edit: I found this: "When ice melts or water evaporates, energy must be taken from the environment in order for the ice or liquid to move to a less ordered state. Energy is needed to weaken the individual hydrogen bonds between H20 molecules. When water (in any of the three phrases) moves from a higher to a lower ordered state, the air surrounding the H20 will have heat subtracted from it. The three processes that subtract heat from the surrounding air are evaporation, melting and sublimation (solid to gas)."
https://www.theweatherprediction.com/habyhints/19/
So, is it because the summers have had increased amounts of melting which then cools the surrounding air more than if there were less melting??
5. 2022 has been relatively cold since late April on most days after a relatively very warm winter as has been noted ITT. The summer of 2022 has averaged nearly 1C/2F colder than the 1960s. Perhaps that has been helping to slow the melt?
-
After 6 straight days of measurable rain giving me a total of 6.7", I got none today although there was thunder from a nearby storm.
-
7 hours ago, ORH_wxman said:
Where are you getting the area numbers from? There hasn’t been a minimum above 4 million sqkm since 2006.
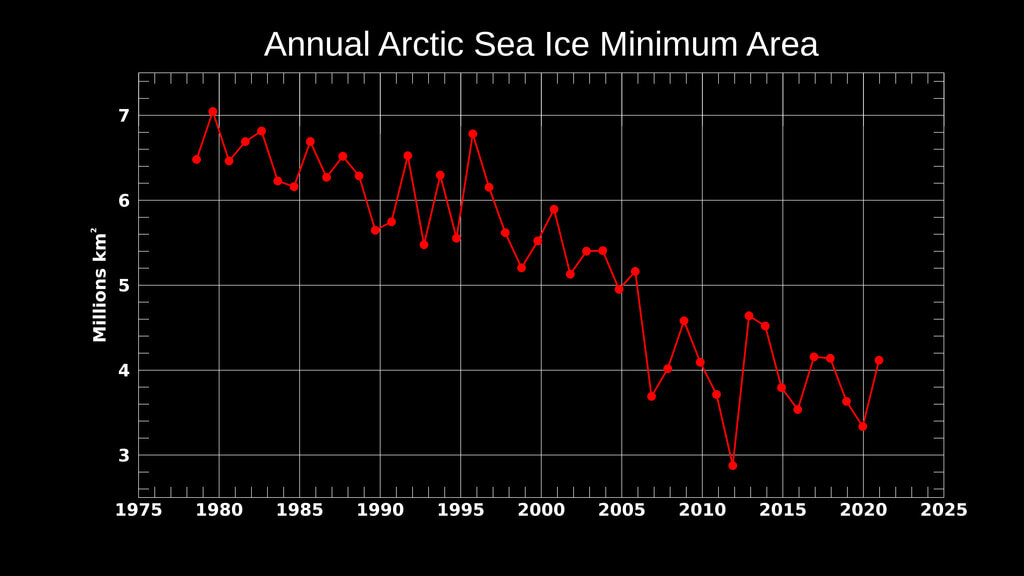
Hmmm, I must have done something wrong considering how knowledgeable and experienced you are on this, but I can't figure it out yet after looking at it again carefully. Am I doing an apples to oranges comparison? I thought you were looking at "Arctic sea ice area" in sq km. Is the source I used not looking at the same thing? Does it use a different method to measure area? Fwiw, its graph (see below) shows 2009, 2010, 2013 (highest since 2007 with 4.6 msk), 2014, and 2021 all above 4 million square km. It even says this about 2021: "In 2021, the Arctic minimum sea ice covered an area of 4.13 million square kilometers (1.6 million square miles)."
Would you please provide a link to your source for annual Arctic minimum area as well as how current sea ice area compares to prior years for the same date?
What do you have for 2012's minimum? This has ~2.9 million sq km:
https://svs.gsfc.nasa.gov/5002

-
4 hours ago, ldub23 said:
And again, last season while i said the pattern was not an east coast pattern we still had people saying there was going to be a nw atl ridge which never happened.
Last season had two Mid-Atlantic/NE US TS landfalls, the first season since way back in 1985 (Gloria and Henri). Before that, you had to go back to 1971 (Doria and Heidi). Others before that in that area with 2 TS+ landfalls in one season: 1961 (Esther and unnamed), 1960 (Brenda and Donna), and 1954 (Carol and Edna).
So, 37 years since the last one and only an average of one every 14 years for two landfalls since 1950. Since 1950, only a little over 1/3 of seasons had at least one TS+ landfall.
Thus, I still think you're downplaying 2021 a bit too much. You already called it weak and tame in other posts. You're making it sound like it was so quiet.
-
1
-
-
1 hour ago, ORH_wxman said:
Bluewave’s numbers were extent while I’m posting area. Area is a little different.
Yeah, I realized that when I posted though it certainly can get confusing.
I said: "But it does appear that the chance of it being at or above the 2007-21 average minimum of 3.9 msk has increased quite a bit vs how it looked on June 29th. Along with this, it appears that the chance for a September SIE at or above 4.8 msk has increased. That compares to the rough average Sept. extent of 4.7 msk for 2007-21 based on the Sept. SIE graph that @bluewaveshowed Monday."
So, I first referred to an increased chance for the minimum area to be 3.9+ msk (at or above the 2007-21 average minimum area). Then I referred to an increased chance for the September extent (SIE) to be 4.8+ msk (near or above the 2007-21 average minimum extent).
-
5 hours ago, ORH_wxman said:
Update:
As of 7/12, NSIDC area was 6.26 million sq km. The cold cyclone over the CAB right now continues to slow the area loss.
Here are where other years compared on the same date:
2021: -730k
2020: -750k
2019: -930k
2018: -190k
2017: -70k
2016: -620k
2015: -210k
2014: +30k
2013: -120k
2012: -940k
2011: -460k
2010: -330k
2009: +230k
2008: +40k
2007: -490k
Based on these numbers, the last two days have continued the significant increase based on the date of 2022 area vs the 2007-21 average area that started ~6/29. As of 7/12, the 2022 area was +370K vs the 2007-21 average. This is a 510K increase vs the 2007-21 average just since June 29th (see table below).
Based on the graph at the bottom of this post of the minimum area for 2007-21, I roughly estimate an average minimum area for 2007-21 of 3.9 msk. The range in msk is roughly 2.9 to 4.6.
If the +370K vs 2007-21 average were to still be the case when the 2022 minimum is hit, that would mean a 2022 minimum area of ~4.3 msk. If that were to occur, that would mean a minimum higher than all years 2007-21 except for 2009, 2013, and 2014. However, having a +370K vs 2007-21 at the minimum of the year is very optimistic, especially considering the near record low multiyear ice levels as of last September that @bluewaveposted about yesterday. So, average ice thickness was then at near record lows. Thus, I think that the chance of this year's minimum being significantly lower than 4.3 msk is high.
But it does appear that the chance of it being at or above the 2007-21 average minimum of 3.9 msk has increased quite a bit vs how it looked on June 29th. Along with this, it appears that the chance for a September SIE at or above 4.8 msk has increased. That compares to the rough average Sept. extent of 4.7 msk for 2007-21 based on the Sept. SIE graph that @bluewaveshowed Monday.
Recap of current area vs avg. of last 15 years as of:
6/15/22: +70K
6/16/22: +120K
6/20/22: +240K
6/22/22: +140K
6/29/22: -140K
7/1/22: +70K
7/10/22: +250K
7/12/22: +370K
Graph of Arctic annual ice area minimum since late 1970s from https://svs.gsfc.nasa.gov/5002

-
Like clockwork, the late day thunderstorm is hitting. The CTG is pretty significant.
Update: However, for a change we're getting a needed break from the prior days of heavy rain (nearly 11" in 11 days) with just a steady gentle rain along with rumbles of thunder now. I ended up with only 0.05", which brings MBY mtd to 10.70". Based on my look at official Savannah records back to the 1870s as well as the ag station records, this 10.70" could easily be and probably is the heaviest for my location for July 1st through 12th.
-
Yesterday's (7/11) rainfall in Chatham County, GA, ended up being the most widespread very heavy in the county overall since 11/6/2021 (though MBY's heaviest was 7/1) and thus continued the VERY wet July in much of the county, especially in a good portion of central to eastern sections. I ended up at 2.95", bringing my July MTD up all of the way to a whopping 10.65"! For MBY, this has to be one of the wettest 7/1-11 periods ever with nearly 1"/day averaged out!
Here is the CoCoRaHS map that covers yesterday's rainfall, which was heaviest (orange and red) from Coffee Bluff/White Bluff eastward to Burnside and Skidaway Islands (3-4.75"). KSAV got 1.07" while KSVN (Hunter) got 2.46":
-
 1
1
-
-
This afternoon and evening I've gotten another boatload of rain from thunderstorms with street flooding at least about as bad as yesterday and it is still coming down. I've received 2.05" since mid afternoon so far, which puts me at 9.75" MTD and counting. That is already near 4 times the normal for July1-11 and is way, way higher than what KSAV has received. That is mainly because I got 4" on 7/1 from the predecessor to TS Colin as well as 2" yesterday and 2.05" so far today whereas the airport only got light all three days.
Today looks more widespread than yesterday in the county with the heavy rainfall from what the radar has been showing although the airport has received only light so far as I said.
Edit: I ended up at 2.95" total yesterday (7/11) with thunderstorms almost continuous from mid-afternoon through well into the evening.
-
22 hours ago, WinstonSalemArlington said:
What is wrong with GFS this summer?
It is nothing new that the operational GFS has a bias to overdo summer highs during hot periods. Also, the Euro op. has done that at least to some extent the past few years. The better bet is to go with the ensemble means because they average cooler than the operationals.
-
1
-
-
14 hours ago, Awesomesauce81 said:
Yet the official totals for KSAV does not reflect your reality ( I don't have official totals in myb but I'm sure I'm closer to your total). This leads me to believe that SAV needs more than one official station like Charleston.
I ended up right at 2" yesterday (7/10), near the jackpot for the county. To illustrate the high variability yesterday in Chatham County, check out the image below, which is the 24 hour rainfall ending at 7AM this morning per CoCoRaHS. The lows in light blue of 0.05" and 0.06" were at opposite ends of the county, Garden City and Skidaway Island. The highs in orange and red of 1.39" and 2.11" were in a narrow ~5 mile long corridor within the heart of the county from near Wilshire Estates on the southside (near Abercorn) to near E. Victory Dr.:
-
1
-
-
Today's weekly update has Nino 3.4 at -0.5 C, slightly warmer than the prior week's -0.6 C. For those who don't happen to know, the -0.5 C is essentially based on the average of last week due to the normal ~5 day reporting lag.
The SOI, after one day of barely negative, has gone back to positive (modest so far). I'm assuming that much of the reason for the record low MJ MEI is the very strongly + MJ SOI. The 2022 MJ SOI was way up at +17.1, which is 2nd highest (records back to 1876) to 1917's +19.4. In 3rd is 1950's +15.0. In 4th is 1931's +14.2, 5th is 1915's +14.0, and 6th is 1938's +13.9.
Where did these 5 other years end up ENSOwise during the subsequent fall/winter dip? One might think good chance for moderate to strong La Niña. However, only one was moderate (1917, the record holder for MJ +SOI), none were strong, and the other four were weak Niña to cold neutral:
1915: weak La Niña/cold neutral border
1917: moderate La Niña
1931: cold neutral
1938: weak La Niña
1950: cold neutral/weak La Niña border
Based on this, I'll educatedly guess for now a weak La Niña for the upcoming fall/winter with probably an earlier than average low point.
Daily/last 30 days SOI:
https://www.longpaddock.qld.gov.au/soi/
Monthly SOI back to 1876:-
3
-


July 2022 Observations
in Southeastern States
Posted
I got another storm today, this one at mid afternoon along with some followup steady light rain. It was about three hours worth. Todays amount was a modest 0.18". But even that amount matches the amount from one irrigation and it all soaked in. So, it is all appreciated. I'm now up to 11.41" mtd.