

GaWx
-
Posts
11,546 -
Joined
Content Type
Profiles
Blogs
Forums
American Weather
Media Demo
Store
Gallery
Posts posted by GaWx
-
-
1 hour ago, dan11295 said:
When doesn't it?

Good point as that seems to be his default, but to fair I know there was one year recently when JB didn't go high risk for the east coast. Personally, whereas I think the east coast should by no means relax especially this early in the season (I'm wary about the danger, myself, but I am most years and also hope for the best), my highest direct hit risk area per analogs and the recent pattern remains the NE GOM, especially around FL.
Edit: I just checked and in 2021 he had the upper east coast at well above average risk. The NE got directly hit by 2 TS, which is above the average of 1 or fewer TC hits for the upper US east coast. So, I give him a win there for 2021.
More updates: 2020: He had an active season overall but I'm not sure of his impact forecast for the NE US. It appears he did pretty well overall.
2019: he had a somewhat weak season forecasted and it appears he also had a lower impact forecast for the NE US. So, I think this is that recent year I was referring to. ACE turned out to be 132 and Dorian was a beast, but the upper east coast did get off lightly. So, I guess he did ok overall.
"From this point of view it looks like a down year in at least the Main Development Region and less of a year farther to the north than last year. The caveat is that in-close systems and warm water feedback will lead to challenges that can make or break the season from an impact perspective. On the high end, if the El Niño isn't impressive we could see activity in line with last year, hence the relatively broad range. I have a feel for where below average intensity of storms relative to normal will be, but the term "scattershot" describes the idea of stronger features away from the Deep Tropics this year."
https://www.weatherbell.com/april-hurricane-season-outlook
2018: "WeatherBELL.com is forecasting in between a BELOW to ABOVE average Season with 11-15 named storms, 5-7 hurricanes which 1-3 of those becoming major hurricanes and an Accumulated Cyclone Energy (ACE) of 90-110. WeatherBELL says as far as impact, unlike last year when we plainly had the U.S. in the cross-hairs, this year it looks like the U.S. will be on the western edge of the highest ACE area (50% or more). This will extend between 30°N and 40°N from the U.S. coast to 55°W. If I had to draw it today, the centering of the area of greatest activity would not be like last year. Look for storms to be stronger farther to the north and east than 2017."
https://www.trackthetropics.com/hurricane-season-2018-forecasts/
-
 1
1
-
-
38 minutes ago, Hoosier said:
Wait, rainstorm is ldub? I thought they were different people.
Absolutely. Posting style is identical. Also, both have the Norfolk/VA Beach area as home. He or she has amazing longevity for that kind of posting! Like others have said, this person is legendary among trolls.
@Torch Tiger Yes, thanks for reminding me. Rainstorm absolutely did have a heart avatar and now I clearly remember it! That was after having the lady with the U.S. flag scarf avatar, which I recall from when jxdama was the name used at WW.
-
51 minutes ago, ORH_wxman said:
Update:
On 8/7, NSIDC SIA was at 4.32 million sq km. Here is how other post-2007 years compared on the same date:
2021: -220k
2020: -840k
2019 -790k
2018: -10k
2017: -290k
2016: -660k
2015: -470k
2014: +380k
2013: +240k
2012: -1.14 million (-1140k)
2011: -570k
2010: -120k
2009: +200k
2008: -120k
2007: -440k
This latest area update brings down 2022 a rather significant amount vs the average of 2007-21. It is now at +320K vs the prior 15 year average for the date as compared to +440K as of eight days ago.
Recap of current area vs avg. of last 15 years as of:
6/15/22: +70K
6/16/22: +120K
6/20/22: +240K
6/22/22: +140K
6/29/22: -140K
7/1/22: +70K
7/10/22: +250K
7/12/22: +370K
7/16/22: +330K
7/20/22: +360K
7/23/22: +480K
7/26/22: +460K7/30/22: +440K
8/7/22: +320K
-
9 hours ago, Torch Tiger said:
Year after year, the dumbest takes. Said it before, I remember them from easternuswx and maybe even wright-weather "rainstorm VA" or something like that. lol
Way back in the WW days (~20 years ago), this poster went by the name "jxdama" with what I recall was an avatar of a woman with an American flag scarf. That may have covered 2003, when he/she got blasted by Isabel in the VA Beach/Norfolk area after giving the entire east coast the all clear just a few days before. Thankfully he/she was ok. At some point, he or she began posting as the infamous and everyone's favorite "rainstorm", possibly with the same avatar but I'm not sure. I can't recall if this name change was when Eastern started or before, but I'm guessing it was when Eastern started. This poster used to also post at Storm2k with a different name.
@WEATHER53 may remember a lot of this.
jx/rs/ldub is "world renowned" to be about as "good" a troll as they come and I admit sometimes makes me laugh because it is often so over the top/silly. The key is to not take the posts too seriously. I bet ldub is often laughing bigtime behind the scenes. By the way, I think he/she really is quite smart and knowledgeable despite the trolling dumb takes. One year rainstorm actually won the Eastern tropical contest! I remember because I ran it. I don't think it was even close. It was hilarious! Rainstorm won it because it was she/he picked pretty bearish and it turned out to be the most bearish season in years.
-
2
-
 1
1
-
 2
2
-
-
21 minutes ago, tiger_deF said:
Given how bearish the board is I was suprised to see our AOI off of Africa looking pretty healthy
I'm still giving it a 2 in 3 shot at becoming at least a TD. The board may not be as bearish as you think once you ignore the troll.
-
1
-
-
I ended up with a very nice 1.38" today, which brings me to 2.88" mtd. That is quite a bit wetter than normal for the first week of August.
-
5 hours ago, TheClimateChanger said:
Dishonorable mention to the other Italian-American weather guru named Joe, for this atrocious forecast at the Heartland Institute's ICCC in July 2014:
At one time, I felt there was a possibility for at least a pause in GW due to the last two very weak sunspot cycles. I was being open-minded. I even allowed enough time for an assumed lag based on the ideas that afternoon highs occur several hours after the daily solar high point and summer's hottest normals occur a month after the summer solstice. However, I pretty much gave up on this idea a few years ago when I saw GW still didn't appear to be slowing to any great degree other than temporary halts due to La Niña. Has there been any significant slowing?
We're now nearly 14 years past the late 2008 very weak minimum and nearly 3 years past the 2019 very weak minimum. Even taking into account lag, I now find it hard to believe that there will be a GW pause of a significant length of time due solely to the sun. The sun doesn't seem to be as significant of a factor as I at one time thought was possible.
-
Latest model consensus:
- Very good chance for a TC forming in MDR by mid week. Any potential threat to US east coast would be near Aug 18-22 if it were to get close though any one TC forming that far out, even in La Niña in mid Aug, would have a better chance to either recurve safely offshore or a smaller chance to dissipate OTS. The 0Z CFS, which I don't take seriously for tropical details, fwiw actually has this get very close to the east coast Aug 19-22.
- A followup E MDR TC quite possibly forming ~Aug 18-20 as the Azores-Bermuda high gets reestablished to the north as per many ensemble members. This would have decent potential to get steered to the western basin based on this setup along with it being La Niña near the end of Aug, an often dangerous time for especially the SE US.
- Additional much closer to US geneses mid to late Aug will need to be monitored as alluded to by Ed, especially with the very warm Gulf and off SE coast.
- Thus a 3-4 NS Atlantic August is looking like a good possibility, reenforced by Aug total # of NS climo since 1995:
1) only one season with no NS, the strong El Niño of 1997
2) 24 of 27 have had not just 2 but 3+ with only 1997 (super El Niño with 0), 2013 (2), and 2014 (weak El Niño with 2) having fewer than 3
3) Closest ENSO analog (2000) had 4
4) 1996, 1998, and 1999 had none til Aug 18-19 but all ended up with 4
- I never forecasted "hyper" season ACEwise but I continue to expect an active and potentially dangerous season for the US with a guess of 120 ACE. This all appears to still be on track as best as I can possibly tell a week before the climo most active 2 months has even started.
-
2
-
-
Got awoken 9AM by a heavy storm with several hits of nearby CTG. This looks to be a nice hit of rainfall as it is still coming down though it has gotten much lighter here by 9:30 AM. Per radar loop, heavy rain started here near 8:30 AM after a period of lighter rain. It looks like 1"+ here roughly. Other areas of county appear to have gotten much more as a flood advisory has been in effect for the county since 8:44 AM due to only slow movement WNW:
FLOOD ADVISORY NATIONAL WEATHER SERVICE CHARLESTON SC 921 AM EDT SUN AUG 7 2022:
..FLOOD ADVISORY REMAINS IN EFFECT UNTIL 1015 AM EDT THIS MORNING * WHAT...FLOODING CAUSED BY EXCESSIVE RAINFALL CONTINUES. * WHERE...A PORTION OF SOUTHEAST GEORGIA, INCLUDING THE FOLLOWING COUNTY, CHATHAM. * WHEN...UNTIL 1015 AM EDT. * IMPACTS...MINOR FLOODING IN LOW-LYING AND POOR DRAINAGE AREAS. WATER OVER ROADWAYS.
- AT 918 AM EDT, DOPPLER RADAR INDICATED THUNDERSTORMS WITH TORRENTIAL RAINFALL EXTENDING FROM GARDEN CITY AND DOWNTOWN SAVANNAH SOUTH TO WHITE BLUFF, VERNONBURG AND RIO VISTA. AS MUCH AS 2 TO 3 INCHES OF OF RAIN HAS FALLEN ACROSS PART OF THE SAVANNAH METRO AREA SINCE JUST BEFORE 8 AM.
- ADDITIONAL RAINFALL AMOUNTS OF 1 TO 2 INCHES ARE EXPECTED OVER THE AREA. THIS ADDITIONAL RAIN WILL RESULT IN MINOR FLOODING. -
I had a short period of rain early today, but it resulted in no more than a few hundredths. I'm still near 1.5" mtd.
-
Looks to me like all is going according to how it has looked in recent days with a good chance (I think it is now up to 2/3 chance) for an MDR TC to form in less than a week. That would still be only August 13th or earlier with four NS with the most active two month period climowise still just ahead of then.
-
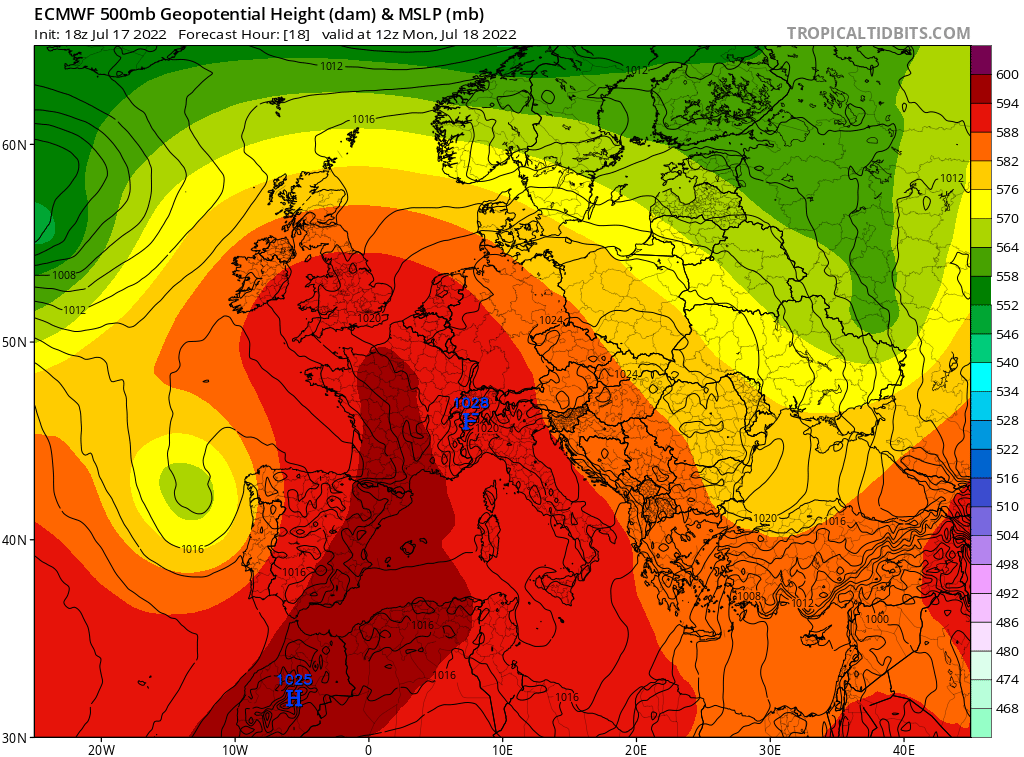
4 hours ago, Typhoon Tip said:
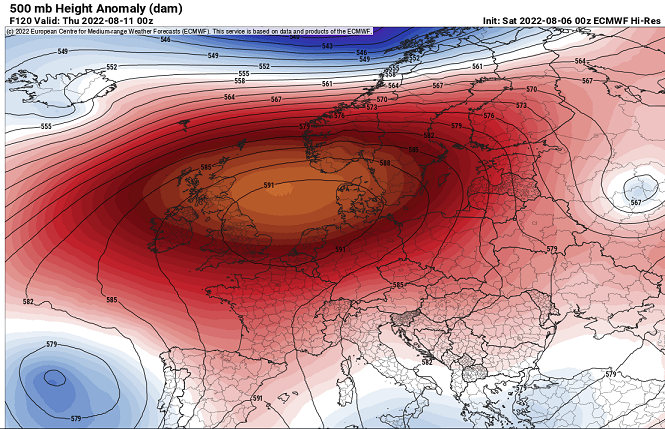
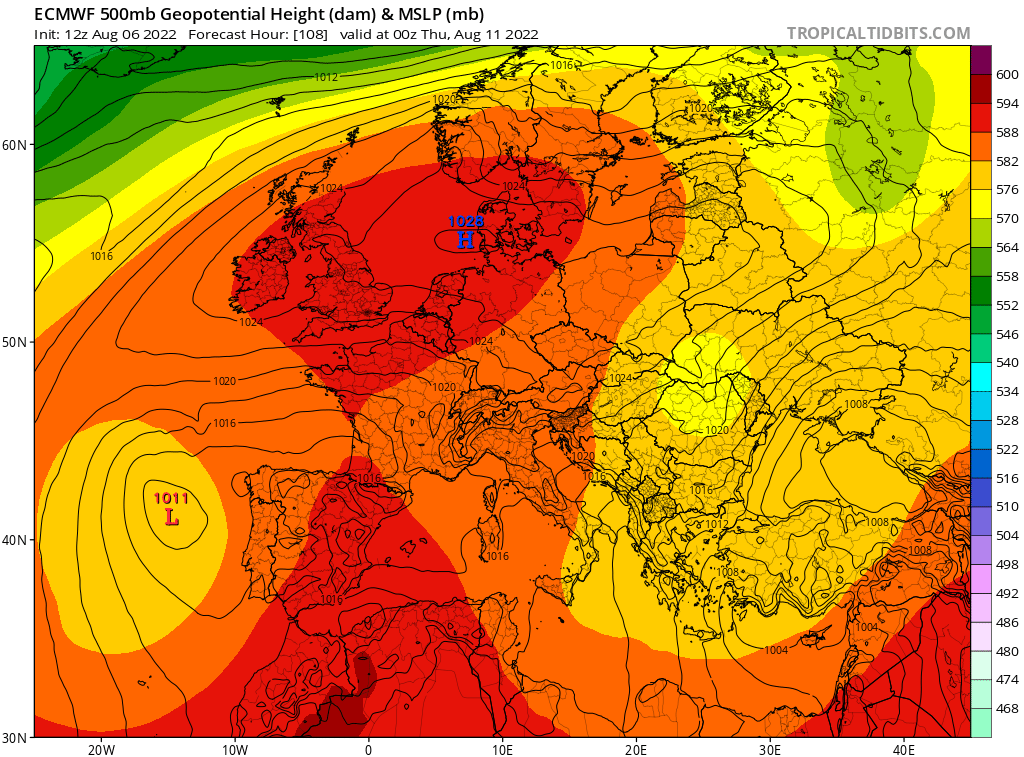
The last four day's worth of nightly EPS means have been amplifying another NW European, 500 mb non-hydrostatic anomaly - roughly centered on August 11th.
As of last night, it has breached the 590 dm in/and continuing along that established trend.
As for now, this is really more of a hot couple of days by their standards, but it is noted that there are still 5 days - the erstwhile trend to amplify further may not be finished yet...
This could be more an operational effort, but ...seeing as these 'synergistic' heat waves are very much a part of CC - as per well documented attribution studies - and this is beginning to take on the appearance of being a potential intra-seasonal analog ( meaning it happened once, it can happen again before we exit the hemispheric summer), it's sharing contextual space with forecasting efforts.
The 850s mb has also been maturing along the same trend, showing a 'river' of hot air origined over the NW African Continent, ... passing over the Iberian Peninsula, where there is less means to modify, circumstantially.
This won't take much more modulation of these synoptic metrics to become another headline event for much of France and the UK.
Even if this does not destined to produce ( ..in fact, it's getting kind of late for their latitude), it is note-worthy that this look is materializing again.
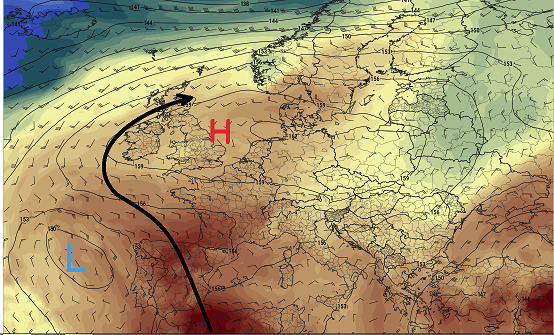
Interesting. However, by this point (5-6 days out), the models were already largely onto the record heat. Also, although the progged 500 mb peak in southern England (591-2 dm) is very similar to the 592 dm peak last month as you implied, the progged E surface winds late next week (due to the sfc high center being to the NE over the N Sea/Denmark along with it ridging westward) vs the SSE sfc winds bringing in the very hot air last month (due to the sfc high center being over Switz. in concert with sfc low to SSW of UK) (see below) are currently limiting S. England progged highs to more ordinary hot as you said (low 90s vs low-mid 100s then). So, I agree with you that it is looking like just a couple of hot days rather than anything approaching last month:
7/18/22 very hot SSE winds from France into S Eng. (along with 592 dm 500 mb peak):
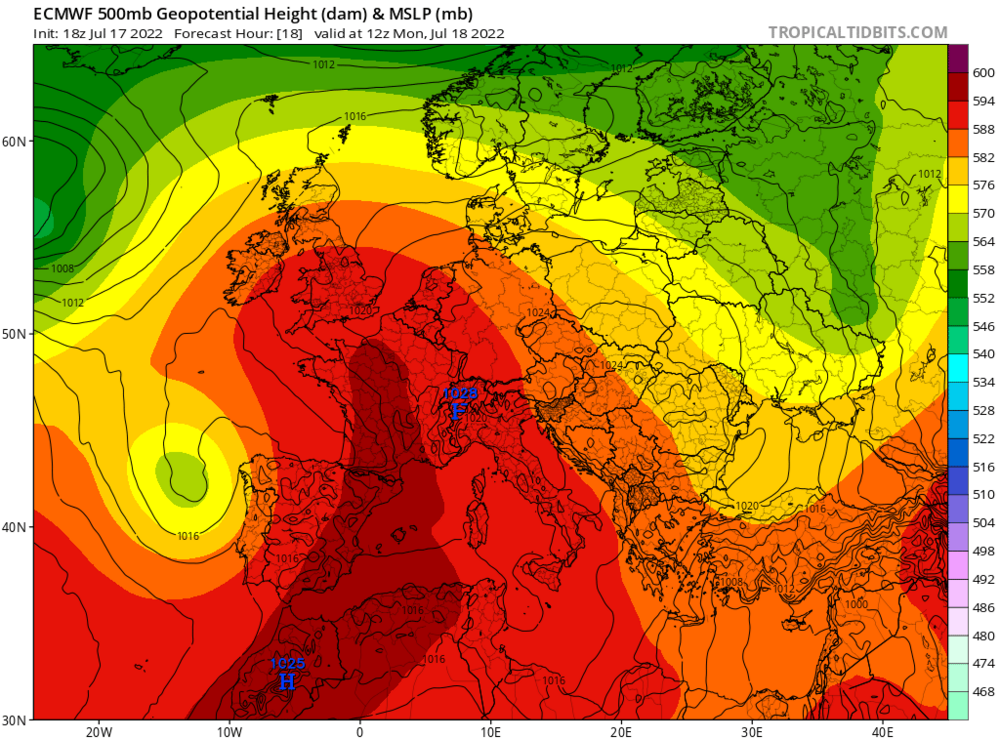
8/11/22 prog: only more ordinary heat due to E winds from Netherlands/Germany into S. Eng. despite 500 mb hts 591-2 dm (nearly as high as 7/18/22):

-
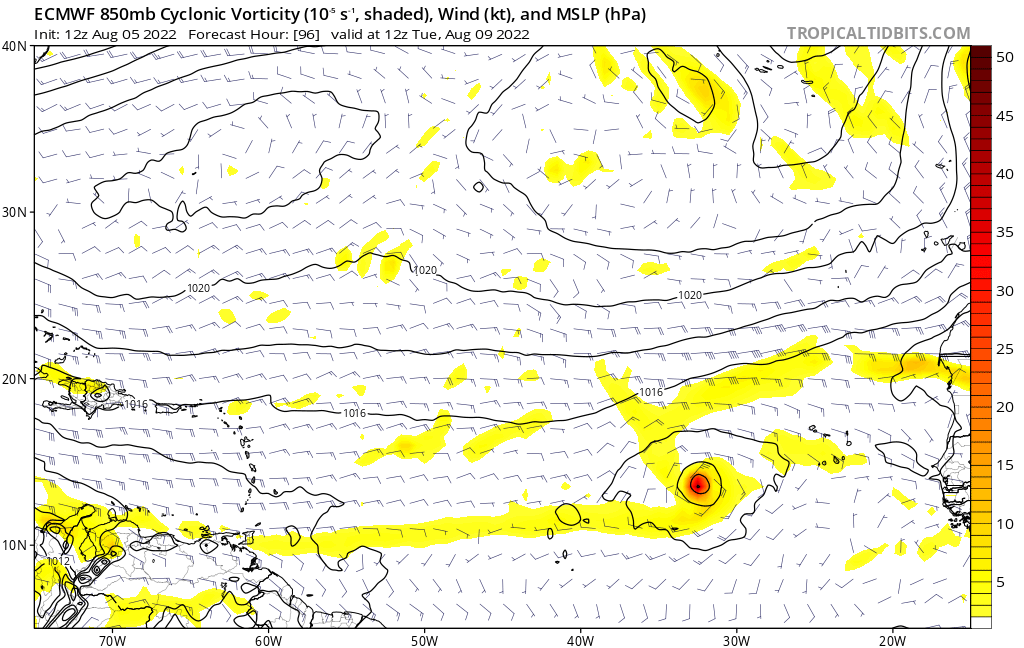
The 12Z EPS is much more active with this MDR wave vs the last several EPS runs and is likely the most active run so far.
-
1 hour ago, StruThiO said:
k. meanwhile
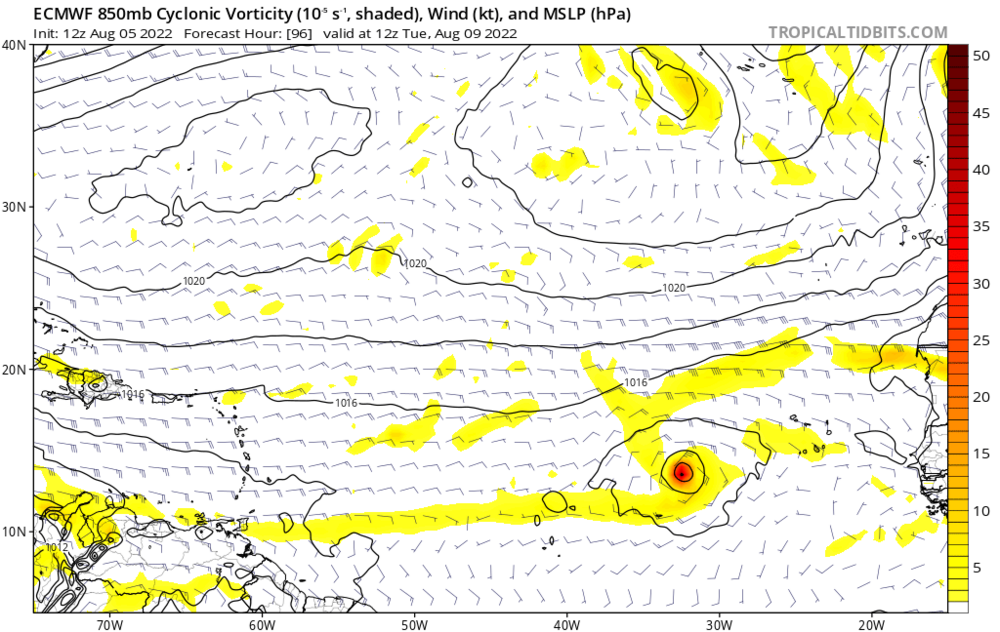
This is the MDR wave that many of us have been discussing since it has been on many ensemble member runs of the various ensembles the last few days. It doesn't take the "super duper awesome fantastic" conditions ldub referred to for this to occur. Normal mid August climo conditions are all that is needed. So, this is quite believable imho. Also, before ldub says anything: IF it were to not form, it wouldn't portend much about later in the month and beyond. IF this were to form and IF this were to recurve safely away from land, that wouldn't portend much for the remainder of the season either as many TCs that form that far east do just that even during La Nina and even during mid-August. Then again, safe recurve chances are near the lowest of the season around mid August (even though they're not small) and those chances are generally lower during La Nina vs other ENSO. So, one to watch for sure.
-
1 hour ago, ldub23 said:
Did someone say the super duper awesome fantastic conditions were coming?
I don't know. Did someone? When did this "someone" actually say this and when is this "super duper" setup supposed to occur? This overdramatization seems to me to be a straw man you're creating to divert attention from the normal discussion.
You've been the one who keeps mentioning JB and has posted about his 1954 stuff. Has anyone else here done that?
Back to reality: I still think there's a decent shot (50% chance) at a TC forming in the MDR within the next 10 days. If so, look for it to be a decent ACE producer. If that doesn't form, look for one quite possibly by 8/20. I'd be quite surprised if we don't get the next TC to form by then.
I'm still going with 3-4 TCs this month....nothing out of the ordinary. Not quiet and not overly active though all it takes is one for a potential disaster. That would get us to 6-7 NS by August 31. Still going 120 ACE for the full season meaning a pretty active rest of season.
-
1 hour ago, Ed, snow and hurricane fan said:
Just the usual reminder that even in dead seasons like 1983 and 1992, major hurricanes can still hit population centers. 'A' storms that formed in August. 1992 a Cat 5 just South of MIA and a Cat 3 near KPTN.
Absolutely. it is kind of scary that even in an otherwise weak season, one storm can devastate one's area. I kind of think of 1965 that way due to Betsy mainly on New Orleans. Perhaps 1991's Bob to a lesser extent. I guess 1938 wouldn't qualify because of H #3 hitting LA in addition to the NE monster.
-
1
-
-
3 hours ago, NorthHillsWx said:
Brutal summer for us as a whole. Going to remember this one. Lack of interesting tropical weather has made it all the worse.
From my perspective as regards the SE itself, there has already been one interesting TC: the homegrown Colin. And it is only August 4th, way earlier than the vast majority of years that ever get interesting in the SE.
*Corrected for error
-
Whereas today's significant downward CO State ACE change makes perfect sense, I think 150 ACE is likely still too high. The highest 3rd year La Niña/cold neutral season ACE of the 8 analogs was at 135 with 2000's in 2nd with 119. With it still only at 3 and with little chance of anything the next 7 days (through 8/10), I'm putting the likely high end near 135 with 120 my best guess. But I'd keep in mind that:
1. The models sometimes have badly missed the flip of the switch from quiet to active. Whereas they may be right, don't be fooled into thinking they're anywhere close to being all knowing. We could always be just days from a flip of the switch.
2. Even a 120 ACE would still mean an active 8/11+.
1985, another 3rd year cold ENSO analog, and one of the most active ever for the US with 7 H landfalls (6 during 8/15+) had an ACE of only 88 and # of NS/H/MH only near the longterm average of 11/7/3!! The 7 US hits in 1985 was one more than the devastating and hyperactive seasons of 1893 (including PR), which had an ACE of 231; 2004, which had an ACE of 227; and 2005, which had an ACE of 250!-
4
-
-
I don't normally put much, if any, weight on what JB ever says about the tropics. I don't follow him as much as in the past although ldub is making sure we do lol. Years ago, I took what he said more seriously. But I've since learned he's often (though not always) a broken record who not only tends to be a weenie wishcaster, he also mainly wants more business. And besides, his biggest emphasis is for the Mid Atlantic and NE states. So, for what potentially affects me personally, he doesn't care as much.
-
1
-
-
Finally! Due to an area of thunderstorms moving slowly NNW from the coastal waters, I'm getting my first measurable rain since way back on July 21st! Just in time to avoid the possibility of having to turn on the sprinklers. The rain started ~1:15 PM. It is coming down heavily along with one very close CTG lightning strike.
Preliminary estimate a very nice 1.5" here, which brings me to ~20.5" for the met. summer so far. That compares to a normal full JJA of about that much,
-
No measurable rainfall here the last 12 days (back to 7/22) including today.
-
What does August hold for NS in the basin? Consider these stats
- Since 1995, there has been only one season with no August NS: the super strong El Nino of 1997.
- Since 1995, 24 of 27 (89%) have had not just 2 but 3+ NS in August! Only 1997 (0), 2013 (2), and 2014 (weak El Nino)(2) had fewer than 3 in August.
- 1996, 1998, and 1999 all had 4 NS in August but the first one for all three seasons wasn't til either August 18th or 19th!
- The ENSO analog 2000 (3rd year La Nina) had 4 NS in August.
- Even the pre-1995 ENSO analog of 1985 had 3 NS in August. Actually, all ENSO analogs even going back to the likely underreported years of the 1800s had at least 1 NS in August.Conclusion: Based on history since 1995, you'd have to be bold to go with fewer than 3 NS this August even with the quiet first week or so on the models. I think 3-4 is the most likely with only a slight lean toward 3 NS in August. Even if the first half has none, 1996, 1998, and 1999 all show that 4 NS the 2nd half of the month is doable. In addition, keep in mind that models often don't pick up on a general upturn in activity til the last minute or sometimes even not at all.
-
1
-
1
-
-
2 hours ago, Normandy said:
@ ldub23
Can we make a deal? If the season ends above average can you never post in this topic again? I like your enthusiasm but I think we need some stakes on this take.
You can forget about that deal. ldub would be back, which is fine with me since it would show (s)he's OK and also it is an entertaining tradition that has always kept the threads active during quiet periods. As long as we don't take these posts too seriously, they're ok imho. Plus bearish posts are good to see imho to keep a good balance in the discussions. Sometimes the bears will be right.
Keep in mind that ldub's posting is (and always has been) strictly from the perspective of the threat for someone on the mid-Atlantic coast or NE US coast being hit and hit really hard not just regular hard (example: 2021, despite the above normal NE US activity, was excluded by ldub as quiet/weak despite an uncommon double TS direct hit season in addition to strong Ida effects). Bad seasons for portions of the SE US or US Gulf coast matter little to ldub if the upper US east coast is not also hit hard. When ldub posts about steering that is/isn't favorable for a hit, that's not necessarily the case for the SE US or Gulf coast.
More specifically to get the ldub-o-meter going, you need seasons (since 1950) like 2012, 2011 (ldub's area hit), 2003 (ldub's area hit), 1999 (ldub hit), 1996, 1991, 1985, 1976, 1960, 1955, 1954, and 1953. That's only 12 seasons out of the last 72 or only 1 in 6 seasons. Seasons since 1950 that instead only hit the SE and/or the Gulf coast really hard and with 2+ H hits like 2021, 2020, 2018, 2017, 2008, 2005, 2004, 1998, 1995, 1989, 1979, 1964, 1959, and 1950 would likely have never gotten the ldub meter going due to not enough NE US impact. Without ldub's restrictive criteria, it could easily be argued that about twice as many seasons since 1950 had multiple and major US impact (over 1/3 of the seasons).
Edit: keep in mind that I'm not even including seasons with just one big SE or Gulf hit like 1992, 1974, 1970, 1969, 1967, 1965, and 1957 among others which obviously could have also been included. When seasons like those are also included, you're at ~50% chance for a high impact US season vs only ~1/3 that high per ldub's perspective.
Edit #2: As I've said before, this year does appear to me based on analogs as well as when considering recent prevailing steering that ldub has been harping on to be extra risky for at least one direct hit on the NE GOM (FL). By extension, that would imply some extra risk for something that would possibly then go up into the SE and/or up the SE coast as well as possibly then up the NE coast. But my primary concern is for the FL Gulf coast. Every ENSO analog that I considered had significant to major FL Gulf coast activity.
-
1
-
-
IMBY this month: a wet total 11.98", which compares to ~7" normal. But that doesn't tell the whole story.
- July 1-11 had a whopping 10.65", at or near the wettest ever for that period/near 4 times the normal
- July 12-31: only 1.33" with none the past 10 days vs ~4.5" longtime average for July 12-31. So, I ended up <1/3 the normal for July 12-31.
What a lopsided month! Another way to look at it: first third at 7.05", which is one of the wettest, if not, THE wettest for July 1-10. Last third (July 22-31) with no rain: tied for the driest. But the wet still easily wins for the month.
Invest 97L--10% 2-Day/10% 5-Day Development Odds
in Tropical Headquarters
Posted
Although the writing is on the wall and the chances for hyper are steadily dropping (I never expected hyper), it is still too early imho to say with confidence it will end up a "total dud". Keep in mind that the very active seasons of 1996, 1998, and 1999 (ACE 166-182) didn't have their first August NS til the 18th or 19th. Actually, 1998 and 1999 both had only their 2nd NS 8/18-19 whereas 2022 has already had three. Also, 1992 didn't have Andrew til August 16th!