MegaMike
-
Posts
581 -
Joined
-
Last visited
Content Type
Profiles
Blogs
Forums
American Weather
Media Demo
Store
Gallery
Everything posted by MegaMike
-
I ran additional simulations if anyone's curious. All of them are at the following paths. Winter Storms (testing extratropical namelist options) Jan, 2005 - https://www.youtube.com/watch?v=Pe_75ngrc8Y&li st=PL7uw9vTkqQwp1s4oh6TRd8qm6StglCkUd&index=5 Apr, 1997 - https://www.youtube.com/watch?v=uEmCRmaUPtY&list=PL7uw9vTkqQwp1s4oh6TRd8qm6StglCkUd&index=2 Jan, 1996 - https://www.youtube.com/watch?v=J4o1Nz9wdBw&t=136s Mar, 1993 - https://www.youtube.com/watch?v=kyZWFzDvS4k&list=PL7uw9vTkqQwp1s4oh6TRd8qm6StglCkUd&index=3 Feb, 1978 - https://www.youtube.com/watch?v=sm3ipMFoHoE&list=PL7uw9vTkqQwp1s4oh6TRd8qm6StglCkUd Tropical Events (testing tropical namelist options) Irene - https://www.youtube.com/watch?v=GNhYYvrQrPc&t=252s Bob - https://www.youtube.com/watch?v=FmbhsaFaC4k&list=PL7uw9vTkqQwrX5nzMSy4qFQbTqU9WCqha&index=1 Gloria - https://www.youtube.com/watch?v=60wBgKfBrHg&list=PL7uw9vTkqQwrX5nzMSy4qFQbTqU9WCqha&index=3 Freezing Rain Events (testing p-type algorithm): Dec, 2008 - https://www.youtube.com/watch?v=sNkfVaudVZ8&list=PL7uw9vTkqQwrfqeW1diEdDmR_wGGvgjZC Does anyone have any suggestions for my next 10 simulations? I'm looking for unique events. I'd like to try Hurricane Carol (1954 - test the reliability of ERA20c prior to 1985) and the Blizzard of 2013 next. Dec. 9, 2005 is really interesting too. Before any recommendation(s), I can run simulations with reasonable accuracy from 1978+ (so far) w/ERA5 and ERA20c reanalysis data.
-
So about those armored millipedes/centipedes... Is there a way to get rid of or prevent them from entering my property? I'm finding them everywhere around my apartment. They creep me out. Something keeps eating my plants too . I had to move them inside.
-
Glad you guys enjoyed it! There were a couple things that stood out to me: 1) The visibility observations for the RI station near Providence... The station dropped to 1 mile visibility at ~1pm on Feb 6th, then down to ~0.1 miles visibility for ~12 hours afterwards lol. 2) Wind gust >70mph in Boston. This was plotted twice... These observations were taken +-5 minutes from the simulation time stamp. 3) Several hours of mix/rain from Providence to Boston. I don't believe this occurred. For the ERA20C dataset, I can run simulations from 1900 to the current day. Some datasets go back <1900, but they likely won't perform well. I plan on doing this weekly for different events in and outside of the US out of curiosity. We'll see how the older simulations pan out, but the 78' simulation evaluated relatively well.
-
Offer me some feedback, please! I ran WRF (+ some additional utilities) from 1978-02-04 to 1978-02-09 (for sh!ts and giggles) and created plots for two different grids (parent domain - d01 and 1 nested domain - d02). I added plots of temperature, wind speed, wind gusts, visibility, precipitation type, etc... and superimposed observations when applicable. The still images were looped to create a video and I added audio to, "set the mood." Since I ran a simulation on a historical blizzard, I figured the board would find it interesting. Admittedly, my video editing skills are poor...
-
Relative humidity to absolute humidity formula
MegaMike replied to SG4891's topic in Meteorology 101
This methodology looks reasonable: https://carnotcycle.wordpress.com/2012/08/04/how-to-convert-relative-humidity-to-absolute-humidity/ You won't even need to convert your temperature (C) or relative humidity (%)... Just plug n' chug. To get kg/m3 from g/m3, just multiple g/m3 by 1kg/1000g == 1/1000. -
I agree! It's a very good question. Now that it's been a few years, I'd rank it like this; FORTRAN, NCAR Command Language (NCL; which is no longer being updated), and Python. I develop script pretty often in NCL and Python for statistical and graphical reasons. FORTRAN's important because most, if not all, Numerical Weather Prediction programs are coded in FORTRAN. If anyone's curious, the code to run NWP (for the Weather Research and Forecast model specifically) looks like this: https://github.com/wrf-model/WRF/tree/master/phys - Select any .F file in that repository. For Python, the script will look like this: https://wrf-python.readthedocs.io/en/latest/plot.html (I mainly plot images with Python). NCL's pretty similar to this, but faster when working with .nc/.grb/etc... files though. In all honesty, if you learn one language, you obtain a basic understanding of them all.
-
No. Public websites keep snowfall calculations simple because 1) scripting Cobb's/Dube's algorithm is too computationally expensive 2) in the end, it doesn't matter which algorithm you utilize for forecasts or 3) they can't write the script. Besides what I wrote above regarding positive snow depth, 10:1 ratios is easier to compute: a) If they use a precipitation type algorithm (csnowsfc is boolean wrt snow-> 1==snow, 0==not snow): snowfall = csnowsfc*LWE*10. For snowfall, precipitation type algorithms perform well... Diagnosing mixed precipitation type is problematic though. Here's an article that provides results using "observed" data: https://journals.ametsoc.org/view/journals/apme/55/8/jamc-d-16-0044.1.xm. Go to Table 1. b) If they use microphysics scheme output (SR is continuous -> from 1==all frozen precipitation to 0==no frozen precipitation): SR*LWE*10. You occasionally see websites that state, "this product may include sleet..." They likely used this methodology since SR is a function of what a microphysics scheme diagnoses (mass/concentration of rain, ice, snow, etc...). If it diagnoses graupel, sleet, and hail, SR will include graupel, sleet, and hail as well. It depends on the microphysics scheme. Most modeling systems use Thompson's microphysics schemes which means rain, ice (sleet), snow, and graupel are included in SR. Websites should be more public about their methodologies. Some are vague as He!!. Another pet-peeve of mine, Pivotal provides Kuchera's algorithm for PAID members. Why? Nobody published a paper on its accuracy and I'm sure other SLR algorithms perform better.
-
That's a good question. The algorithm takes into account "gauge losses" due to melting, compaction, etc... caused by the land-air interface. If land isn't categorized by the model at a given grid point, 0/NaN values will be produced by the algorithm. That's why there are 0/NaN values along the coastline. The (very course) GFS categorizes those grid points/locations as "water." The website post-processes those maps from the GFS by, snowfall(t)=abs(snow_depth(t)-snow_depth(t-1))+snowfall(t-1) - t==time. snow_depth is calculated within the model though. For the coding/scripting weenies: https://github.com/wrf-model/WRF/blob/f311cd5e136631ebf3ebaa02b4b7be3816ed171f/phys/module_sf_noah_seaice.F [via WRF] - search for "SNOWH." I'm assuming the GFS uses the same subroutine. For the non coding/scripting weenies: https://www.wcc.nrcs.usda.gov/ftpref/wntsc/H&H/snow/AndersonSnow17.pdf - The "new snowfall" calculation is denoted by equations 2.a though 3... It's different than what most people are accustomed to on this site. It calculates snowfall by diagnosing snow density.
-
Thanks for the feedback, everyone! Today is NC + 2 for me. I'm still getting everything setup (furniture/internet), but I'm beginning to get a sense of the area. I live in a nice community surrounded by Massachusetts' equivalent of Route 1 on steroids (15/501). The only sketchy area I've seen so far is along 15/501 near Walmart, otherwise, not bad! Obviously, NC has a much different feel... Even the dirt looks different than in NE (more clay?).
-
I'm not too big into the NHL. I rank major league sports as; NFL>>>MLB~NHL>>NBA>MLS. The Pat's are my favorite team followed by the Red Sox, Bruins, then the Celtics. I mostly watch the B's and the C's during the playoffs with the occasional regular season game. Fun fact: the first Pat's game I remember is the AFC div. game vs. the Raiders. I have no memory of the Pat's having a losing record... Super impressive! Noted. I won't stick any of my appendages inside any dark, empty void I plan on moving back to MA after a year of work for the EPA. They want me to get the "EPA experience." After that, I can work remotely from anywhere I'd like. My time in NC will be ironic. I got my degree in atmospheric science because I love winter weather. My most fond memories involve snowstorms. To name one, during the blizzard of 05' (Jan 22-24), I remember seeing cars slowly becoming engulfed by snow w/near hurricane force wind. For nearly 12 hours, I remember pure whiteout conditions. When the event ended, I remember going outside and thinking to myself, "I feel like I'm on Hoth." In some places, the snow was taller than I. To this day, nothing compares... Oh! I was ~14 at the time so I was probably 4' 6'' or something like that... So nostalgic! I created snowfall maps for fun. You can view them here (only for the NE US) if you'd like: https://github.com/msw17002/Historical-Precipitation-Analysis/tree/main/Northeast_Snowfall Some new terminology here: Palmetto bugs and noseeums. The worse I run into are horseflies. They're super annoying! I was never bitten by one thankfully. So Magpie meant casual waving! I thought he meant something different lol. Thanks for clarifying that! I look forward to any winter or severe weather event! I'm severe weather deprived... I usually get nothing significant (severe) where I live now. The accents will be fun! I always like listening to different dialects. Oh, the anticipation!
-
This is great! My mother lived in SC for a few years and her fear of the local wildlife transcended onto me. I exaggerated a little bit for a laugh, but there's sincerity with what I wrote. From what I read online (probably not be reliable), spiders like the Brown Recluse and Black Widow are relatively common throughout NC. I presume this isn't entirely true or nothing to be worried about? I'm looking forward to experiencing the culture change! I imagine there's a pretty big difference b/n people from the NE and the SE in general. The only problem I foresee is that I don't barbecue and I don't watch college sports
-
Good to know! I'm mainly worried about spiders navigating their way into my apartment then biting my hand off (joking). That's my greatest fear. COVID might be on that list too since it'll be difficult to acclimate to an area that's partially shutdown. I'll be working with ORAU as private contactor for the EPA so basically graduate school all over again. I have a 6 month lease at the Reserve at Patterson Place in Durham. Their fitness center sold me on their complex. Would you suggest getting anything like a dehumidifier?
-
Hey guys, I'm moving to Durham, NC in several days and I wanted to ask, how should I prepare myself ? I lived in New England my entire life (MA->VT->CT->MA) and I'm mainly worried about insects/snakes. To be clear, I'm not worried about the weather...
-
Active mid December with multiple event potential
MegaMike replied to Typhoon Tip's topic in New England
Pivotal doesn't do any weighting. Snowfall is readily available by the NBM itself. I wrote about it a while ago, but the NBM's (which is an ensemble) details can be viewed here: < https://www.meted.ucar.edu/winter/nbm32winter/ > You'll need to register first though. At this range, I'd recommend using it. It begins losing its advantages as the event begins to develop and a consensus becomes strong. -
Active mid December with multiple event potential
MegaMike replied to Typhoon Tip's topic in New England
Different plotting scheme... Pivotal defined their bins from -60 to +120 w/increments of 1 (approximating here) so 180 different bins in total. StormVista defined their bins from -40 to +120 w/increments of 5 (32 total bins). Since Pivotal plots their images with more bins, it appears finer than StormVista's plots. Assuming that both brands are plotting the same model without interpolating, there should be no difference. -
Good call (assuming it's a dam). I had to find the point manually, but it led me to the following metadata regarding that station: GHCND_IDENTIFIER, LAT, LON, ELEVATION_m, STATE, STATION_NAME USC00173588 45.4586 -69.8653 253.0 ME HARRIS STN If you're curious, that location observed 60 inches of snowfall for the denoted time range. The maximum for this event occurred at Pinkham Notch in New Hampshire. I might remove it from the map since it's pretty absurd or too wildly epic. The station observed 108 inches of snowfall which is 38 more than any other station lol. It was an "outlier," but based on the location, I kept it.
-
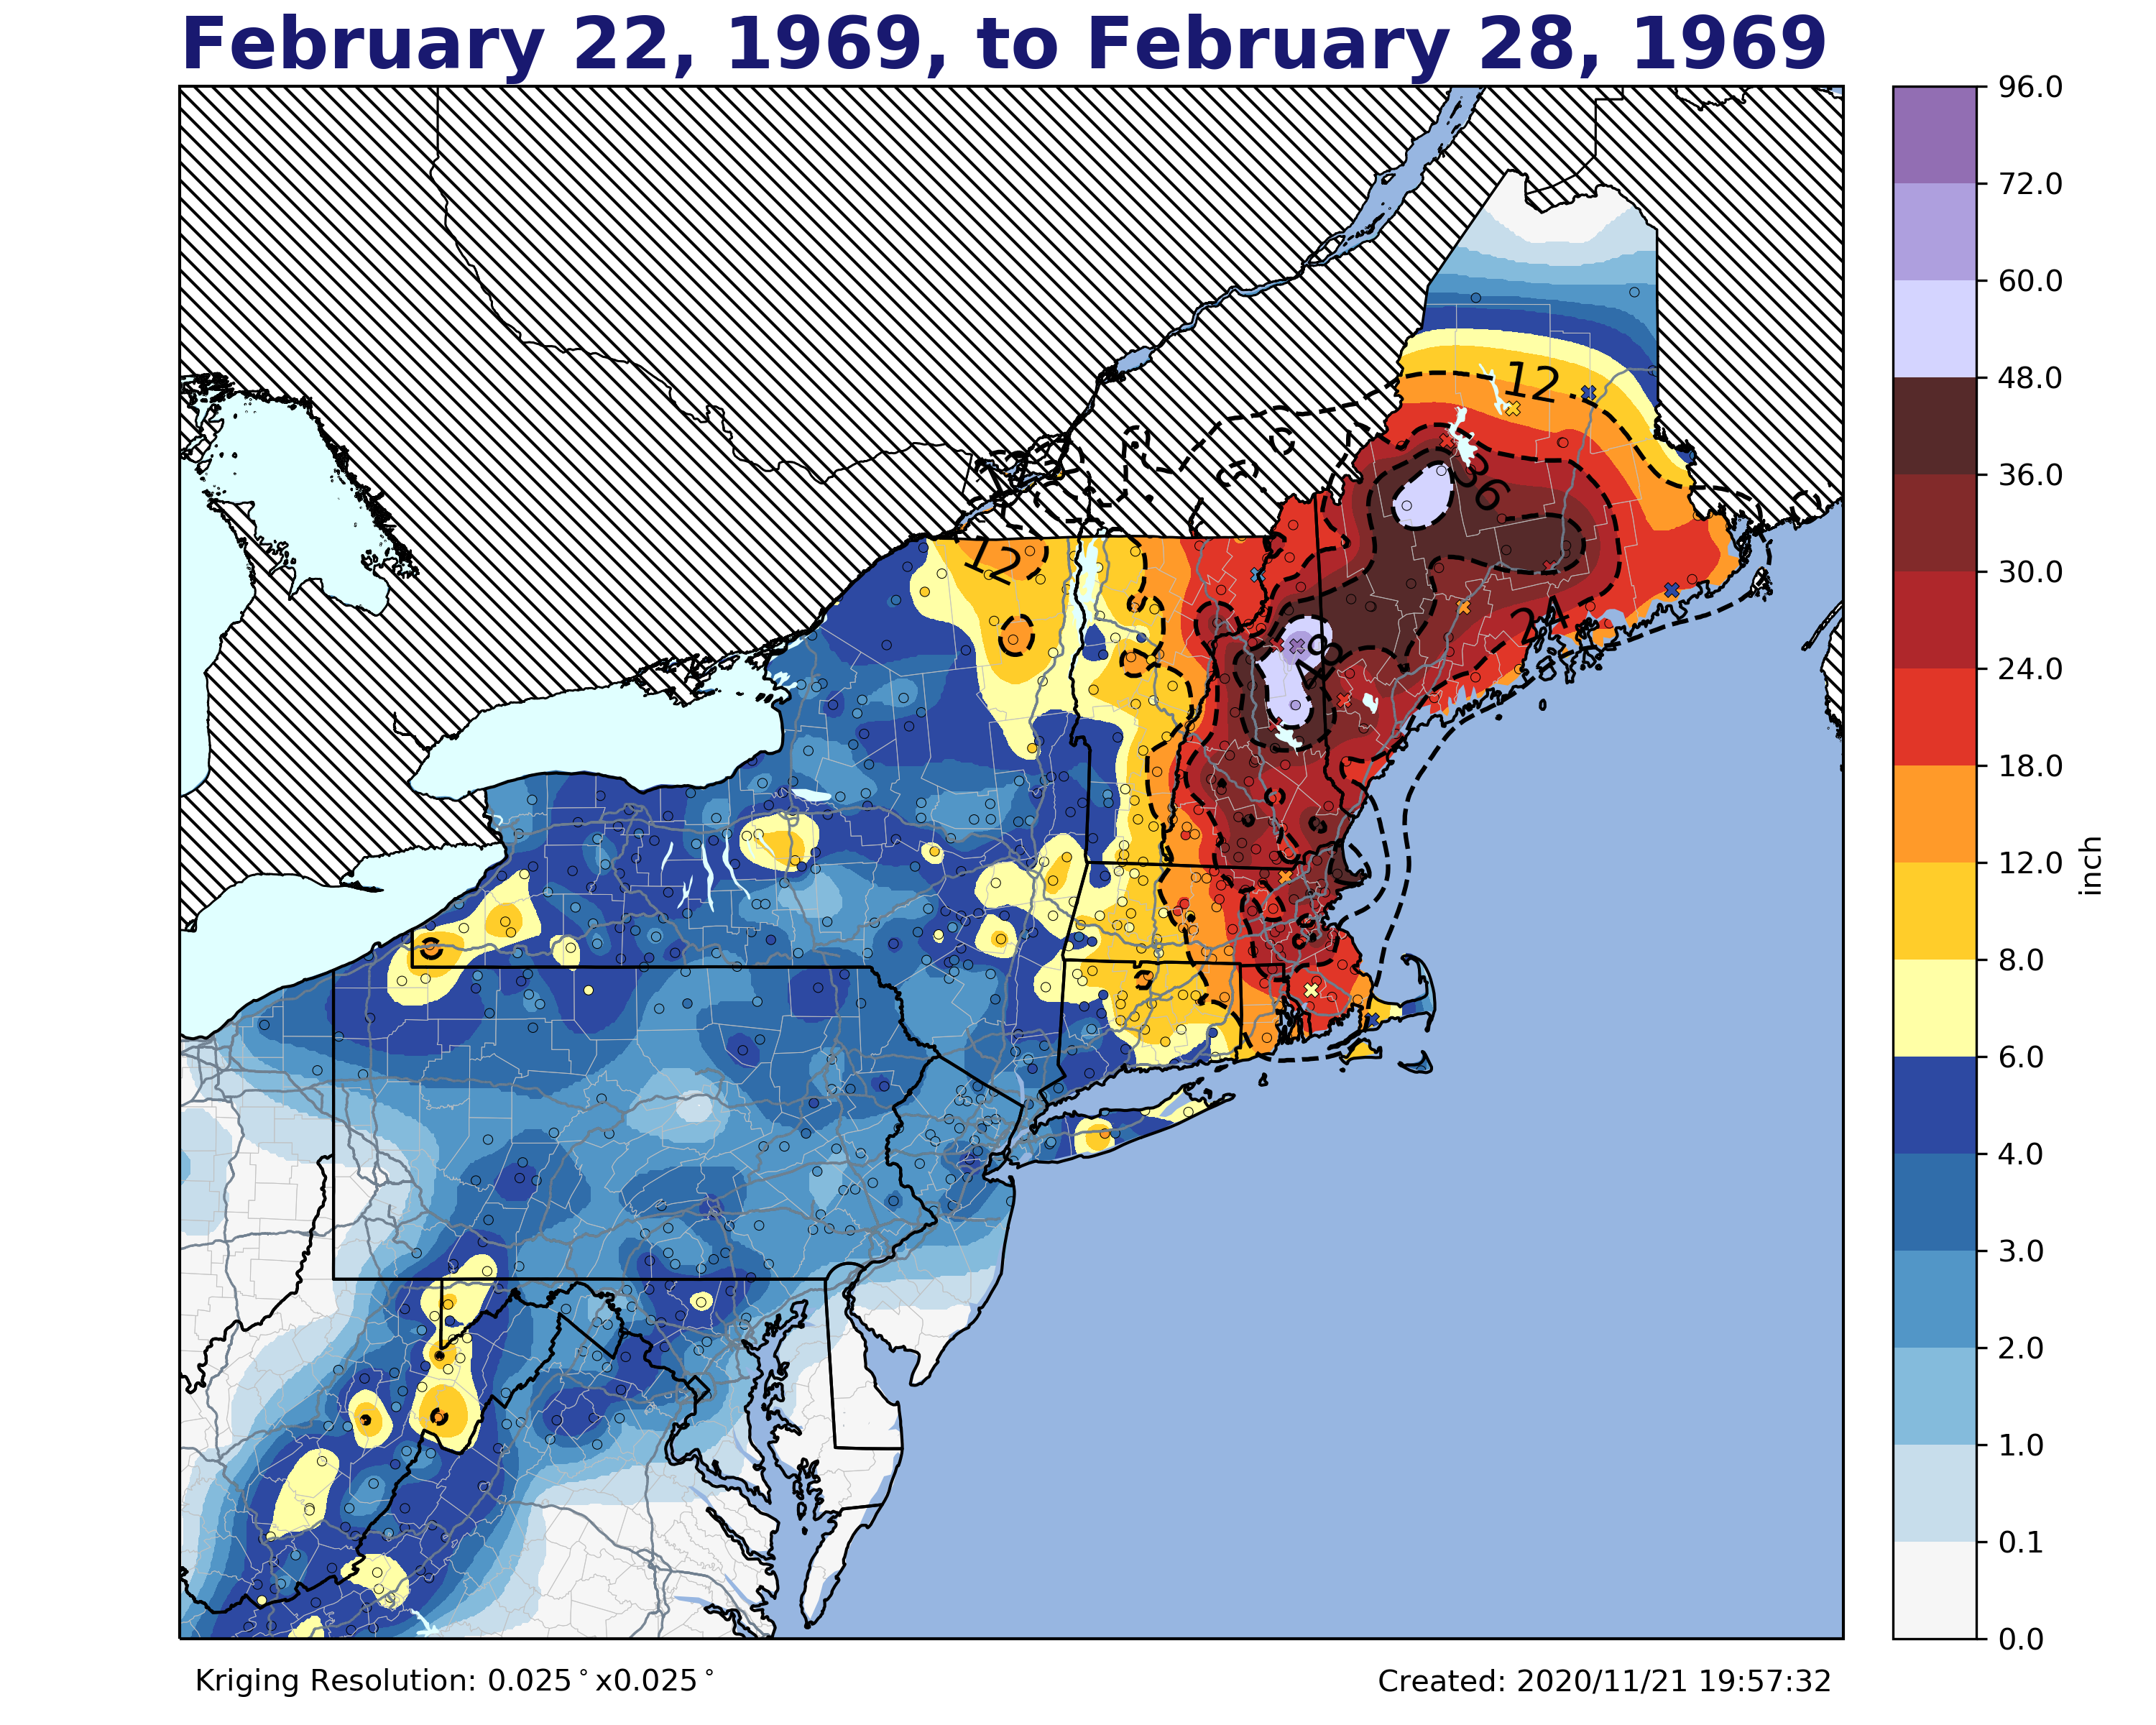
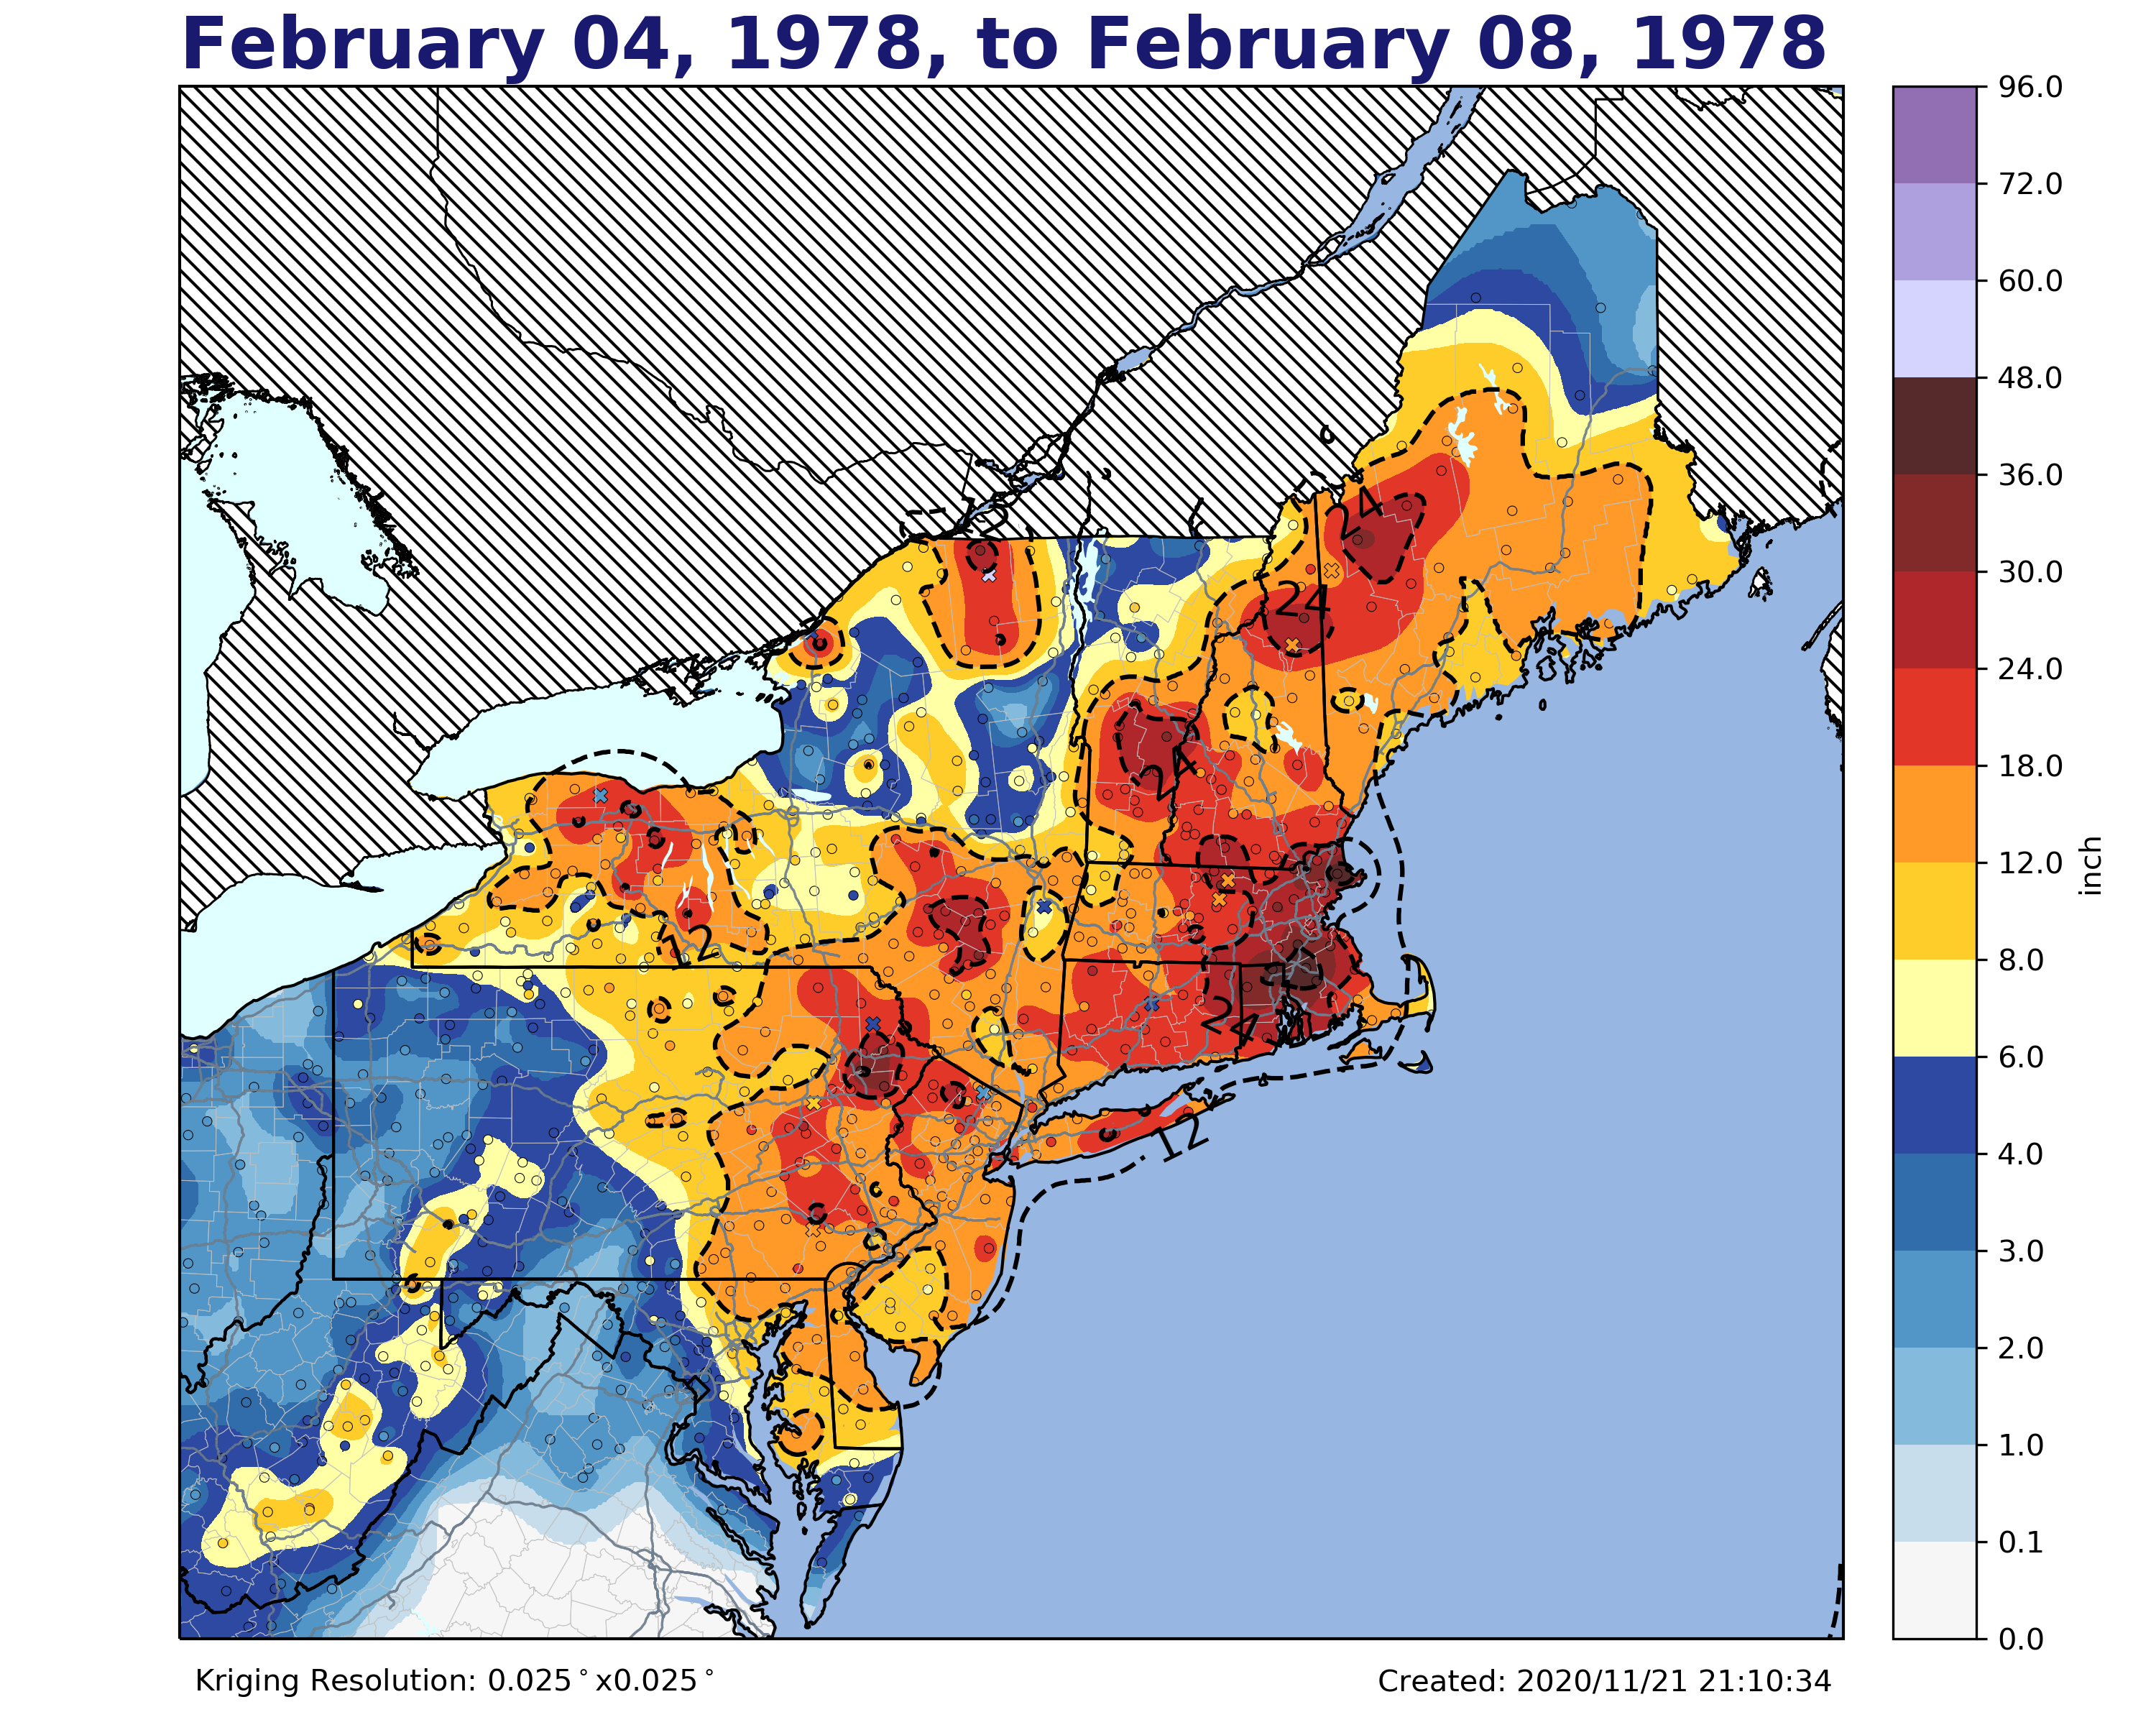
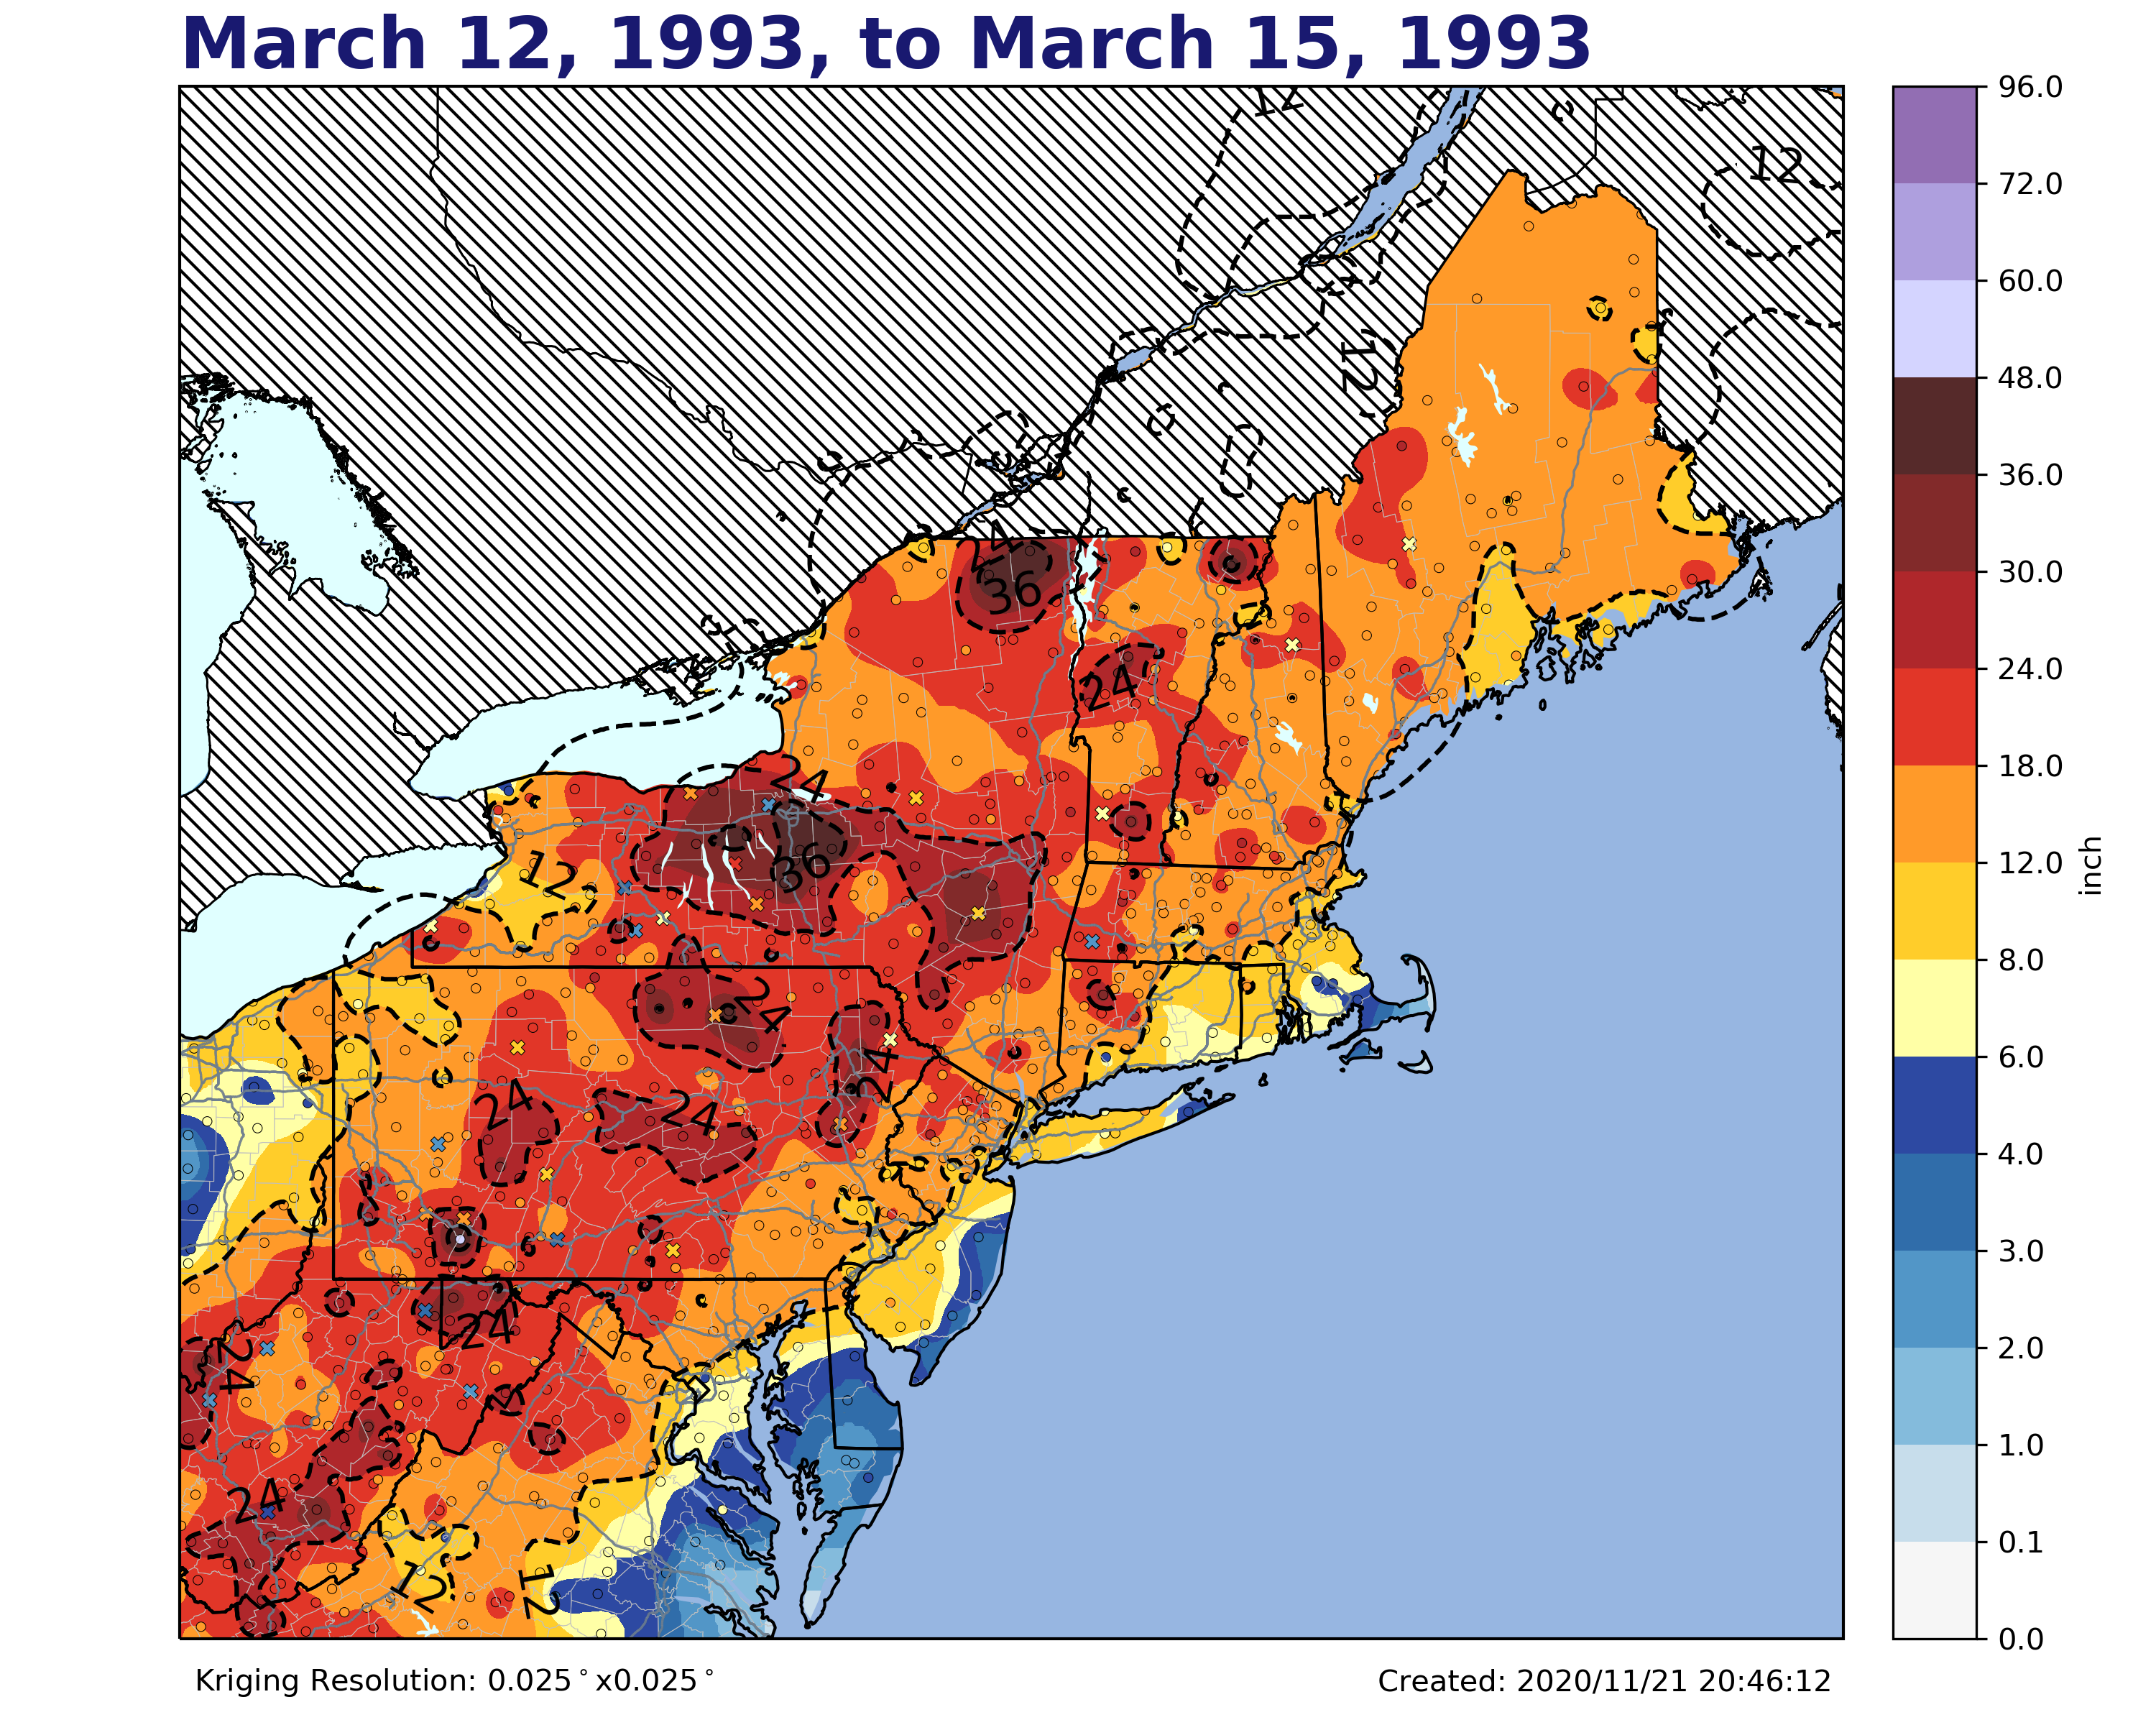
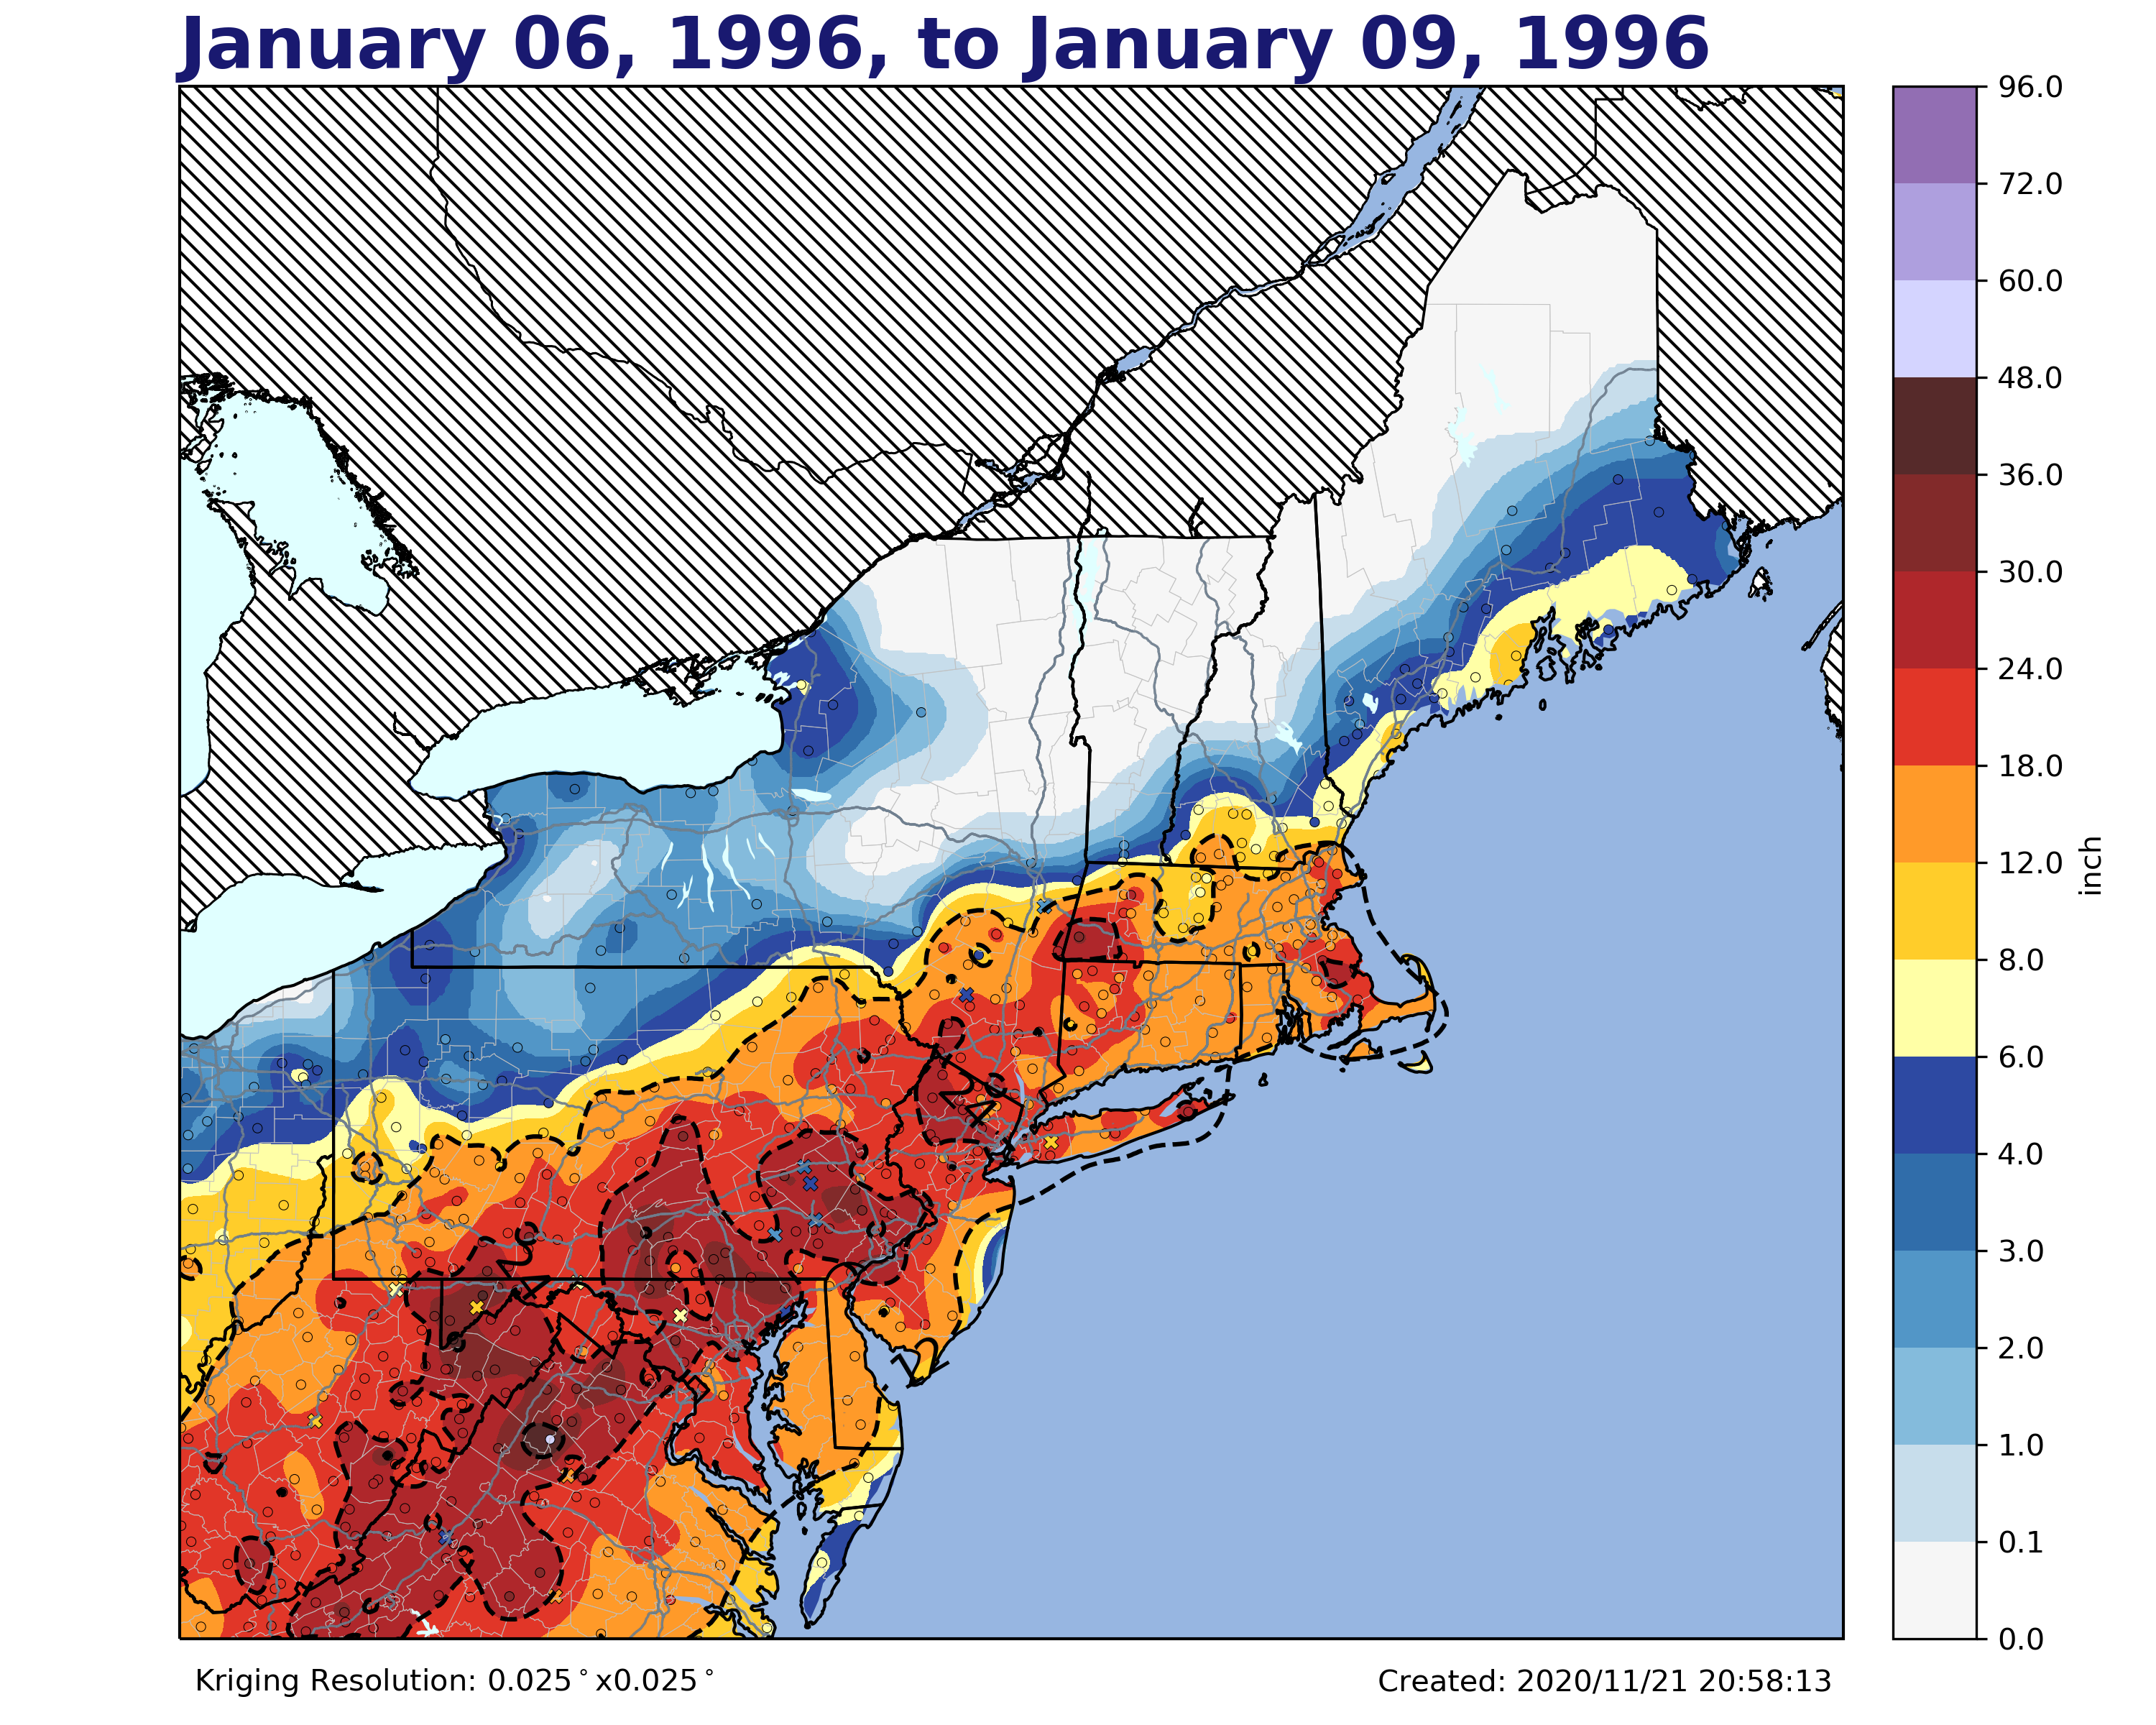
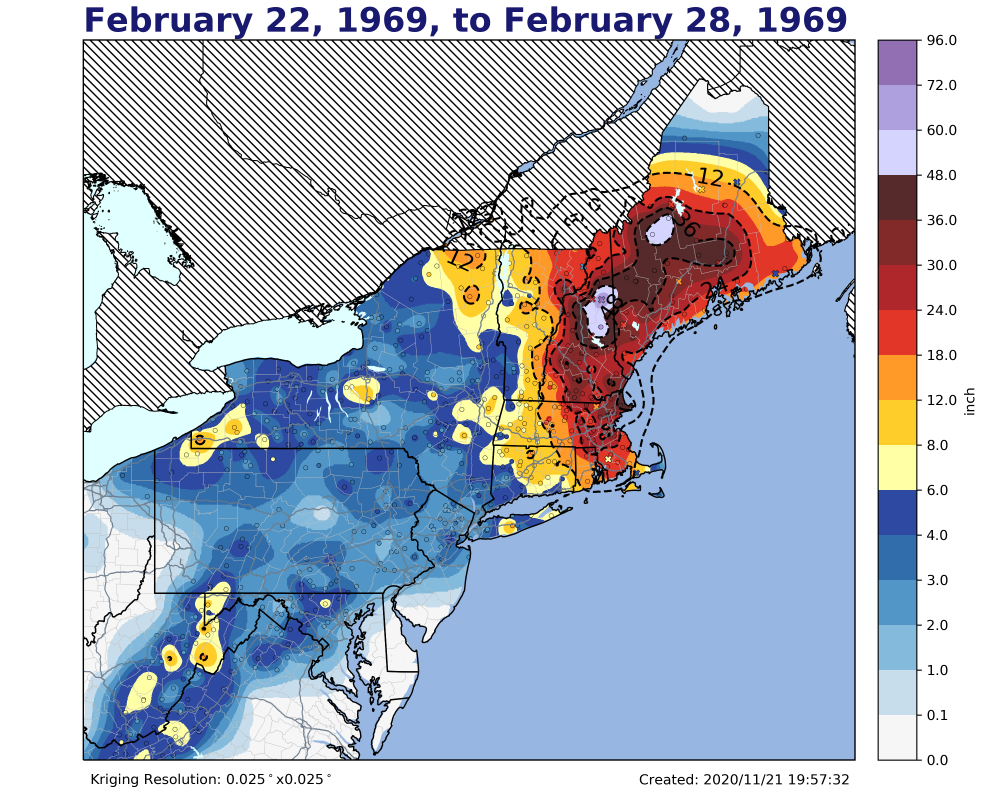
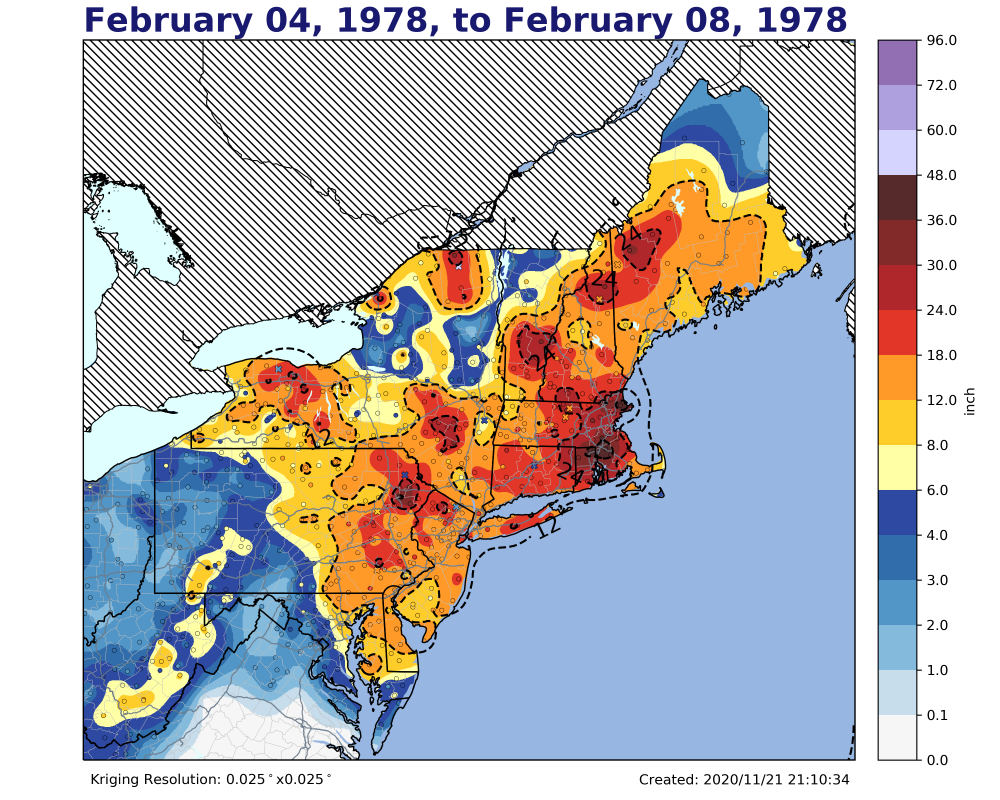
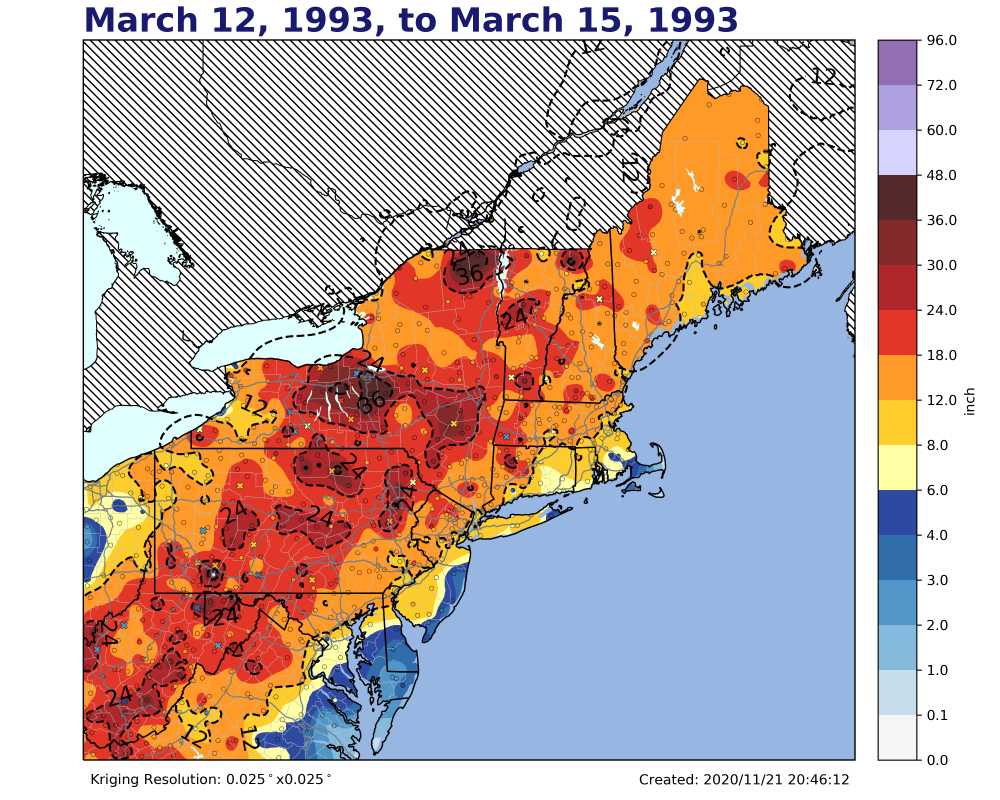
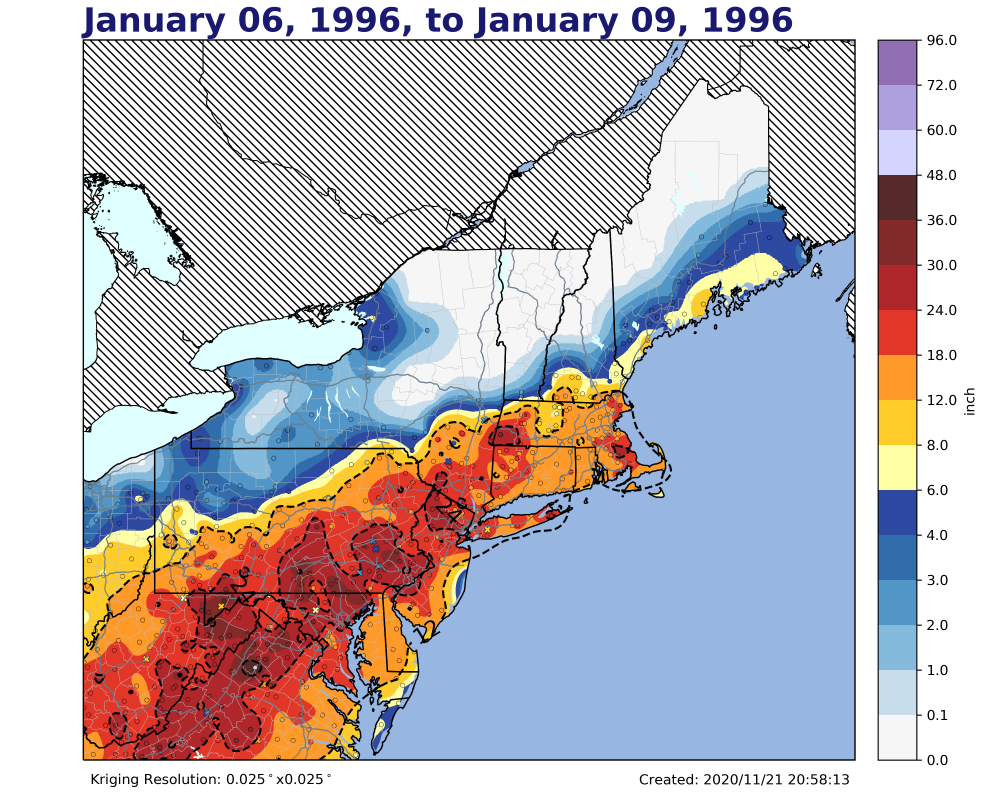
Good to hear! I ran the interpolation for all events listed here < https://www.ncdc.noaa.gov/snow-and-ice/rsi/societal-impacts > for the NE US. So there are 211 in total. I'm iterating from highest to smallest RSI (the sum of area/population impacted by climatological snowfall thresholds). At the moment, I have 19930312_19930315, 19960106_19960109, 19780204_19780208, and 19690222_19690228. I'm hoping I'll get some feedback for the interpolations (such as additional observations or ideas... The 4 Seasons!!!). I fully expect to redo some of these images to make them more accurate for my ultimate analysis. I'm surprised how detailed the GHCND archive is though. There's plenty of observations since 1900 for our area. Northwest Maine was the only exception so I had to be creative for that region. I could look at other historical events too. I just need the start and end dates (even dating back to 1900). Here are the final images I'll post until the other images process and I decide where to put them.
-
Great! Thanks, Will! dendrite, you can PM me.
-
Thanks! I tried to superimpose the observations onto the map, but it caused too much clutter. It was impossible to view numeric observations clearly. That's why I chose to use a color scale for the symbology instead. I can add the text, but I'd have to focus on smaller territories as you mention. Is there a place I can store these plots somewhere in the forum (maybe a new thread)? I have 208 other plots I'd like to upload once the script finishes.
-
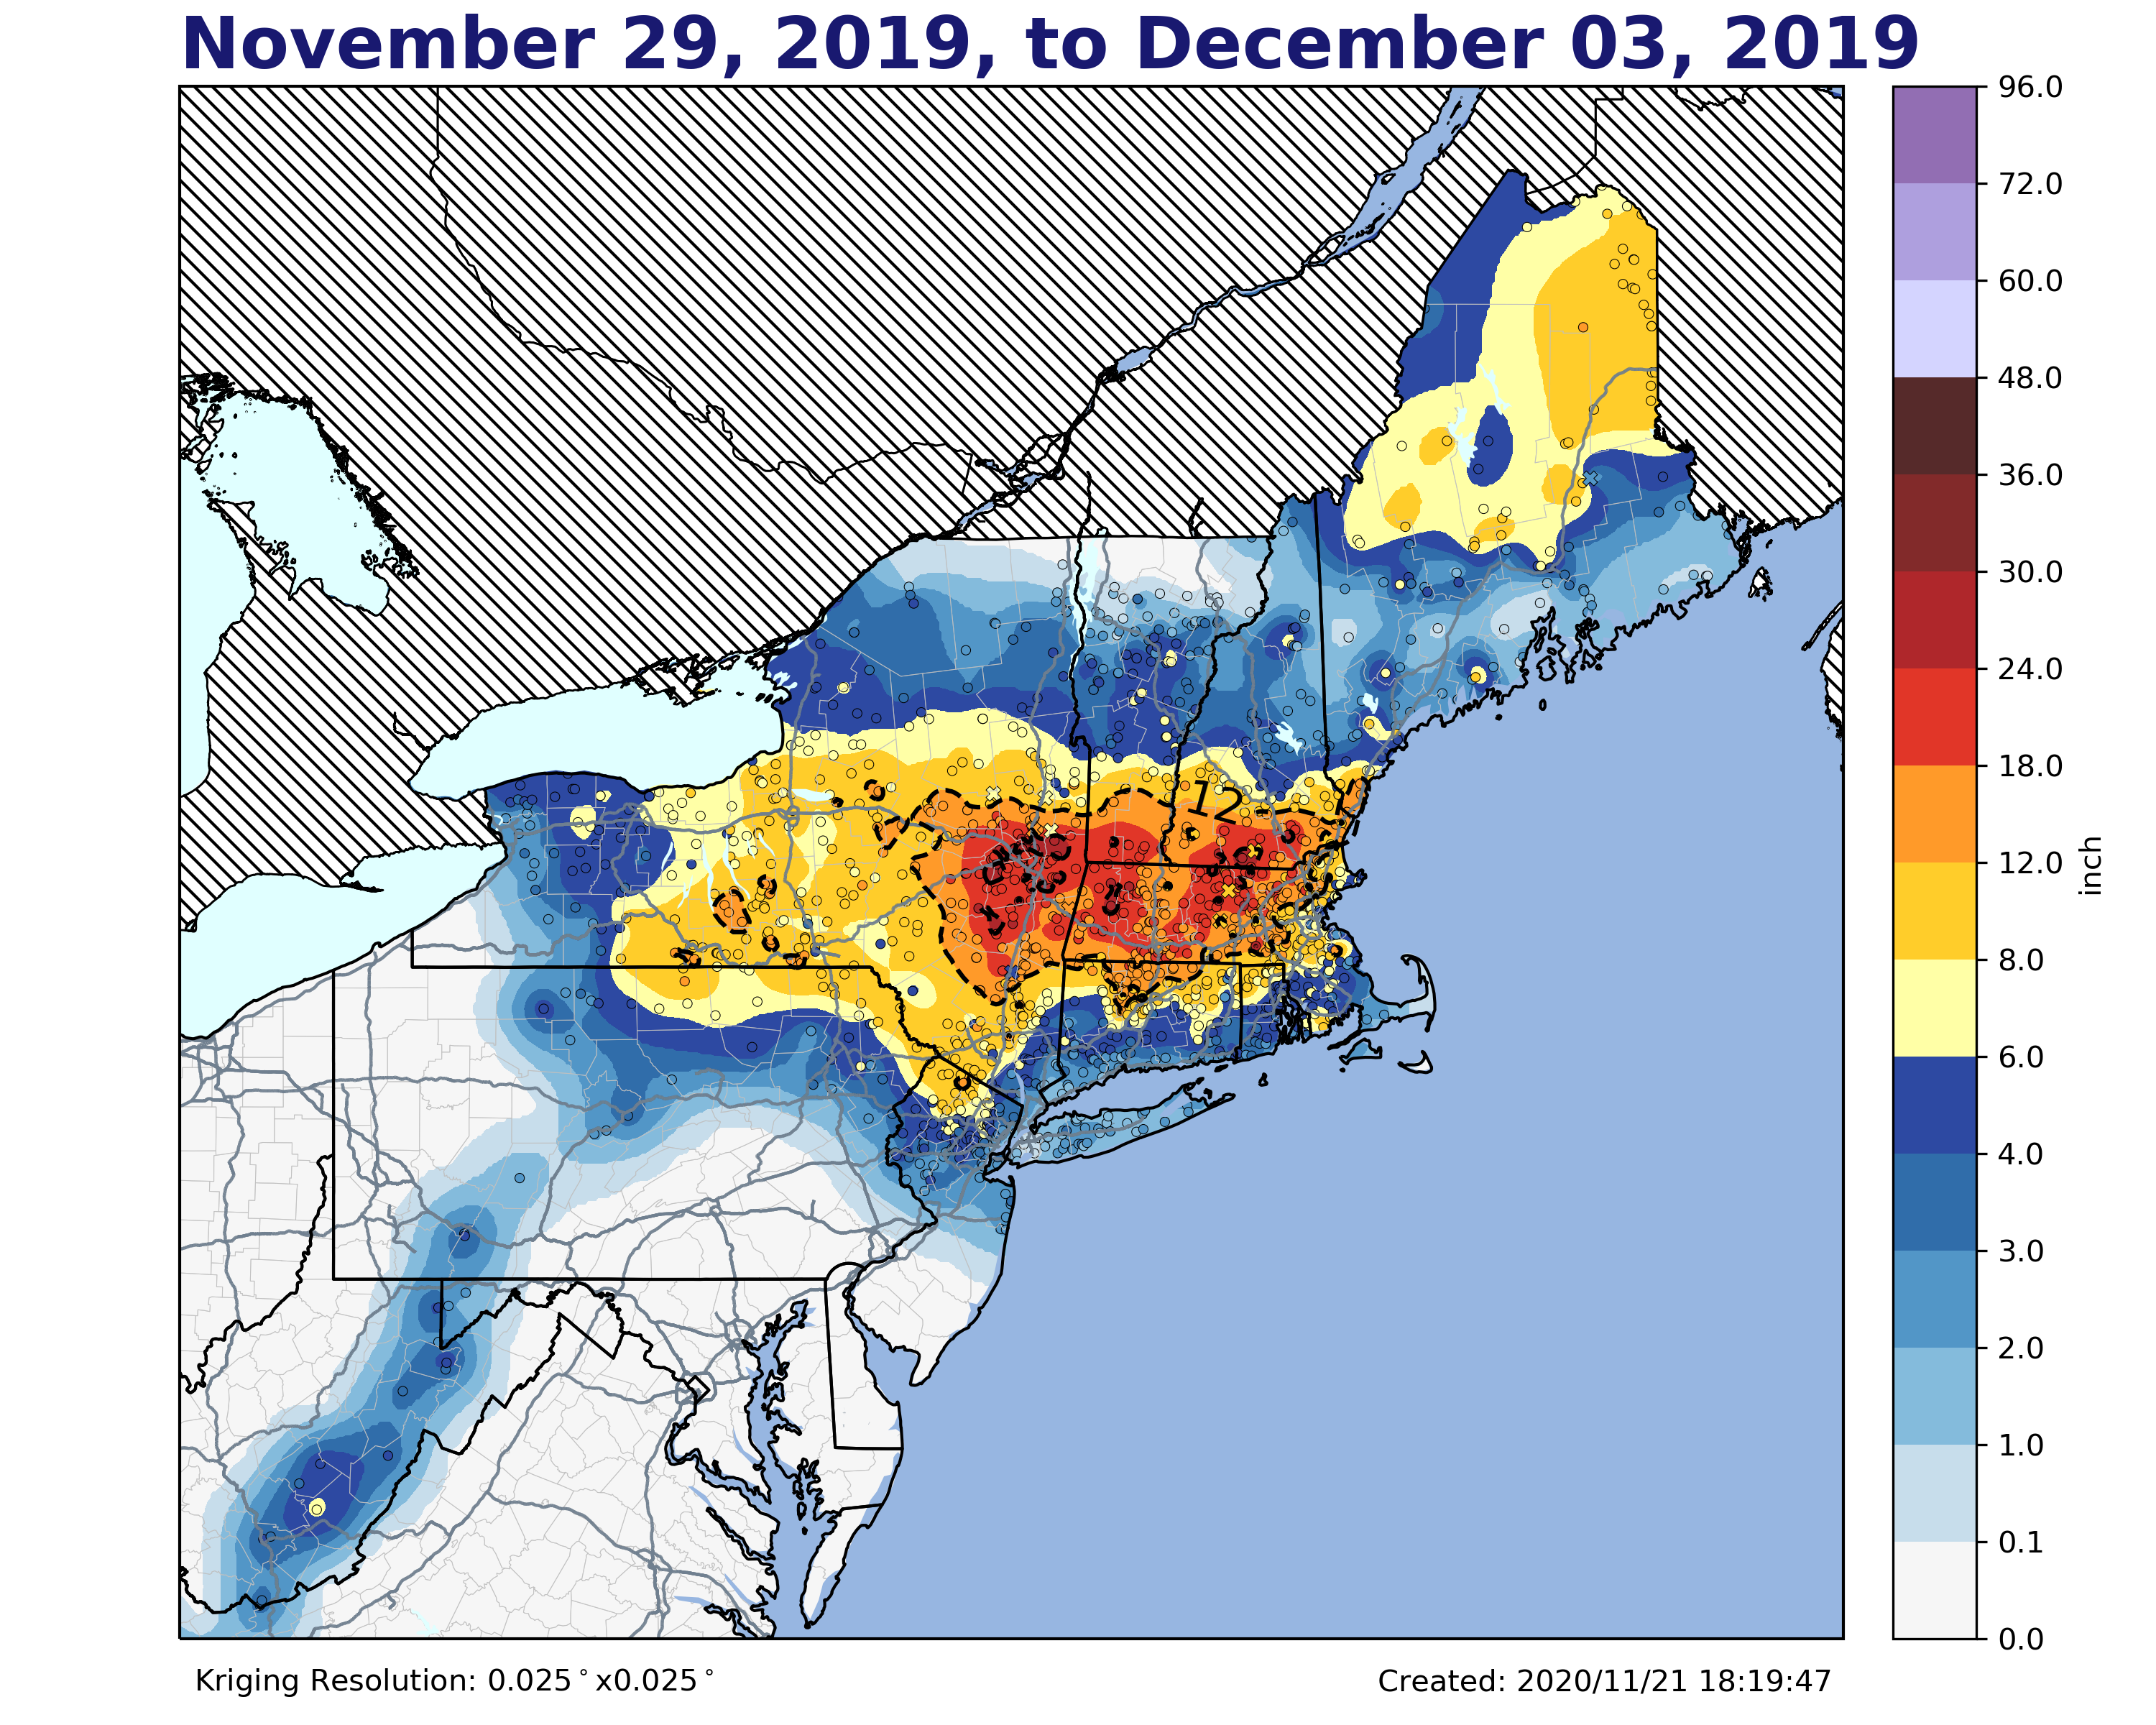
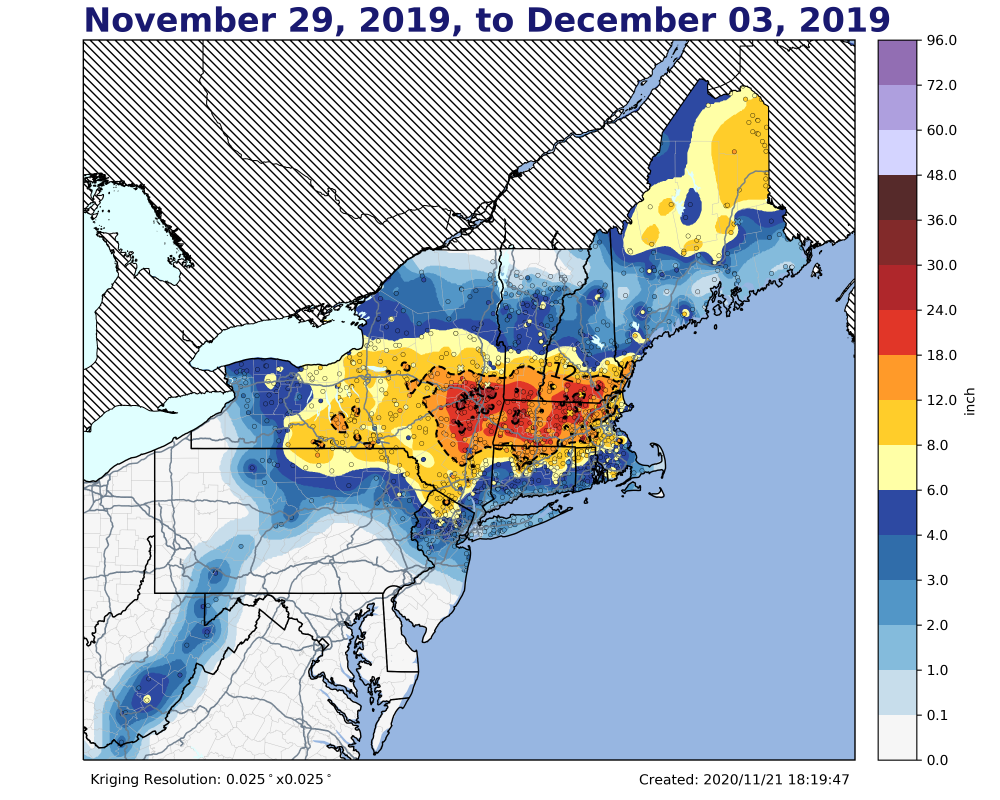
Hey guys, I wanted to ask, would you change the formatting of the attached snowfall () map? If there's anything that you'd add, remove, or edit, please let me know. I'm prepared to batch over 200 other snowfall interpolations (1900-now) that I created using GHCND/PNS observations and Python's PyKrige library (https://pypi.org/project/PyKrige/). I'd like to keep a gridded historical archive for other purposes as well. For example, I'd like to 1) create plots for the number of occurrences of 4+,10+,etc... events (on a 0.025x0.025 degree grid) ...and... 2) determine the maximum snowfall amount and index the event for all locations (on a 0.025x0.025 degree grid) This isn't work that I plan on publishing since there are other agencies with similar and likely, more accurate plots (NWS offices, https://www.nohrsc.noaa.gov/snowfall_v2/, and https://www.ncdc.noaa.gov/snow-and-ice/rsi/nesis). I created these interpolations to conduct an analysis on a constant grid. I'll admit, I did it for fun too! I may also create a large poster of all plots altogether . Anyways, I decided not to plot the legend. The plot's elements are: shaded circles: GHCND/PNS (I added PNS observations when/where applicable) observations. shaded crosses: GHCND/PNS observations that were determined to be spatial outliers... I found outliers using a methodology similar to this one < https://pro.arcgis.com/en/pro-app/tool-reference/spatial-statistics/h-how-cluster-and-outlier-analysis-anselin-local-m.htm > using a 50km search radius, IDW weights to the 2nd power, and z-scores of -1.280 and 4 (assuming a normal distribution). shaded: Kriging interpolation onto a 0.025x0.025 degree grid light blue shade: Lakes (from https://scitools.org.uk/cartopy/docs/v0.14/matplotlib/feature_interface.html) dark blue shade: Atlantic (from https://scitools.org.uk/cartopy/docs/v0.14/matplotlib/feature_interface.html) gray segments: Interstates I also added shapefiles for Canada's provinces, USA's states, and USA's counties. Ideally, the observations should match the color of the shaded interpolation.
-
I really like your graphics, The 4 Seasons! Are your interpolations done manually? Also, what program/software do you utilize to create your graphics? Some recommendations/suggestions (in case you erased your inbox): If you're looking for pre-1993 observations, try getting your data via the Global Historical Climatologist Network (GHCN). You can get snowfall totals (and what not) from 1973-today (for in-situ/surface stations). If you want snowfall totals for specific events, you'll have to sum daily snowfall accumulations for 't' # of days and for 'n' # of stations. Conveniently, the data is quality checked! Here's the URL: ftp://ftp.ncdc.noaa.gov/pub/data/ghcn/daily/ Personally, I like working with the yearly ('by_year') .csv files. Last thing, if you're using crowd sourced data, I'd recommend processing the data through a spatial outlier test. The "Local Anselin Moran's" algorithm can be used to scientifically eliminate suspect/faulty observations. Michael Squires (created the Regional Snowfall Index scale =~ NESIS ) used this method for his research. Algorithm details: https://pro.arcgis.com/en/pro-app/tool-reference/spatial-statistics/h-how-cluster-and-outlier-analysis-anselin-local-m.htm If you're interested, I wrote script for Moran's algorithm utilizing Python.
-
Mainly FORTRAN (great program for running numerical computations) on a Linux OS. When it comes to post-processing data; NCL, REVU, MATLAB, and or PYTHON.
-
Hello,
Please read my comment that I posted to your 'stock market' related thread!

-
March 12/13/14 Blizzard/Winter Storm/WWA etc
MegaMike replied to Bostonseminole's topic in New England
Meh. They were in between bands for most of the event. I don't think they ever got into the mega band, either (by a few miles). I'm glad I'm in RI for this event instead! -
March 12/13/14 Blizzard/Winter Storm/WWA etc
MegaMike replied to Bostonseminole's topic in New England
There are three observations of 8+ inches of snow already. North Dighton, MA (8.2/9:38am), Acushnet, MA (8.0/9:45am), and Burrillville, RI (8.0/9:12am). It seems like most of interior SE MA and RI have snowfall accumulations between 4-8 inches atm.