bluewave
-
Posts
36,955 -
Joined
-
Last visited
4 Followers


About bluewave

- Currently Viewing Topic: August 2026
Recent Profile Visitors
.thumb.png.3513c28619bf91f0fa8e4004956c33df.png)


-
2026-2027 Super El Nino
bluewave replied to Stormchaserchuck1's topic in Weather Forecasting and Discussion
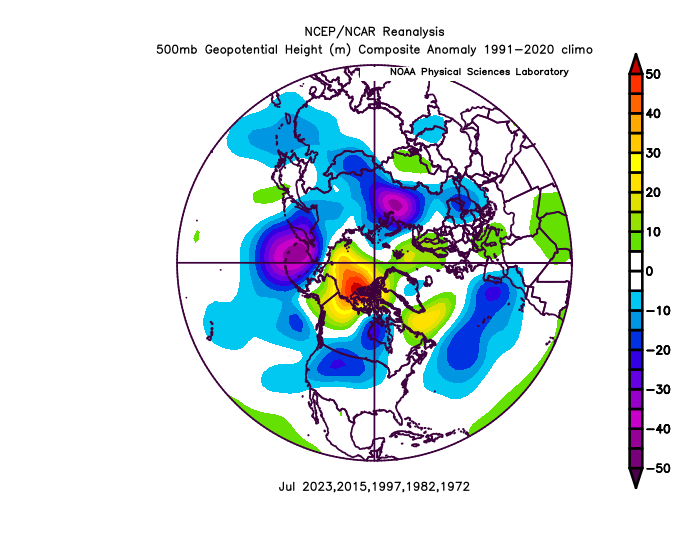
It just came out. One of the strongest July CGT patterns on record. This was the opposite of what we have had with past developing super El Niños. The strong ridge north of Hawaii lead to the big warming there and the steep -PDO drop. Seasonal model runs from May completely missed this pattern. So the main question now is what caused such a strong disconnect between the El Niño tropical forcing and the mid-latitude pattern? While most 2020s years have seen the -PDO peak during the summer and move more toward neutral in the winter, even a lingering 10% to 20% atmospheric -PDO state into the winter would be a first for such a strong east based event. My guess is that if this were to have some influence into next winter, it would probably lead to some type of shift in the state of the Aleutian low complex relative to 1997-1998. Not really expecting the seasonal models to be of much help here. While we know that all past super El Niño events have featured warmer winters in the East, the details of where the strongest ridge axis sets up will provide the finer details. A strong +PDO atmospheric east based super event like 1997-1998 was very warm. This event is even stronger and starting out with more of a -PDO atmospheric state than other developing super El Niños. So we’ll have to monitor if the ridge axis remains further south or east than past super El Niños. But even a traditional super El Niño ridge axis south of Hudson Bay is warm on its own. https://link.springer.com/article/10.1007/s00382-021-05825-6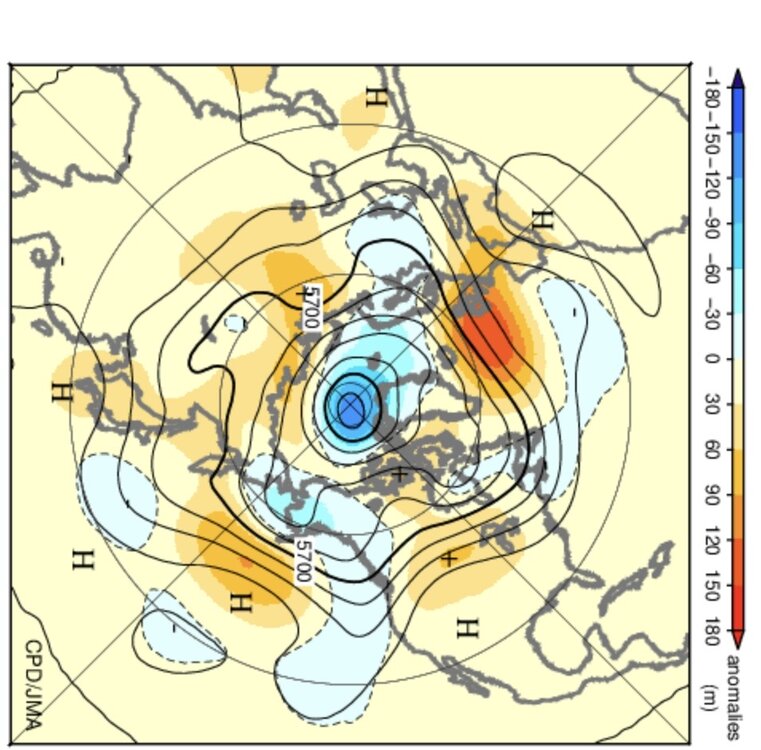
-
2026-2027 Super El Nino
bluewave replied to Stormchaserchuck1's topic in Weather Forecasting and Discussion
NASA GISS uses 1951-1980 for its departures with Canada going with 1961-1990. Berkeley Earth uses the 1850-1900 period along with Copernicus and the Met Office. 1951-1980 was the last relatively stable temperature regime before emissions and temperatures really took off. So using warmer 1991-2020 climate normals masks the warming relative to the past. https://science.nasa.gov/earth/earth-observatory/world-of-change/global-temperatures/ The NASA GISS team chose the period of 1951-1980 as its baseline largely because the U.S. National Weather Service uses a three-decade period to define “normal” or average temperature. The GISS temperature analysis effort also began around 1980, so the most recent 30-year period was 1951-1980. Their objective is to provide an estimate of temperature change that could be compared with predictions of global climate change in response to atmospheric carbon dioxide, aerosols, and changes in solar activity. https://www.canada.ca/en/environment-climate-change/services/climate-change/science-research-data/climate-trends-variability/trends-variations.html Much of Canadian economic and social activity is climate dependent. Understanding how Canada’s climate is changing, in the context of global climate change, is important for developing adaptive responses. The Climate Trends and Variations Bulletin (CTVB) helps communicate to Canadians how Canada's climate has changed over the recent past and longer, over the period for which Environment Canada has climate observations. The CTVB describes climate variability through maps of current and past departures from the mean (the 30-year average 1961-1990) temperature and precipitation conditions, both seasonally and annually. This approach provides visualization of the extent to which temperature and precipitation vary above and below longer term average conditions. Maps are presented for each season and year. The data are then analyzed to see if there are detectable trends of longer terms against this backdrop of climate variability for Canada as a whole, and for 11 climate regions. This information is presented as graphs with trend lines to assess climate change over the period of record, starting in 1948 when nation-wide records became available. Winter National Temperature Departures and Long-term Trend, 1948–2025 -
2026-2027 Super El Nino
bluewave replied to Stormchaserchuck1's topic in Weather Forecasting and Discussion
I am not sure there is need strong disagreement between us since the climate period keeps updating every 10 years. So each super El Niño at the time was based on the most recent prior 30 year period ending at the start of each new decade. I just checked the 30 year climatology from 1941-1970 in NYC and it didn’t change during 1961-1990 for the winters. Ultimately, it’s the rankings based on the entire climatology period which are the closest to reality. They probably should just have left the departures fixed at 1951-1980 which was our last stable temperature period before the warming accelerated. But since model forecasts use departures based on 1991-2020 this decade, we use them. I include rankings as often as possible since updating every 10 years in a rapidly warming climate masks the increase by normalizing the new much higher temperatures. So an average temperature month during the 2020s would have been would have been a warm month based on older more fixed climatology. -
2026-2027 Super El Nino
bluewave replied to Stormchaserchuck1's topic in Weather Forecasting and Discussion
The climatology period for the 1997-1998 super El Nino was 1961-1990. They don’t have 1941-1970 climatology maps on that site for 1972-1973. There also isn’t an 1951-1980 option for 1982-1983. So I used the closest time period that they offered at the site. -
2026-2027 Super El Nino
bluewave replied to Stormchaserchuck1's topic in Weather Forecasting and Discussion
Yeah, there weren’t any cold winters in the East with super El Niños relative to the climatology at the time. -
2026-2027 Super El Nino
bluewave replied to Stormchaserchuck1's topic in Weather Forecasting and Discussion
-
2026-2027 Super El Nino
bluewave replied to Stormchaserchuck1's topic in Weather Forecasting and Discussion
-
2026-2027 Super El Nino
bluewave replied to Stormchaserchuck1's topic in Weather Forecasting and Discussion
You posted recently how you don’t care about the weather patterns beyond your own local area. This isn’t a cheap shot since I am simply pointing out your stated stance. You are the main person in this thread taking cheap shots at others. -
2026-2027 Super El Nino
bluewave replied to Stormchaserchuck1's topic in Weather Forecasting and Discussion
Perhaps you lack understanding of my posts and the weather patterns in general is related to your stated disinterest beyond your backyard. Maybe if you broaden out your horizons a bit to encompass the greater climate system your frustration will begin to decline. I know you like the CanSIPS since you post it all the time. So you get triggered when people point out that it’s not a very good model. -
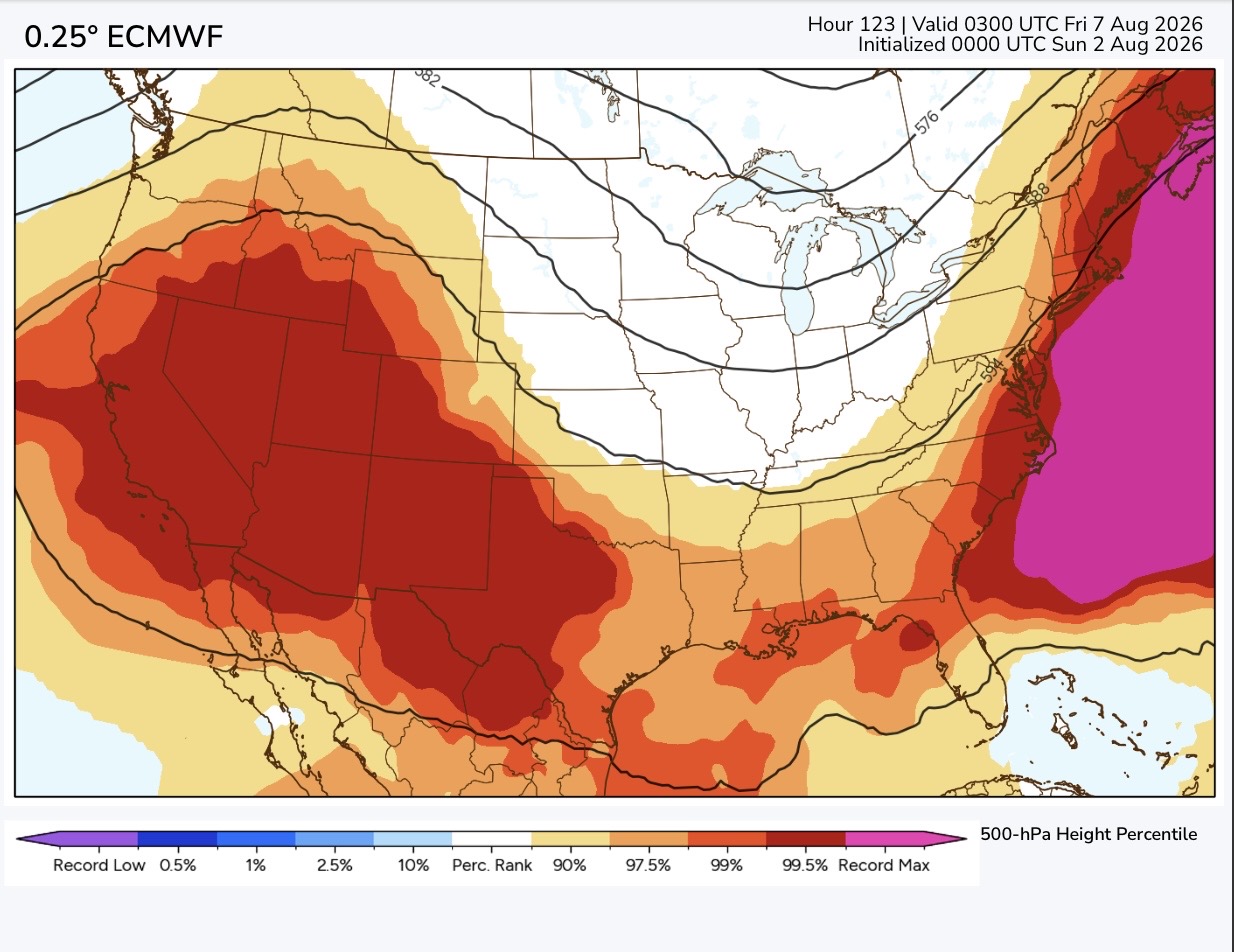
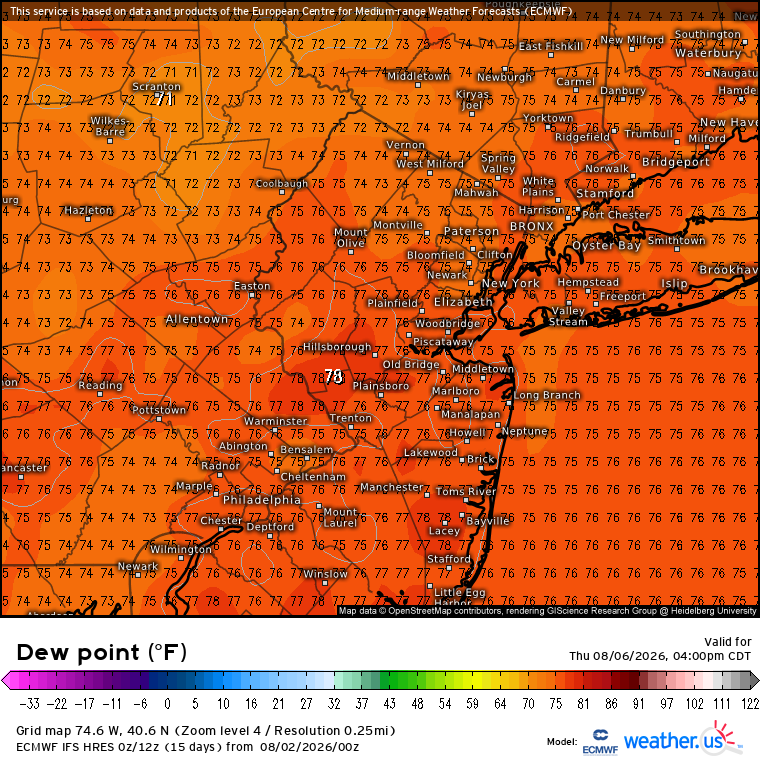
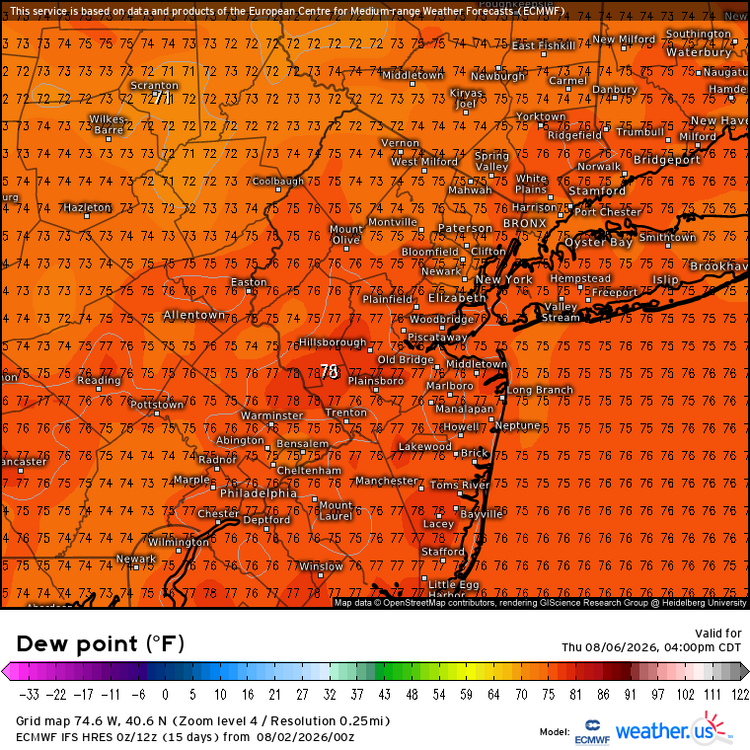
Looks like we could see a record ridge approaching 600 DM to our east by later this week. So probably more 90° potential. Could also be our highest dew points of the summer so far from the mid to upper 70s.

-
2026-2027 Super El Nino
bluewave replied to Stormchaserchuck1's topic in Weather Forecasting and Discussion
First, let’s get something straight right now. The weather and climate isn’t law school. Trying to reduce weather patterns to some type of legalistic definition isn’t going to fly. All we can say is beyond two weeks is that the models lose skill. But they have been making errors in certain types of ways. One is to underestimate the magnitude and even location of the ridges. The other is that the troughs have been verifying weaker. We are currently heading into a super El Niño without precedent. First, the strength is going off the scale. Second, the 500 mb weather patterns are currently in more of -PDO +AMO pattern. This has never happened before. So it’s probably a reasonable guess at this early point that the ridges during the winter will continue verify stronger than the model forecasts like that have most winters over the last decade and the troughs weaker. If you want the exact locations now, then I think you are being unrealistic. Especially since the 500mb pattern is yet to take on a more traditional pattern. So we are going to have to wait and see how close or different the pattern develops going forward. So even if a 10%-20% Niña-like mid-latitude ridge enhancement continues into the winter, it could lead the El Niño ridge pressing further south and east than usual. -
2026-2027 Super El Nino
bluewave replied to Stormchaserchuck1's topic in Weather Forecasting and Discussion
How can anyone take the seasonal models at face value for the winter which is 4-6 months away when the May forecast for this June and July only 1-2 months out had such significant errors? This is another example of the models not having much skill beyond the 15 day period. Notice how the ridges in the mid-latitudes verified much stronger leading to the strong -PDO +AMO pattern. The forecasts were going for a general Nino 3.4 correlation which didn’t work out. So it looks like the models are just defaulting to Nino 3.4 climatology for June and July. Back in 2023-2024 the winter forecasts also defaulted to general Nino 3.4 correlations with the ridges verifying much stronger and the troughs weaker. Forecasts from around May 1st June Forecasts June correlation for Nino 3.4 June verification July forecasts July correlation Nino 3.4 July verification -
2026-2027 Super El Nino
bluewave replied to Stormchaserchuck1's topic in Weather Forecasting and Discussion
The summer of 1987 was only the 6th warmest summer of the 1980s ranking only around the 60th warmest summer average temperature overall for the CONUS since 1895. The warmest summer from that era was 1988 which was the 12th warmest average temperature for the CONUS. While the summer of 1987 was warmer than the 1982 developing super El Nino, the 500mb and temperature pattern from the Pacific to the Atlantic was a general match for El Nino. Even though there was an area of warmer departures relative to the other regions in portions of the East, other areas from the Pacific to Atlantic did match El Nino expectations. Since you can have a good general match without 100% conformity to the El Nino composite. -
2026-2027 Super El Nino
bluewave replied to Stormchaserchuck1's topic in Weather Forecasting and Discussion
First July 31st ever with a +2.46 Nino 3.4 SST anomaly and a -2.03 PDO. -
2026-2027 Super El Nino
bluewave replied to Stormchaserchuck1's topic in Weather Forecasting and Discussion
No red herrings involved. My first post showing the warmth this month was based on the warmest 1991-2020 averages. So that is why I kept it for continuity between posts. But your cooler base period doesn’t show any material difference from the main point how much warmer this summer has been than past developing El Niños due to the record ridging from north of Hawaii across the CONUS. So it just seems like you are inventing ways to be argumentative without addressing the main point.