donsutherland1
-
Posts
23,988 -
Joined
Content Type
Profiles
Blogs
Forums
American Weather
Media Demo
Store
Gallery
Everything posted by donsutherland1
-
Occasional Thoughts on Climate Change
donsutherland1 replied to donsutherland1's topic in Climate Change
Apparently, it seems that there is a concerted effort underway to discredit Phoenix's monthly temperature record from yesterday. Apparently, the individual is unaware that Phoenix's ASOS was commissioned, which means it meets federal siting requirements. Therefore, there's no need to throw out its readings. Second, and more importantly, the heat was real as nearby data from East Mesa, Tempe ASU, Scottsdale, etc., show. That additional data reveals that Phoenix was not an isolated hot spot. The individual's statement is unserious and ill-informed.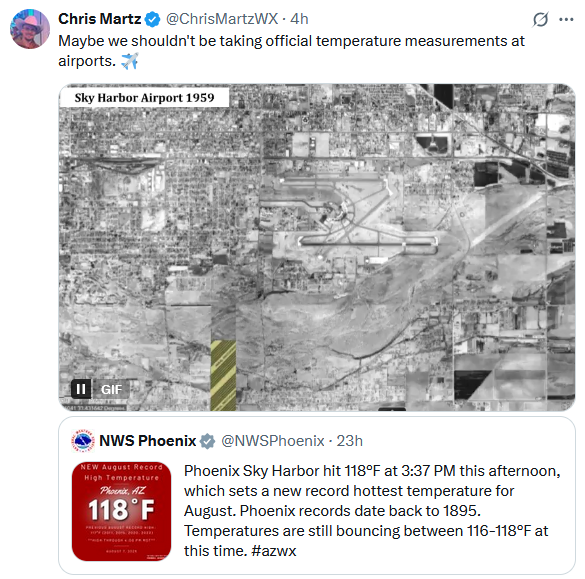
-
May John Burns rest in peace. May his memory always be an inspiration.
-
This morning, the temperature fell to 64° in Central Park. That was the third consecutive day with a low of 64° or below and the second such streak during the first 10 days of August. The last time that happened was way back in 1921. Tomorrow will again see highs in the upper 70s and lower 80s with lows falling into the upper 60s in New York City. A new round of heat will likely begin to develop on Sunday. The region will likely experience a return of 90° or above heat next week. Temperatures could top out in the middle or perhaps even upper 90s in the hot spots when the heat peaks during the Tuesday through Thursday period. The ENSO Region 1+2 anomaly was +0.4°C and the Region 3.4 anomaly was -0.3°C for the week centered around July 30. For the past six weeks, the ENSO Region 1+2 anomaly has averaged +0.37°C and the ENSO Region 3.4 anomaly has averaged -0.08°C. Neutral ENSO conditions will likely continue through the summer. The SOI was +15.11 today. The preliminary Arctic Oscillation (AO) was +0.595 today. Based on sensitivity analysis applied to the latest guidance, there is an implied 53% probability that New York City will have a warmer than normal August (1991-2020 normal). August will likely finish with a mean temperature near 76.4° (0.3° above normal). Supplemental Information: The projected mean would be 1.2° above the 1981-2010 normal monthly value.
-
Occasional Thoughts on Climate Change
donsutherland1 replied to donsutherland1's topic in Climate Change
Maybe he shouldn't weigh in when he doesn't have the data. There were numerous stretches where Phoenix was at 118°, some of which were five or more minutes long, which precludes his "gust hypothesis." One example from the minute-by-minute readings: Also, NWS Phoenix is one of the few sites with a backup sensor. If the numbers are off, the NWS looks into issue. Finally, from the NWS Phoenix Weather Area: El Centro (118°) missed its monthly mark by 1°; Blythe (120°) missed its monthly mark by 1°; East Mesa (117°) tied its monthly mark, Scottsdale (116°) broke its monthly mark by 1°, and Tacna NE (120°) missed its monthly mark by 1°. Some of these are small communities. Outside of the Phoenix area, Tucson (112°) tied its monthly record.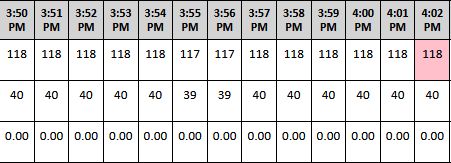
-
The cool start was even more impressive in other parts of the area: Bridgeport, Central Park, Newark: Coolest since 2013 JFK: Coolest since 1996 LGA: Coolest since 1985
-
The temperature has reached 64 at Central Park. That is the second 3-day streak with lows of 64 or below. The last time that occurred in August was 2008. The last time there were two such streaks during August 1-10 was 1921.
-
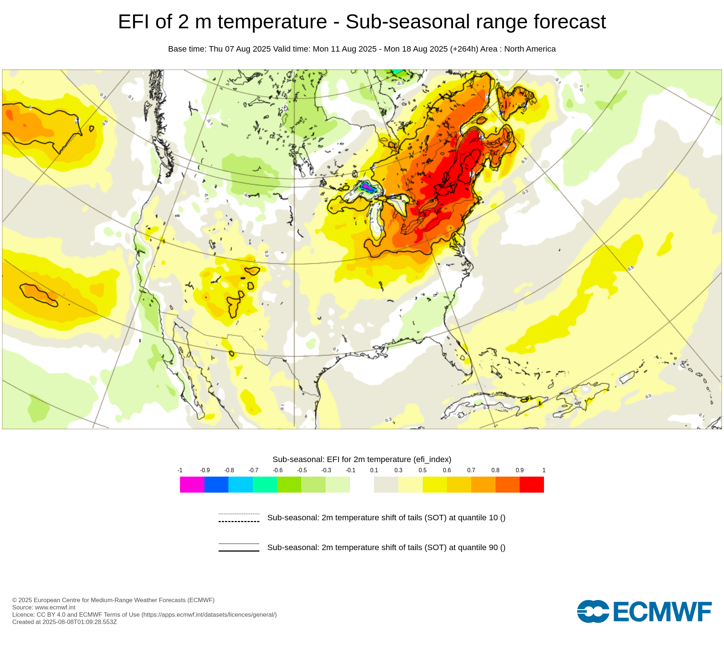
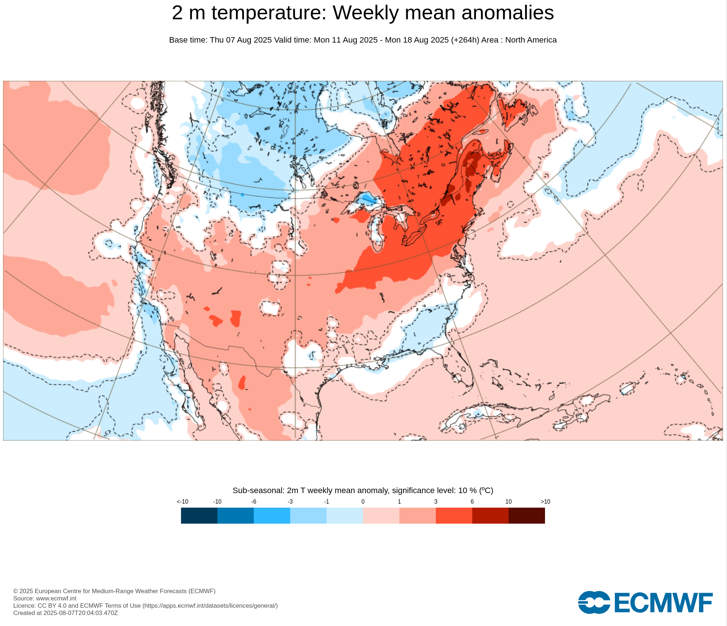
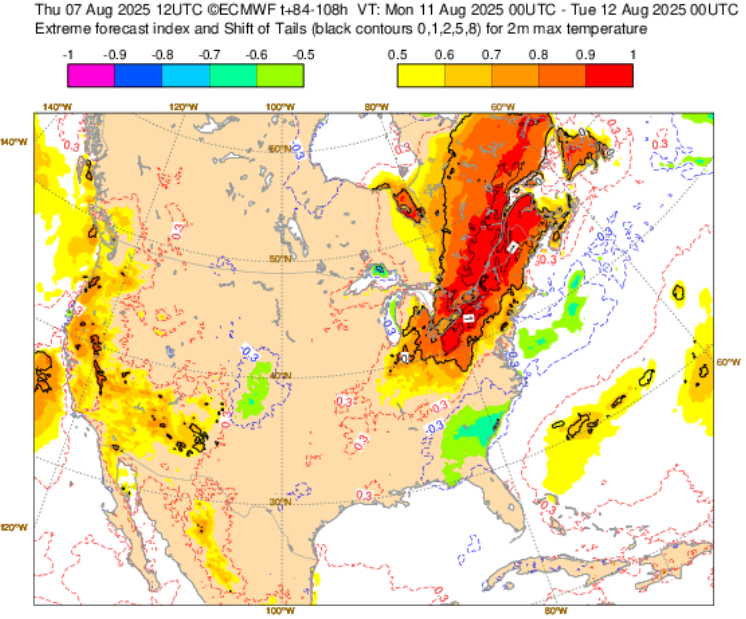
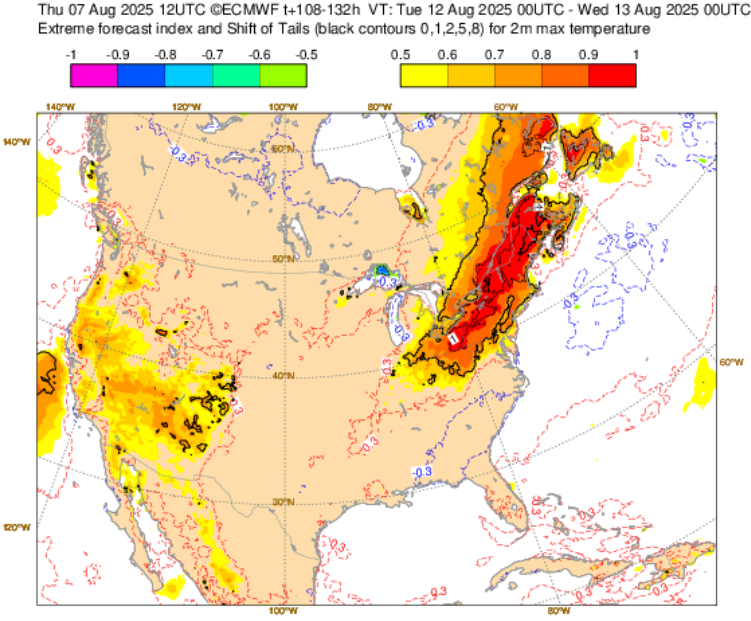
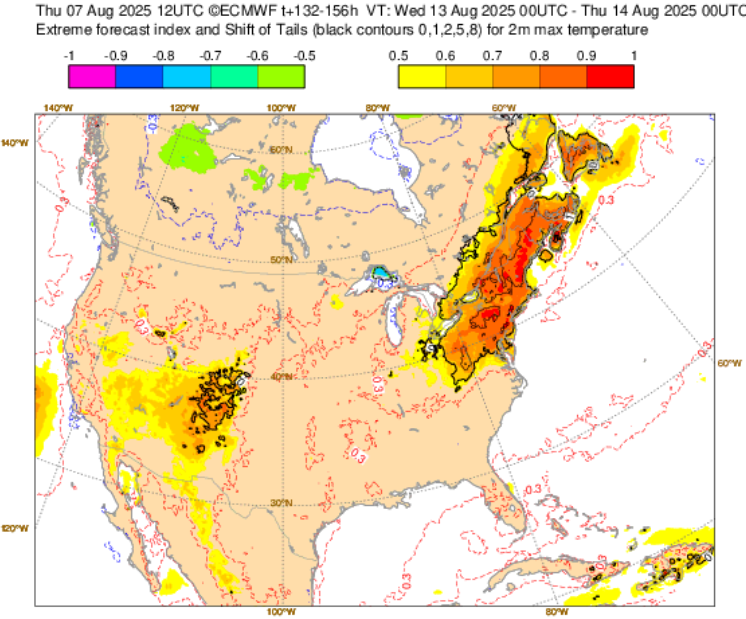
Next week's heat is continuing to look more significant, even as the most anomalous heat will likely be focused on western and upstate New York, eastern Ontario (including Toronto), southern Quebec (including Montreal), and northern New England. In that area, daily records could be challenged during the peak of the heat. The latest ECMWF maps are below. Extreme Forecast Index (August 11-18): Monday, August 11: Tuesday, August 12: Wednesday, August 13: Weekly Temperature Anomalies:
-
I've revised the post and added it.
-
The remainder of the week will see temperatures average somewhat below normal. Highs will mainly be in the upper 70s and lower 80s with lows falling into the upper 60s in New York City. A new round of heat could begin to develop on Sunday. The region will likely experience a return of 90° or above heat next week. The probability of extreme heat has increased in recent days. Temperatures could top out in the middle or perhaps even upper 90s in the hot spots Tuesday through Thursday. The ENSO Region 1+2 anomaly was +0.4°C and the Region 3.4 anomaly was -0.3°C for the week centered around July 30. For the past six weeks, the ENSO Region 1+2 anomaly has averaged +0.37°C and the ENSO Region 3.4 anomaly has averaged -0.08°C. Neutral ENSO conditions will likely continue through the summer. The SOI was +16.63 today. The preliminary Arctic Oscillation (AO) was +0.560 today. Based on sensitivity analysis applied to the latest guidance, there is an implied 56% probability that New York City will have a warmer than normal August (1991-2020 normal). August will likely finish with a mean temperature near 76.7° (0.6° above normal). Supplemental Information: The projected mean would be 1.5° above the 1981-2010 normal monthly value.
-
2025-2026 ENSO
donsutherland1 replied to 40/70 Benchmark's topic in Weather Forecasting and Discussion
The PDO- is, in large part, a function of the marine heatwave in the West Pacific. It is not due to cold sea surface temperatures. I'm not sure the quoted individual knows what constitutes a negative or positive PDO, much less that the PDO- does not support whatever climate-related argument he is trying to make. -
2025-2026 ENSO
donsutherland1 replied to 40/70 Benchmark's topic in Weather Forecasting and Discussion
August has grown hotter and drier in Phoenix. It is also warmer than July was in the past. That includes extreme heat. August 2020-2025 has had more high temperatures of 115 or above than the entire August 1895-2019 period. This year’s monsoon season is also off to a dismal start in the Phoenix area.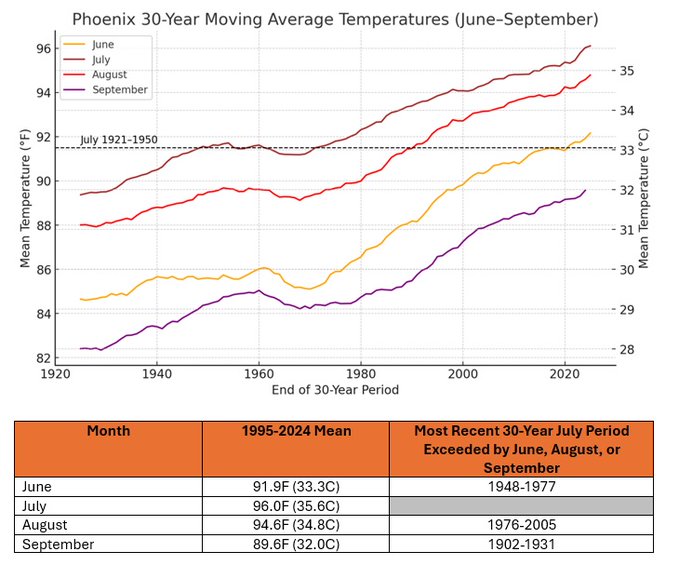
-
I agree. Without the rain, I am sure Central Park's lows would have been several degrees warmer.
-
New York City (Central Park) recorded its second consecutive 64° minimum temperature today. That is the second consecutive day its low temperature was below those at Bridgeport, Islip, and White Plains. The last time that occurred was July 23-24, 2007.
-
China has lots of other issues, so even if it widens its lead on energy, those other issues could still adversely affect China. Authoritarian approaches tend to be rigid and rigidity ultimately undermines innovation. It also has an aging population, which will constrain its labor market growth.
-
Under mainly cloudy skies, the temperature topped out at 79° today in New York City. The remainder of the week will see temperatures average somewhat below normal. Highs will mainly be in the upper 70s and lower 80s with lows falling into the upper 60s in New York City. A new round of heat could begin to develop on Sunday Parts of the region could see a return of 90° or above heat. The probability of extreme heat has increased in recent days. The ENSO Region 1+2 anomaly was +0.4°C and the Region 3.4 anomaly was -0.3°C for the week centered around July 30. For the past six weeks, the ENSO Region 1+2 anomaly has averaged +0.37°C and the ENSO Region 3.4 anomaly has averaged -0.08°C. Neutral ENSO conditions will likely continue through the summer. The SOI was +0.79 today. The preliminary Arctic Oscillation (AO) was +0.312 today.
-
Acid rain was a simpler issue to address. The ozone issue saw similar arguments made by fossil fuel proponents today, e.g., that there are no alternatives to CFCs for refrigeration. Then, the global leaders had the courage and foresight to agree to phase out the CFCs despite the objections. They understood the bigger picture of what enhanced solar radiation would mean to human society. No such courage or foresight is present among the current generation of global leaders when it comes to a far more gradual phaseout of the burning fossil fuels. Moreover, the problem with fossil fuels is arguably simpler to solve, as many cheaper alternatives currently exist, which had not been the case when the phaseout of CFCs was considered. That global subsidies of $7 trillion annually are provided for fossil fuels badly distorts energy prices. It also doesn't deter ongoing political commitment to the preservation of the status quo, even as many of those same political leaders targeted far smaller investments in research and clean energy to fund their tax and policy preferences. Even as China continues to construct coal plants, it has been the most aggressive nation in terms of scaling up renewables. It also has made rapid recharging stations widely available in its major cities (a logistical problem that seems beyond U.S. capability and/or will). It has also developed a battery that can fully charge in just 5 minutes, which will likely be commercialized in the next few years. It now manufactures EVs for the mass market, something that Tesla has been unable to do. Tragically, the U.S. choice to substantially diminish its scientific enterprise via disinvestment, increasingly stringent requirements on international students, and ideological intrusions into Higher Education will widen the competitive gap in energy, EVs, and potentially create qualitative disadvantages in a wider range of high-tech/science-driven fields (including military applications) over the next decade or so. That could make the U.S. even more reliant on yesterday's energy at a real cost to its consumers and the environment. I suspect that China will leverage its increasingly decisive competitive advantage in EVs and solar power in coming years and will make a major shift toward clean energy during the 2030s and its emissions will fall fairly dramatically during that time.
-
The UN created the Conference of Parties. However, each nation is allowed to include anyone it finds suitable in its delegation. That's where the problem arises. Nations include major polluters (likely because they seek to perpetuate the status quo), even as the polluters are the cause of the problem, have conflicts of interest, and have history of resisting change.
-
I agree that it has to be a global effort. That's where leadership deficiency comes in. The ozone and acid rain issues were handled globally. That's also where corrupted processes via frameworks that include major polluters as equal stakeholders come in.
-
A handful of U.S. representatives did so, but they are deflecting from their own policy responsibility. Tom Tiffany and Glenn Grothman of Wisconsin and Michelle Fischbach, Brad Finstad, Pete Stauber and Tom Emmer of Minnesota signed a letter to Canada's Ambassador to the U.S. complaining about Canada's wildfire smoke. All but Stauber reject the reality of climate change. Stauber claims to accept it but to want a technology-based solution rather than fossil fuel phaseout, but even that position isn't credible. He voted in favor of this year's reconciliation bill that guts the technology-based climate solutions from the Inflation Reduction Act. They are posturing. Finally, regarding geoengineering with its attendant risks (e.g., impact on India's monsoon season) and limitations (does nothing to stop ocean acidification), if the world's nations cannot agree on a binding straightforward solution to a basic physics problem behind the causes of climate change, it's highly unlikely that they would agree to a more complex agreement on geoengineering that would set food-sharing provisions e.g., if India's monsoon fails, other set binding approaches for addressing other major contingencies that could arise. Moreover, the caliber of the world's leaders doesn't compare to those of the 1980s or 1990s when the acid rain and ozone issues were addressed and the international processes e.g., COP conferences, are corrupted by allowing major polluters full standing to shape the outcomes.
-
2025-2026 ENSO
donsutherland1 replied to 40/70 Benchmark's topic in Weather Forecasting and Discussion
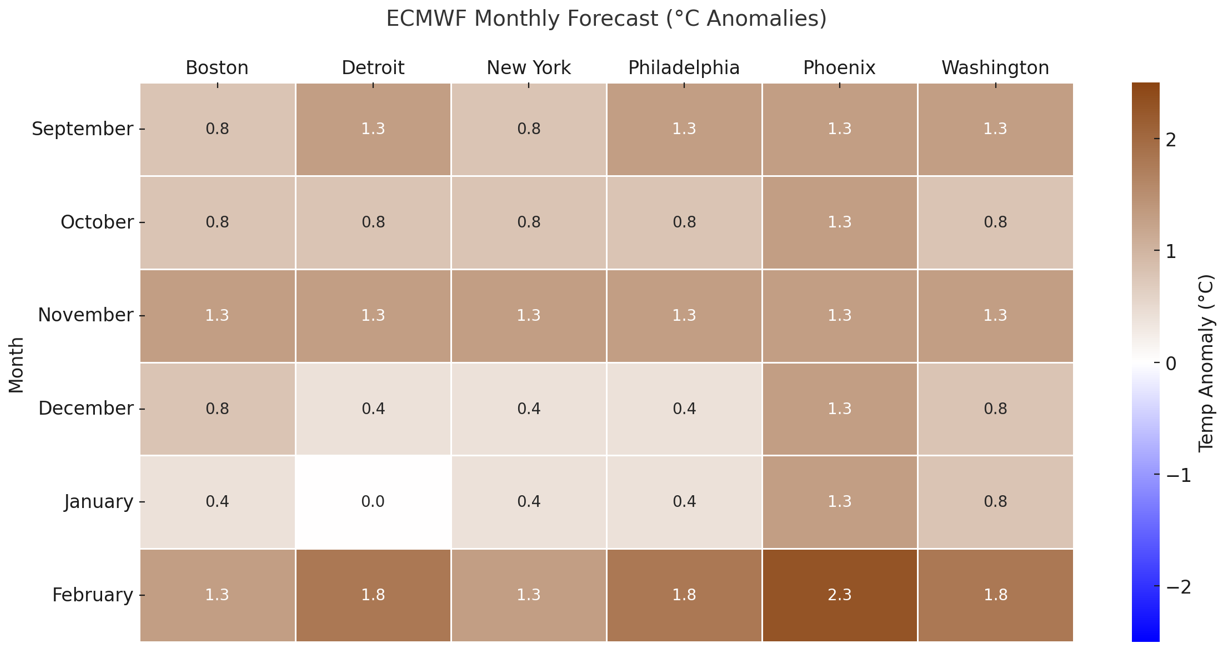
ECMWF Monthly Anomalies for Select Cities: Main idea: The best of winter would be December-January in the Great Lakes, Mid-Atlantic, and New England areas, if the guidance is correct. The Southwest would be warm for the fall and winter. Buffalo and Toronto: September: +1.3 October: +0.8 November: +1.3 December: +0.4 January: 0.0 February: 1.3 Savannah: September: +0.8 October: +0.8 November: +0.8 December: +0.4 January: +0.8 February: +1.8
-
Somewhat cooler air will move into the region following a dry frontal passage. The remainder of the week will see temperatures average somewhat below normal. Highs will mainly be in the upper 70s and lower 80s with lows falling into the upper 60s in New York City. A new round of heat could develop around or just after August 10th. Parts of the region could see a return of 90° or above heat. Extreme heat still appears unlikely, but the probability of such heat has increased somewhat. The ENSO Region 1+2 anomaly was +0.4°C and the Region 3.4 anomaly was -0.3°C for the week centered around July 30. For the past six weeks, the ENSO Region 1+2 anomaly has averaged +0.37°C and the ENSO Region 3.4 anomaly has averaged -0.08°C. Neutral ENSO conditions will likely continue through the summer. The SOI was -18.03 today. The preliminary Arctic Oscillation (AO) was +0.216 today.
-
Perhaps it is this story: https://www.eurekalert.org/news-releases/1092740?
-
2.7 for the aftershock.
-
2025-2026 ENSO
donsutherland1 replied to 40/70 Benchmark's topic in Weather Forecasting and Discussion
The newly released ECMWF Seasonal Forecast for Fall shows somewhat warmer than normal conditions in the Central U.S. The CANSIPS with its cold outlook there is an outlier.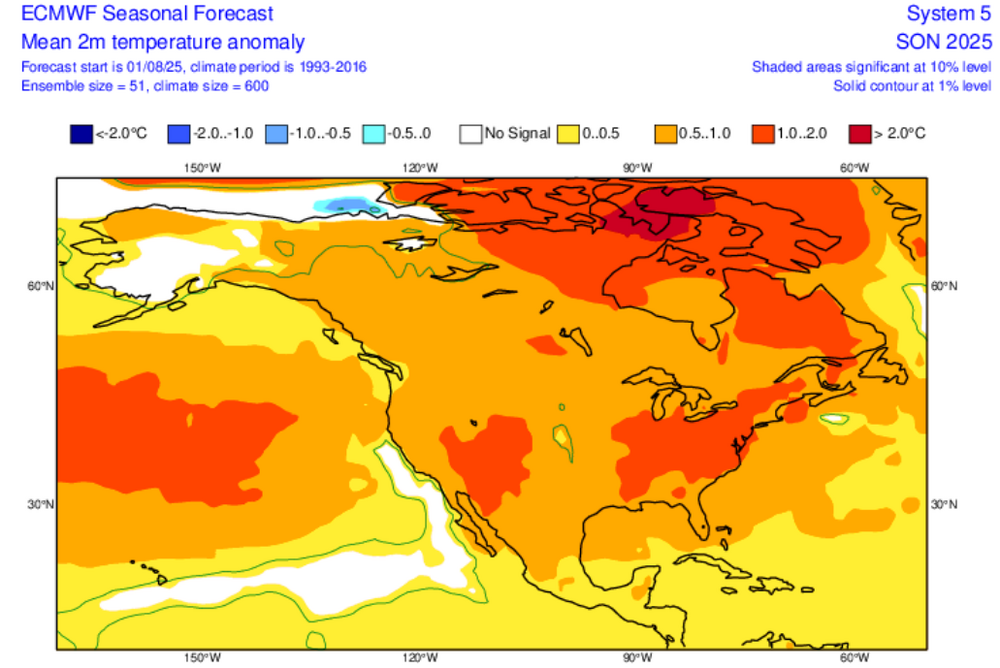
-
2025-2026 ENSO
donsutherland1 replied to 40/70 Benchmark's topic in Weather Forecasting and Discussion
Sorry, I thought you were referring to snowfall maps. If I recall correctly, the NAO map showed a 0.5 correlation for the Mid-Atlantic and Southeast and lower correlation for the Northeast/Great Lakes areas. Also, the correlation has weakened since 1990.