donsutherland1
-
Posts
23,988 -
Joined
Content Type
Profiles
Blogs
Forums
American Weather
Media Demo
Store
Gallery
Everything posted by donsutherland1
-
Winter cancelled/uncancelled banter 25/26
donsutherland1 replied to Rjay's topic in New York City Metro
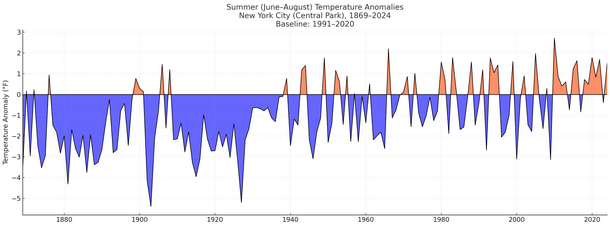
NOAA uses a 20th century (1901-2000) baseline for assessing anomalies for purposes of climate analysis. This is how NYC's summers look using the 20th century baseline: For purposes of "normals," the latest baseline period is 1991-2020. Here's how NYC's summers look using that baseline: The last summer cooler than the NOAA's long-term 20th century baseline was summer 2009. The last summer cooler than the 1991-2020 baseline was summer 2023. Summer 2025 will wind up warmer than both baselines.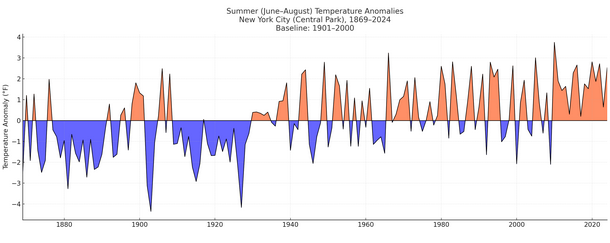
-
Arctic Sea Ice Extent, Area, and Volume
donsutherland1 replied to ORH_wxman's topic in Climate Change
Their goal, and that of other social media influencers, has nothing to do with honest discussion. It's solely about obfuscation. That's why they can only succeed in political circles, not scientific ones. Indeed, many of these influencers are viewed dismally in scientific circles. Their efforts are shoddy, filled with errors, and miss even basic points. I sometimes bring up some of them here, so that people are aware of what's going on. One example, not posted here, but on X: The basic error here that Martz (a social media influencer who is active in denying anthropogenic climate change and its impacts) makes is that he does not understand that probability measures the chance of an event occurring/not occurring. It does not directly measure model accuracy. Thus, he essentially endorses a post that asserts that a 5% probability of an event's occurrence means that he models were "wrong 95% of the time." This is a fundamental misunderstanding of what statistics measure and what they do not measure. Indeed, that fundamental error guides this inability to comprehend attribution science and its merit in explaining in statistical terms how much more likely and/or more intense an event was in the contemporary warmer climate. Unfortunately, many who are exposed to such content do not have the backgrounds or understanding to recognize that they are being misled.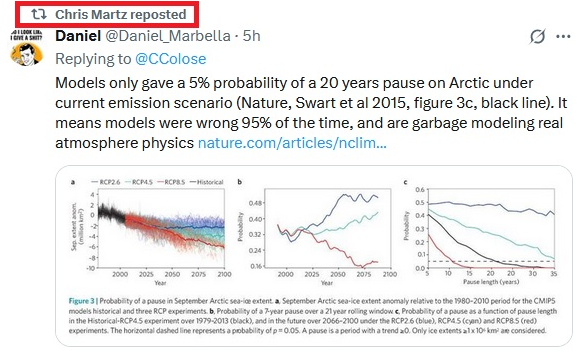
-
High temperatures will top out mainly in the lower 80s tomorrow and Monday before another push of cooler air moves in. Following the arrival of the cool air, high temperatures will top out mainly in the upper 70s and lows will fall to lower 60s in New York City through at least Friday. Outside the City, lows in the 50s will be widespread. There will be higher-than-climatological risk of at least one period in September with highs in the upper 80s or perhaps 90s. Summers similar to the current one have had September highs of 90 or above about 10 percentage points above that for all other years. The ENSO Region 1+2 anomaly was +0.6°C and the Region 3.4 anomaly was -0.3°C for the week centered around August 13. For the past six weeks, the ENSO Region 1+2 anomaly has averaged +0.53°C and the ENSO Region 3.4 anomaly has averaged -0.20°C. Neutral ENSO conditions will likely continue into early autumn. The SOI was +15.90 today. The preliminary Arctic Oscillation (AO) was -0.352 today. Based on sensitivity analysis applied to the latest guidance, there is an implied 95% probability that New York City will have a cooler than normal August (1991-2020 normal). August will likely finish with a mean temperature near 74.2° (1.9° below normal). Supplemental Information: The projected mean would be 1.0° below the 1981-2010 normal monthly value.
-
Occasional Thoughts on Climate Change
donsutherland1 replied to donsutherland1's topic in Climate Change
So far, the ECMWF is an outlier in terms of a return to extreme heat, but the period looks abnormally warm. We'll see what the 12z ECMWF shows. I agree with you about the changes in climate classifications. The warming is ongoing and fairly dramatic. At least one episode of extreme heat has become a fairly regular occurrence. The number of hot days has increased markedly. -
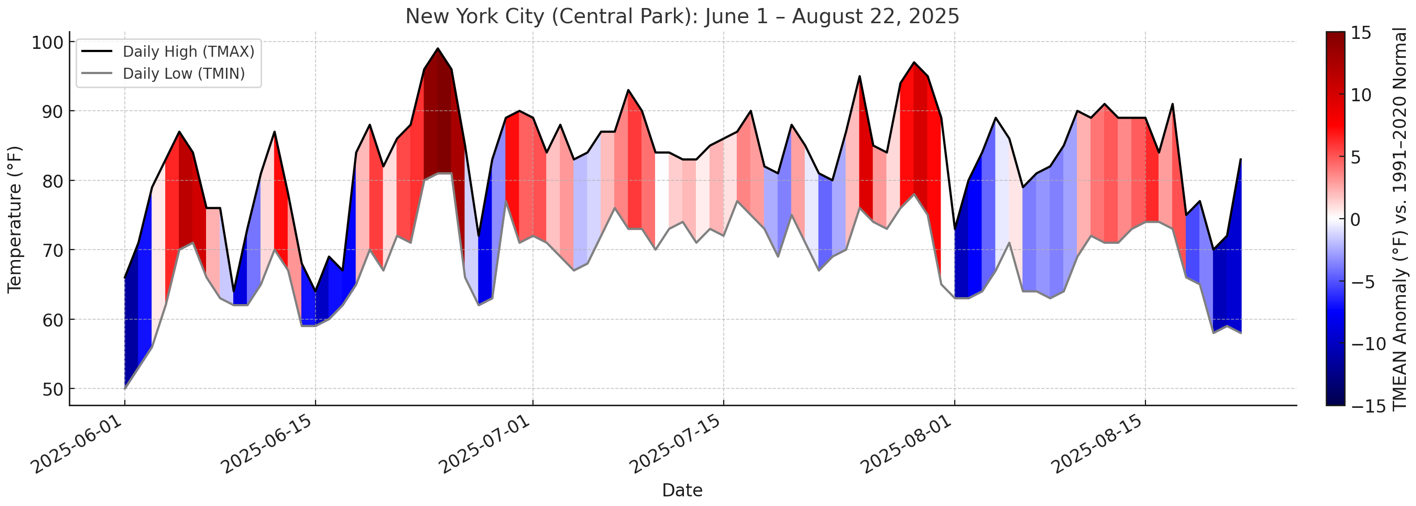
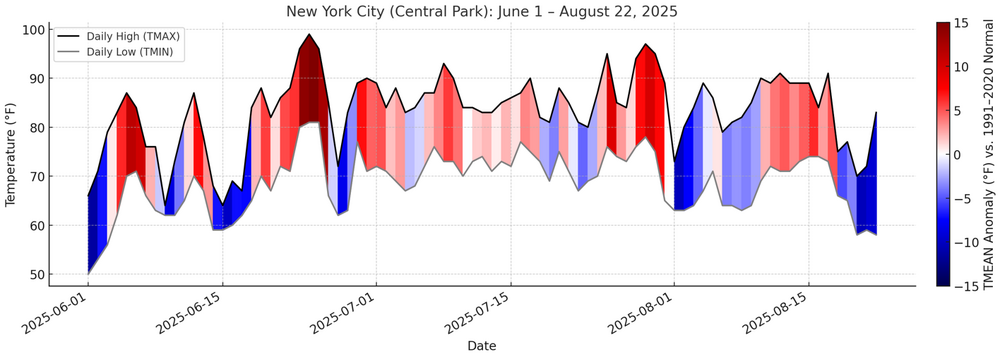
Summer 2025 to date for Central Park:
-
For JFK, it is August 23rd (1991-2020 baseline).
-
Bridgeport, Islip, New York City (Central Park, JFK, LaGuardia), Newark, and White Plains had high temperatures that were within 3° of one another for the 4th consecutive day. The last time there were four consecutive days with such a narrow range was December 23-26, 2022.
-
Occasional Thoughts on Climate Change
donsutherland1 replied to donsutherland1's topic in Climate Change
Yes, that's correct. So far, at least seven sites in Oregon or Washington have reached 100 or above. Daily records have fallen at locations including Corvallis, Portland, and Vancouver (WA). Portland finished with a high of 102. -
Winter 2013-14 was a neutral winter (cool ENSO that fell short of a La Niña).
-
Occasional Thoughts on Climate Change
donsutherland1 replied to donsutherland1's topic in Climate Change
A combination of factors: marine heatwaves, drying hot seasons (June-September), and background anthropogenic warming. -
The temperature dipped to 58° in Central Park this morning, making today the third consecutive day with a low of 59° or below. The last time there were three consecutive such days in August occurred exactly 18 years ago during August 20-22, 2007. Meanwhile, in contrast to the deep trough responsible for the cool weather in the Northeast, there is a powerful heat dome that will bring near record and record heat to parts of the Pacific Northwest. High temperatures will top out mainly in the lower 80s tomorrow and Sunday. The extended range guidance continues to suggest that the closing week of August could feature below normal temperatures. Precipitation could be near normal. There will be higher-than-climatological risk of at least one period in September with highs in the upper 80s or perhaps 90s. Summers similar to the current one have had September highs of 90 or above about 10 percentage points above that for all other years. The ENSO Region 1+2 anomaly was +0.6°C and the Region 3.4 anomaly was -0.3°C for the week centered around August 13. For the past six weeks, the ENSO Region 1+2 anomaly has averaged +0.53°C and the ENSO Region 3.4 anomaly has averaged -0.20°C. Neutral ENSO conditions will likely continue into early autumn. The SOI was +5.52 today. The preliminary Arctic Oscillation (AO) was -0.582 today. Based on sensitivity analysis applied to the latest guidance, there is an implied 88% probability that New York City will have a cooler than normal August (1991-2020 normal). August will likely finish with a mean temperature near 74.4° (1.7° below normal). Supplemental Information: The projected mean would be 0.8° below the 1981-2010 normal monthly value.
-
Winter cancelled/uncancelled banter 25/26
donsutherland1 replied to Rjay's topic in New York City Metro
There seems to be a degree of reliance on persistence for much of the CONUS for winter into spring. The consistency is well above what typically occurs, so one can expect changes in future outlooks.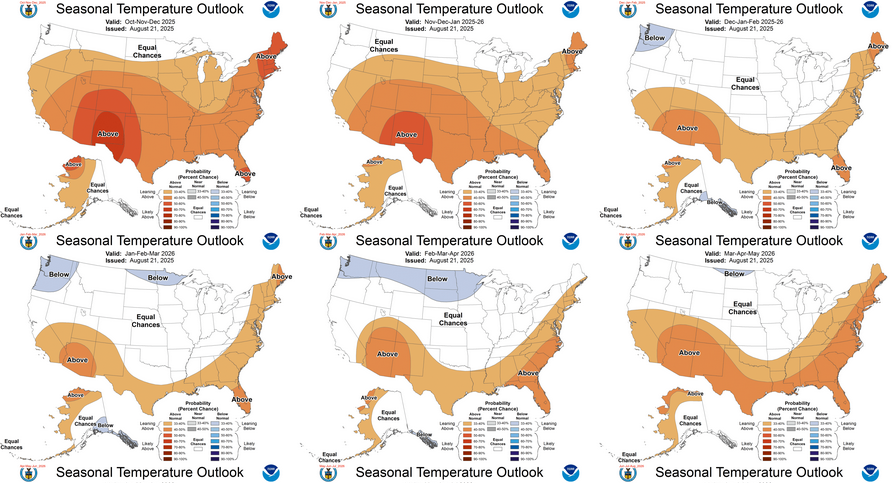
-
Occasional Thoughts on Climate Change
donsutherland1 replied to donsutherland1's topic in Climate Change
On a serious note, there is genuine longer-term risk that the City could pass the point of sustainability, particularly if ongoing aridification depletes its access to water. -
Occasional Thoughts on Climate Change
donsutherland1 replied to donsutherland1's topic in Climate Change
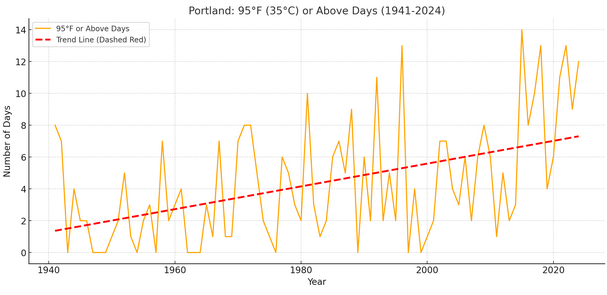
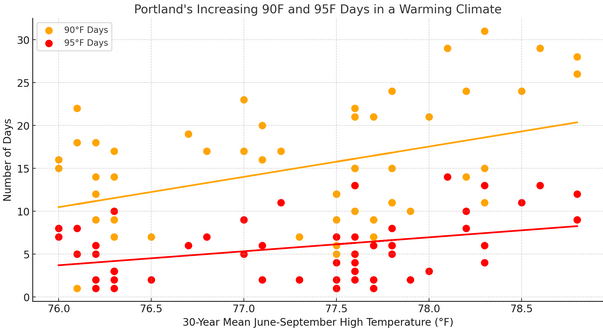
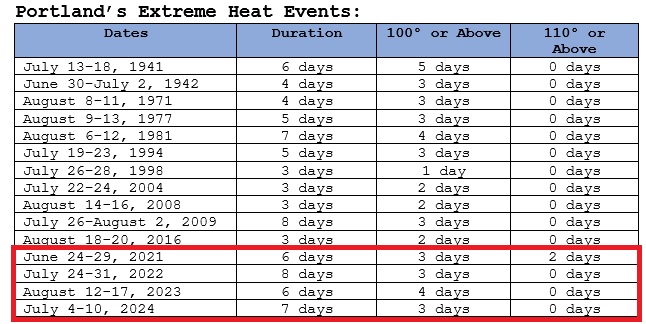
Portland, OR appears to be headed for an extreme heat event (Clarke et al., 2014 methodology) for the fifth year in a row. The City has been experiencing a rise in 90° and 95° days in its warming climate. 90° days are increasing by 1.45 days per decade. 95° days are increasing by 0.72 days per decade. Moreover, in Portland's warming climate, the 30-year mean June-September high temperature reached 78.0° in 2014. The frequency of extreme heat events has increased markedly to about once every 2.2 years (2014-2024). Prior to 2014, extreme heat events occurred once every 7.3 years.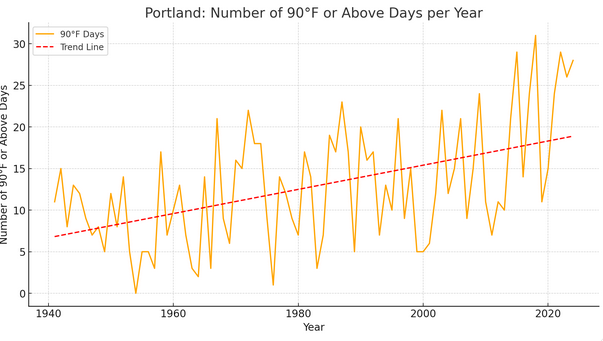
-
Central Park has fallen into the 50s for the third time this month. The last August with three or more such days was August 2007 with six days. The three consecutive such days are the first such streak since August 20-22, 2007.
-
There are some conflicting signals. Years with early extreme heat June-early July often have a bout of heat in September. However, years with the kind of cool shots as is occurring at present during August 20-31 typically have lower monthly maximum temperatures in September. August 20-31 had one or more lows in the 50s: Mean September maximum temperature: 86.9 All other years: Mean September maximum temperature: 89.9.
-
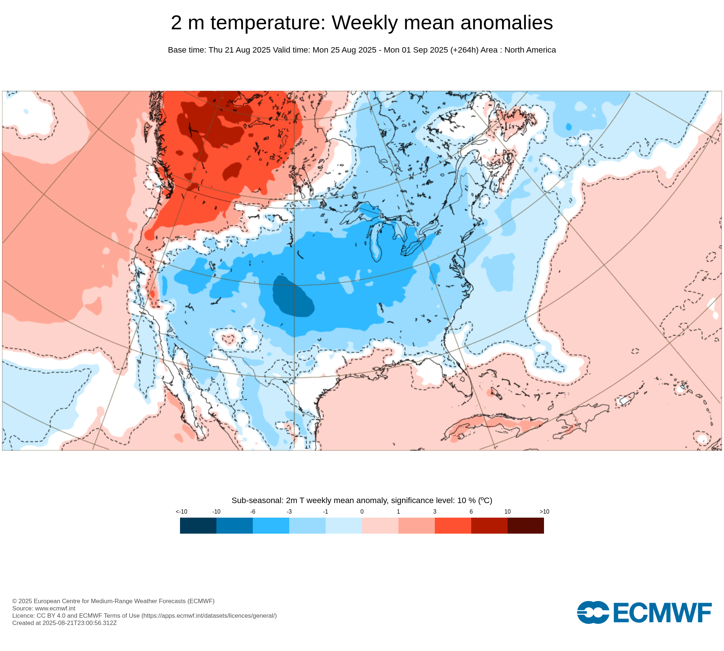
The ECMWF weekly guidance shows almost coast-to-coast cool anomalies in the U.S. The Pacific Northwest and northwestern Canada would be much warmer than normal.
-
Occasional Thoughts on Climate Change
donsutherland1 replied to donsutherland1's topic in Climate Change
I have a cousin out there. She has indicated that the City has a lot to offer, including culture, history, and nature. However, she has increasingly complained about the rising heat. -
I suspect that it will.
-
Hopefully, a corrected figure will be provided.
-
Clouds were breaking across the region this afternoon as the rain of yesterday into this morning had departed. Rainfall amounts included: Bridgeport: None Hartford: 1.52" Islip: 0.38" New Haven: 0.81" New York City-Central Park: 0.78" New York City-JFK Airport: 1.03" New York City-LaGuardia Airport: 0.53" Newark: 0.68" Philadelphia: 0.14" Poughkeepsie: 1.23" White Plains: 1.21" It will turn warmer tomorrow. High temperatures will top out mainly in the lower 80s tomorrow through the weekend. The extended range guidance continues to suggest that the closing week of August could feature below normal temperatures. Precipitation could be near normal. There will be higher-than-climatological risk of at least one period in September with highs in the upper 80s or perhaps 90s. Summers similar to the current one have had September highs of 90 or above about 10 percentage points above that for all other years. The ENSO Region 1+2 anomaly was +0.6°C and the Region 3.4 anomaly was -0.3°C for the week centered around August 13. For the past six weeks, the ENSO Region 1+2 anomaly has averaged +0.53°C and the ENSO Region 3.4 anomaly has averaged -0.20°C. Neutral ENSO conditions will likely continue into early autumn. The SOI was +1.33 today. The preliminary Arctic Oscillation (AO) was -0.858 today. Based on sensitivity analysis applied to the latest guidance, there is an implied 88% probability that New York City will have a cooler than normal August (1991-2020 normal). August will likely finish with a mean temperature near 74.4° (1.7° below normal). Supplemental Information: The projected mean would be 0.8° below the 1981-2010 normal monthly value.
-
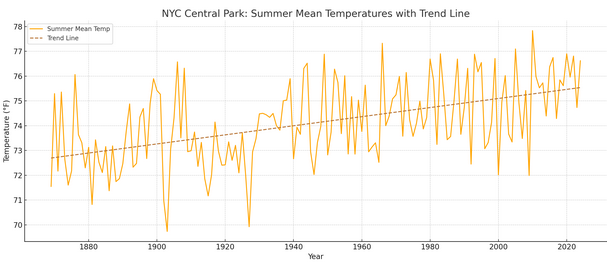
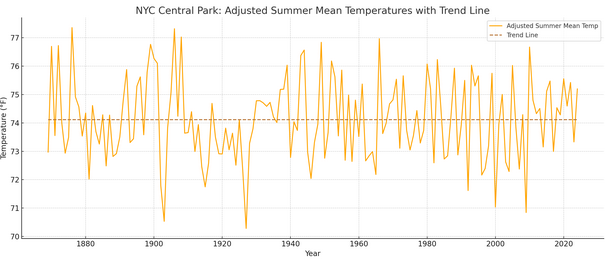
My list was developed based on four criteria for which data is widely available: 1. Mean temperature 2. Highest maximum temperature 3. Highest minimum temperature 4. Number of 90F/32.2C or above high temperatures These values were standardized (standard deviations from the historic mean values for the period of record) I ran the numbers weighting each of the four criteria equally (initial approach) and also placing 50% weight on the mean temperature and then allocating the remaining 50% weight equally among the remaining three criteria. Further, I ran these numbers for a true summer (June-August) and extended summer (June-September) scenario. The different approaches were utilized based on various comments and "what if" questions made in the thread. If asked, I lean toward the second approach to weights (50% weight for the mean temperature as opposed to equal weights for all criteria) for the June-September period, as even relatively cool summers can have a short bout of extreme heat. Weighting everything equally skews the values. Separately, but not posted, I also looked at how much warming over the historic period has influenced summer mean temperatures. The coefficient of determination was 0.25, meaning that 25% of the variation in mean summer temperatures is explained by the ongoing warming and 75% is explained by internal variability. That's actually a quite high figure explained by warming, alone. Here's what summers look like at Central Park (1869-2024): Here's what they look like when the warming component is removed (as expected, the trend would be 0, but I included the trend line to illustrate that the warming was fully removed): In other words, here's what they would look like were internal variability, alone, responsible. Based on the data, Summer 2010 was just over 1.1F warmer than it would have been without the warming. Based on the internal variability, if a summer similar to 1876 occurs, the mean would be around 78.5F for the summer given the warming. It's probably a matter of time before the Summer 2010 figure is eclipsed (probably no later than the 2030s). Moreover, when it happens, the margin by which the record is broken could be fairly large, as one has seen elsewhere in recent years where summer records were broken.
-
Here they are: Bridgeport: 1953 Islip: None New York City-Central Park: 1921, 1931, 1953, 1983, 1993 New York City-JFK Airport: 1983 New York City-LaGuardia Airport: 1953, 1983, 2010, 2018 Newark: 1914, 1931, 1944, 1953, 1973, 1983, 1989, 1991, 1993, 2010, 2018 White Plains: 1953
-
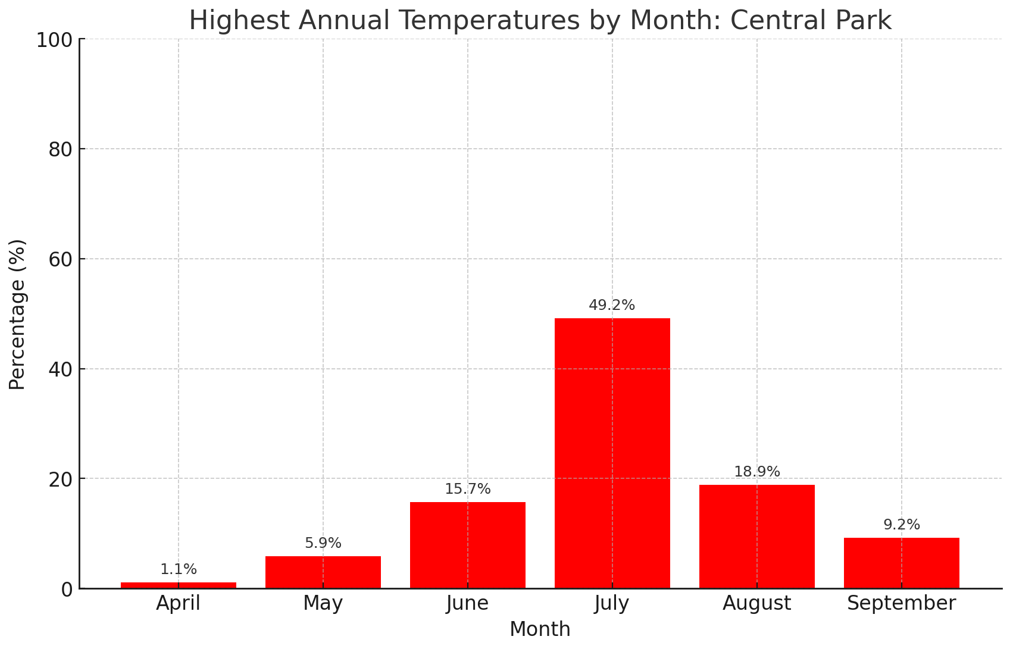
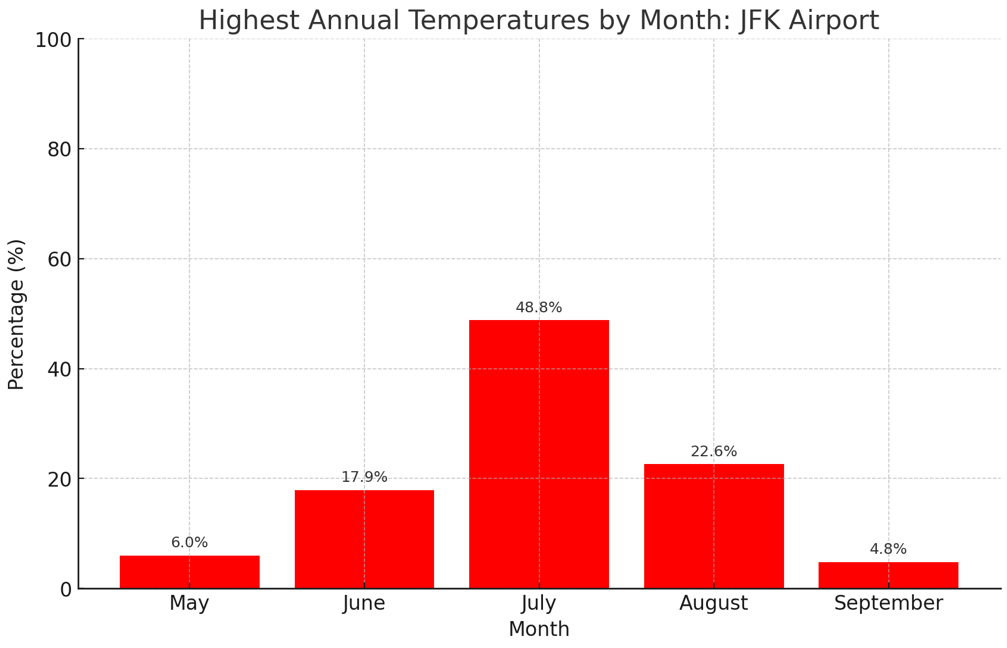
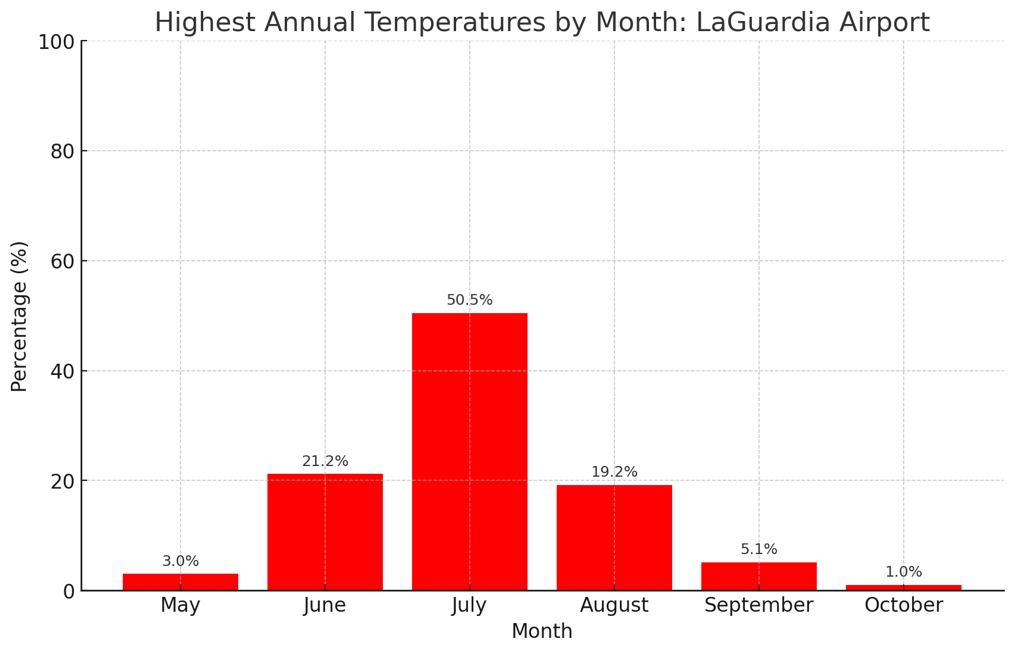
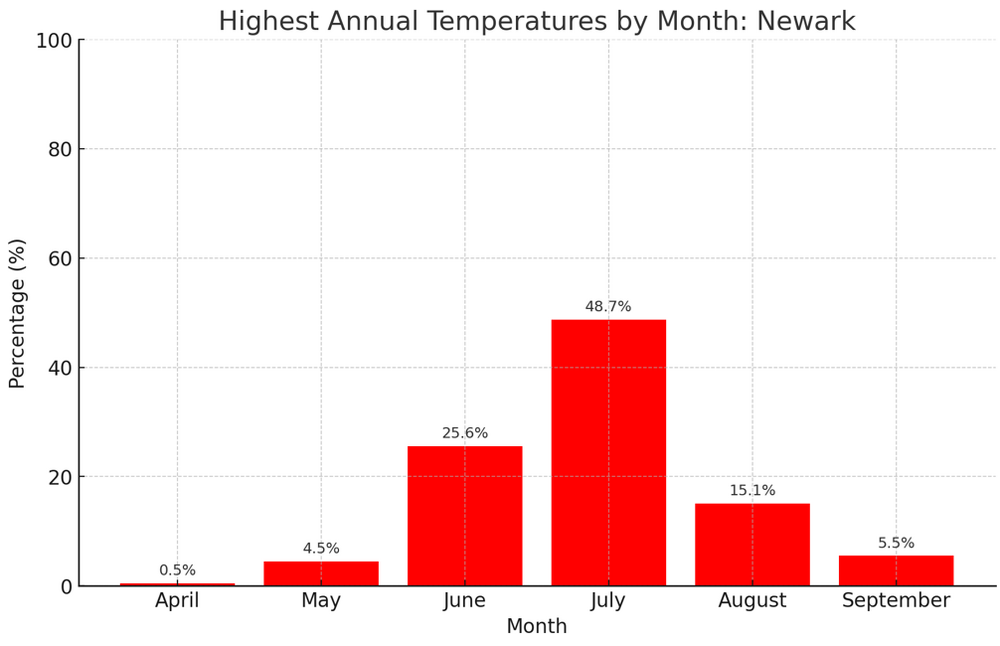
For historical context, below is the distribution of highest temperature by month for NYC, JFK, LGA, and EWR.


-
Occasional Thoughts on Climate Change
donsutherland1 replied to donsutherland1's topic in Climate Change
Phoenix has a five-year master plan for expanding trees/shade. The City is aware of the growing risks its people face from increasingly frequent and intense heat. https://www.phoenix.gov/content/dam/phoenix/heatsite/documents/ShadePhoenixPlan_Nov13CouncilDraft_topost_EN.pdf