donsutherland1
-
Posts
23,988 -
Joined
Content Type
Profiles
Blogs
Forums
American Weather
Media Demo
Store
Gallery
Everything posted by donsutherland1
-
Occasional Thoughts on Climate Change
donsutherland1 replied to donsutherland1's topic in Climate Change
The literature is still mixed on the magnitude of its impact. Hopefully, the literature showing more than a minimal impact will ultimately be vindicated. If not, there will be the issue of whether one or more unidentified factors drove the spike. In turn, that would raise questions about whether there are things that are being missed in the climate models, factors that could potentially lead to higher sensitivity. Already, the "hot models" hypothesis has largely been settled. Those models likely have the better handle on climate sensitivity, as their cloud physics have better matched the developments that have now been observed and their scenarios are closer to the paleoclimate data for some past warming events that saw greater climate sensitivity. -
2025-2026 ENSO
donsutherland1 replied to 40/70 Benchmark's topic in Weather Forecasting and Discussion
Boston and eastern MA largely missed out on that event and it turned to heavy rain for the New York City area for a time. But even with a swath of 10"-20" snows, that event wasn't a high-end KU storm. It was a Category 3 event on the NESIS scale. -
Occasional Thoughts on Climate Change
donsutherland1 replied to donsutherland1's topic in Climate Change
Even as a La Niña event is in its formative stages following a neutral-cool/borderline La Niña winter, 2025's global temperatures remain stubbornly warm. The September 1-10 period ranked as the third warmest (ERA-5 dataset). It was 0.10°C warmer than the fourth place 2020.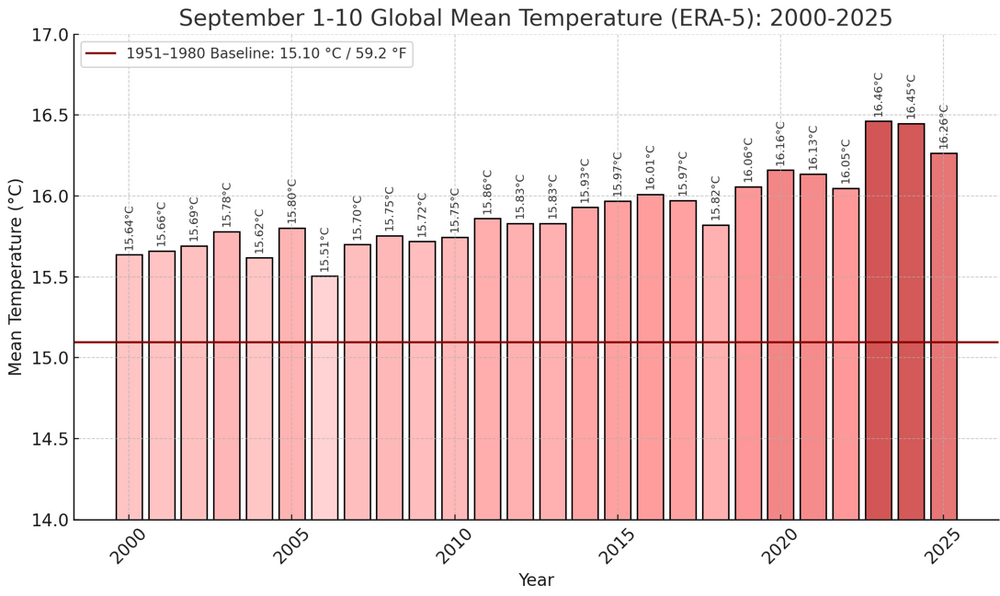
-
2025-2026 ENSO
donsutherland1 replied to 40/70 Benchmark's topic in Weather Forecasting and Discussion
I don't know of anything that is a very close substitute. The WMO has a site with some of the data, but it is quite complex to use: https://climexp.knmi.nl/start.cgi -
Occasional Thoughts on Climate Change
donsutherland1 replied to donsutherland1's topic in Climate Change
A major reason for Russia's rejection of the printing press concerned the Russian Orthodox Church's opposition. The Church felt that the printing press would make it easier to disseminate heresy. It ignored the far greater benefits that could have been realized and were already becoming evident in Western Europe in defense of its much narrower interests. -
September 2025 OBS-Discussion centered NYC subforum
donsutherland1 replied to wdrag's topic in New York City Metro
Tomorrow will be partly sunny with temperatures reaching the middle and upper 70s. The weekend will see a continuation of partly sunny skies with highs mainly in the middle and upper 70s. A few of the warmer spots could reach or exceed 80°. The next round of showers could be Monday. Temperatures will top out in the upper 70s to perhaps lower 80s on Monday and Tuesday. September 1-15 is on track to achieve a solid cool anomaly. Since 2000, there have been nine years that saw a cooler than normal first half of September. Two-thirds of those years went on to record a warmer than normal second half of September. Only two of those years (2017 and 2019) wound up with a monthly mean temperature of 70.0° or above. Overall, for two-thirds of those years, the cool start was sufficiently cool to produce a cooler than normal monthly anomaly. The last year that saw both a cooler than normal first half and second half of September was 2009. Prior to that, it was 2001. The last year to record a cooler than normal first half of September followed by a warmer than normal September was 2024. The ENSO Region 1+2 anomaly was -0.3°C and the Region 3.4 anomaly was -0.4°C for the week centered around August 27. For the past six weeks, the ENSO Region 1+2 anomaly has averaged +0.33°C and the ENSO Region 3.4 anomaly has averaged -0.32°C. La Niña conditions will likely develop during mid- or late-autumn. The SOI was -6.30 today. The preliminary Arctic Oscillation (AO) was +0.370 today. Based on sensitivity analysis applied to the latest guidance, there is an implied near 55% probability that New York City will have a cooler than normal September (1991-2020 normal). September will likely finish with a mean temperature near 68.7° (0.5° below normal). Supplemental Information: The projected mean would be 0.7° above the 1981-2010 normal monthly value. -
September 2025 OBS-Discussion centered NYC subforum
donsutherland1 replied to wdrag's topic in New York City Metro
September 16-30, 2006 had a mean temperature of 66.6, which was slightly above even the 1991-2020 baseline for this period. -
Occasional Thoughts on Climate Change
donsutherland1 replied to donsutherland1's topic in Climate Change
China is making the turn toward cleaner energy, as are some of the other countries cited. Better sources of energy exist. The problem is not technological. It's political. Unfortunately, because fossil fuel interests are so entrenched in U.S. society, the United States has chosen to double down on outdated fossil fuel energy. The U.S. will wind up falling behind in terms of energy and possibly a much wider range of fields that utilize energy due to its decision to stick with higher cost, dirtier energy sources. It won't be the first society to bet big on yesterday's technology. During the 15th Century, as the printing press started spreading throughout Europe, Russia chose to reject it. As a result, Russia fell behind in terms of literacy and the creation/dissemination of scientific knowledge for centuries. The end result was slow modernization. Even contemporary Russia is far from a truly modern state. Its economy is largely based on natural resources and little more. It maintains an imperial world view. In short, bad choices have bad consequences. -
2025-2026 ENSO
donsutherland1 replied to 40/70 Benchmark's topic in Weather Forecasting and Discussion
The new measurement approach is an improvement. La Niñas, particularly weaker ones, would have been masked from a warming of the oceans. They were present, even if not acknowledged. -
Mountain West Discussion
donsutherland1 replied to mayjawintastawm's topic in Central/Western States
I'm not arguing and have never argued that site changes didn't play any role in the shift in Denver (initial comment about Denver and afterward). I cited Denver, as it's Colorado's largest city, but the frequency in hot days has increased elsewhere, too. My subsequent comments highlighted that far more than site changes are involved in the big recent increase in 90° and 95° days. -
September 2025 OBS-Discussion centered NYC subforum
donsutherland1 replied to wdrag's topic in New York City Metro
Today, Islip recorded its third consecutive high of 74° and Central Park saw its third consecutive high of 73°. The last time both locations had three consecutive days with the same high simultaneously was during July 6-8, 2000 when both locations had three consecutive highs of 79°. Tomorrow will be briefly warmer with highs in the upper 70s to perhaps lower 80s. A few locations could see a shower or thundershower tomorrow night into Friday as a cold front pushes through. The next round of showers or rainfall could be Monday. September 1-15 is on track to achieve a solid cool anomaly. Since 2000, there have been nine years that saw a cooler than normal first half of September. Two-thirds of those years went on to record a warmer than normal second half of September. Only two of those years (2017 and 2019) wound up with a monthly mean temperature of 70.0° or above. Overall, for two-thirds of those years, the cool start was sufficiently cool to produce a cooler than normal monthly anomaly. The last year that saw both a cooler than normal first half and second half of September was 2009. Prior to that, it was 2001. The last year to record a cooler than normal first half of September followed by a warmer than normal September was 2024. The ENSO Region 1+2 anomaly was -0.3°C and the Region 3.4 anomaly was -0.4°C for the week centered around August 27. For the past six weeks, the ENSO Region 1+2 anomaly has averaged +0.33°C and the ENSO Region 3.4 anomaly has averaged -0.32°C. La Niña conditions will likely develop during mid- or late-autumn. The SOI was -5.70 today. The preliminary Arctic Oscillation (AO) was +0.415 today. Based on sensitivity analysis applied to the latest guidance, there is an implied near 59% probability that New York City will have a cooler than normal September (1991-2020 normal). September will likely finish with a mean temperature near 68.4° (0.8° below normal). Supplemental Information: The projected mean would be 0.4° above the 1981-2010 normal monthly value. -
Mountain West Discussion
donsutherland1 replied to mayjawintastawm's topic in Central/Western States
My points are as follows: 1) Denver has seen a dramatic increase in hot days. I used 90° highs as an example. The increase is more than just a result of a location change, even as location changes have an impact, otherwise there wouldn't be warming trends across the entire state. Indeed, I've often noted that adjusted data is superior to raw data, precisely because sites move, environments change, times of observation may change, etc. for climate purposes. 2) The broad idea of a greater frequency of hot days does not negate the existence of localized climates or microclimates. Moreover, that idea applies beyond Denver. For example, Boulder has seen half of years with 50 or more 90° or above days and four of its five years with 20 or more 95° or above highs occur since 2000. For Pueblo, 14 of its 17 years with 80 or more 90° days and 9 of its 10 years with 50 or more 95° days have occurred since 2000. In short, in Colorado's populated areas, the 2000s have seen a disproportionate share of hot days. No other period rivals the 2000s in terms of the frequency of such heat. 3. The old Stapleton Airport does not have a continuous record. The old site was demolished and replaced with Central Park. A new ASOS was installed around 2022 there. -
Mountain West Discussion
donsutherland1 replied to mayjawintastawm's topic in Central/Western States
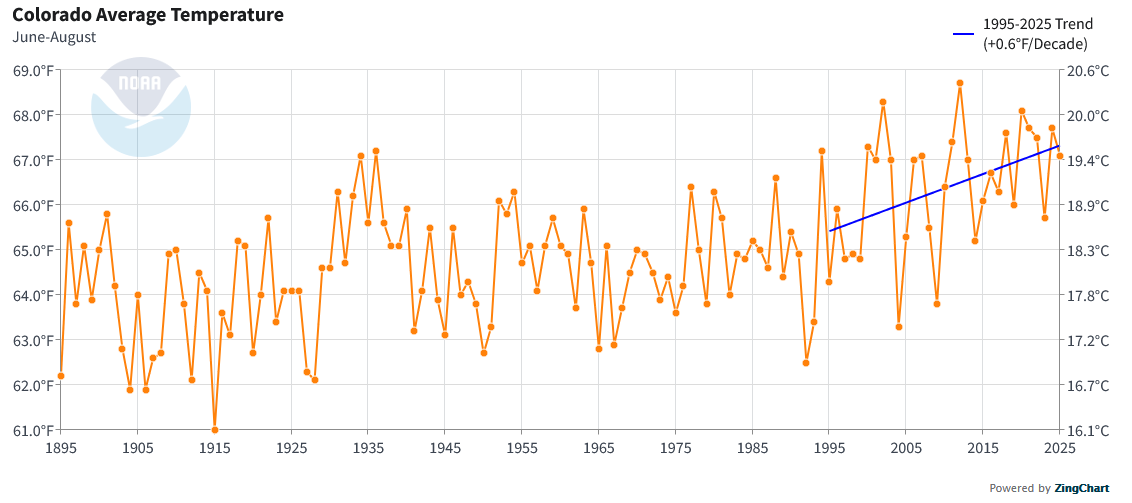
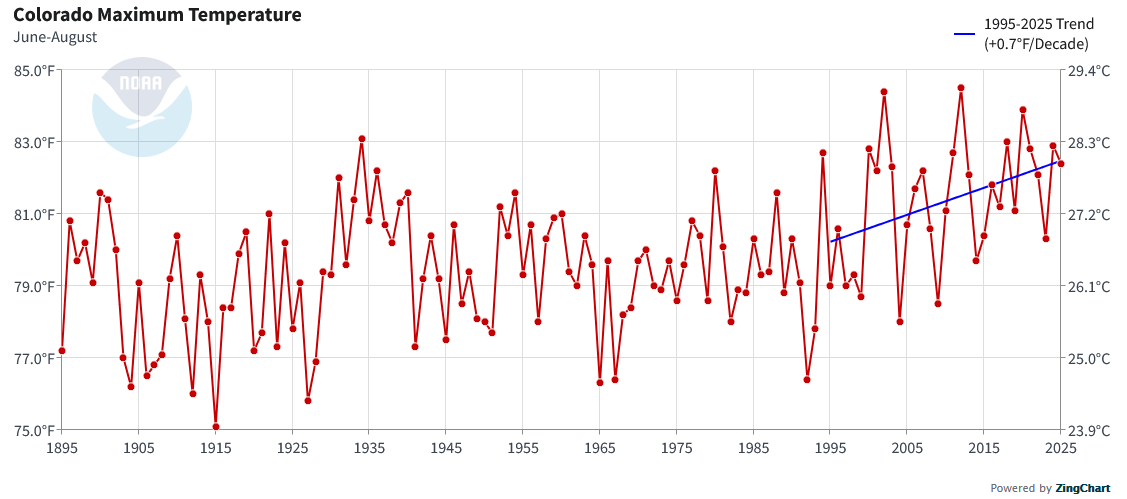
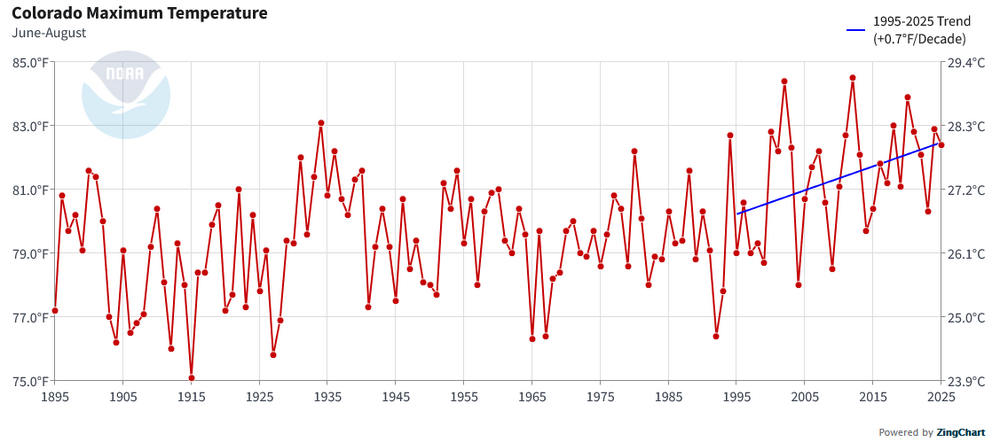
Staptleton Airport was decommissioned, demolished, and replaced by Denver Center Park. The environment is quite different from what it was when record-keeping ended in 1995 at Stapleton Airport. The environment for the new ASOS isn't comparable to what it was at Stapleton Airport. The warming summers since 1995 isn't an artifact of Denver International Airport. It is a statewide phenomenon. 12/15 (80%) of Colorado's summers with a mean temperature of 67.0° or above and all nine of its hottest summers have occurred since 2000. Five of the last six summers (2023 being the exception) have had a mean temperature of 67.0° or above. Statewide maximum temperatures have risen somewhat faster than statewide mean temperatures.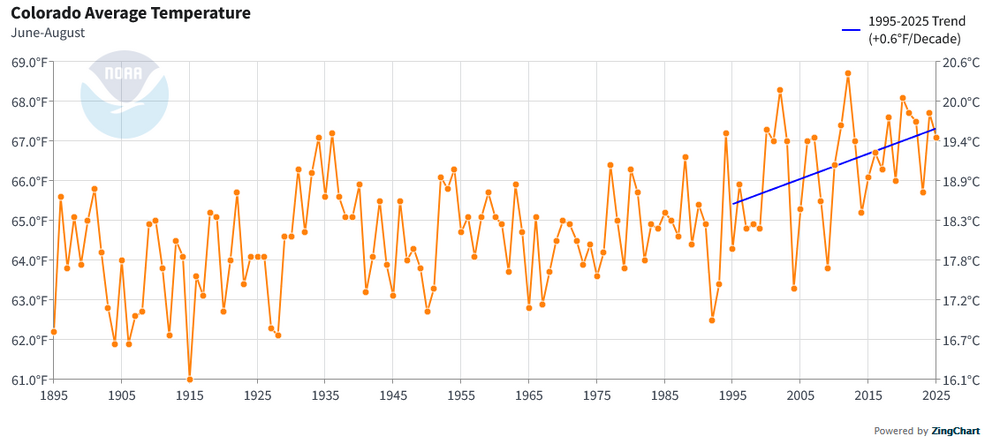
-
September 2025 OBS-Discussion centered NYC subforum
donsutherland1 replied to wdrag's topic in New York City Metro
Tomorrow will be variably cloudy with a few showers possible in places. Highs will top out mainly in the upper 60s. Thursday could be briefly warmer with highs in the upper 70s to perhaps lower 80s. A scattered shower or thundershower is possible Thursday night into Friday as a cold front pushes through. September 1-15 is on track to achieve a solid cool anomaly. Since 2000, there have been nine years that saw a cooler than normal first half of September. Two-thirds of those years went on to record a warmer than normal second half of September. Only two of those years (2017 and 2019) wound up with a monthly mean temperature of 70.0° or above. Overall, for two-thirds of those years, the cool start was sufficiently cool to produce a cooler than normal monthly anomaly. The last year that saw both a cooler than normal first half and second half of September was 2009. Prior to that, it was 2001. The last year to record a cooler than normal first half of September followed by a warmer than normal September was 2024. The ENSO Region 1+2 anomaly was -0.3°C and the Region 3.4 anomaly was -0.4°C for the week centered around August 27. For the past six weeks, the ENSO Region 1+2 anomaly has averaged +0.33°C and the ENSO Region 3.4 anomaly has averaged -0.32°C. La Niña conditions will likely develop during mid- or late-autumn. The SOI was -13.78 today. The preliminary Arctic Oscillation (AO) was +0.461 today. Based on sensitivity analysis applied to the latest guidance, there is an implied near 59% probability that New York City will have a cooler than normal September (1991-2020 normal). September will likely finish with a mean temperature near 68.3° (0.9° below normal). Supplemental Information: The projected mean would be 0.3° above the 1981-2010 normal monthly value. -
2025-2026 ENSO
donsutherland1 replied to 40/70 Benchmark's topic in Weather Forecasting and Discussion
Synoptic scale events can still lead to snowy outcomes even with hostile boundary conditions. The super El Niño winter of 2015-16 is an example. There was a single massive snowstorm that skewed the numbers. There was also a severe Arctic outbreak that sent the mercury in Central Park to -1° on February 14. Much of the rest of the winter was very warm with a lack of snowfall. -
2025-2026 ENSO
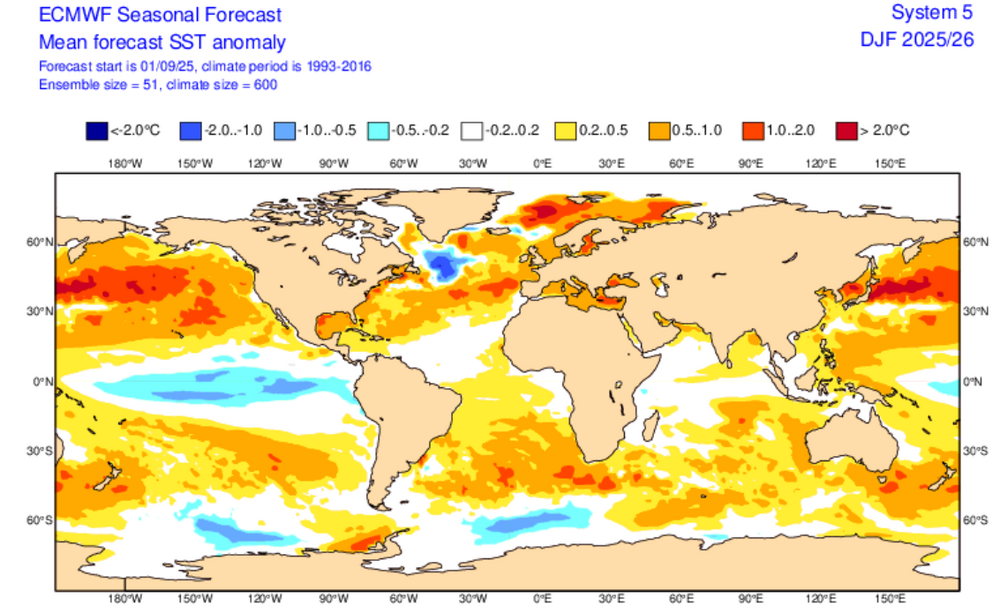
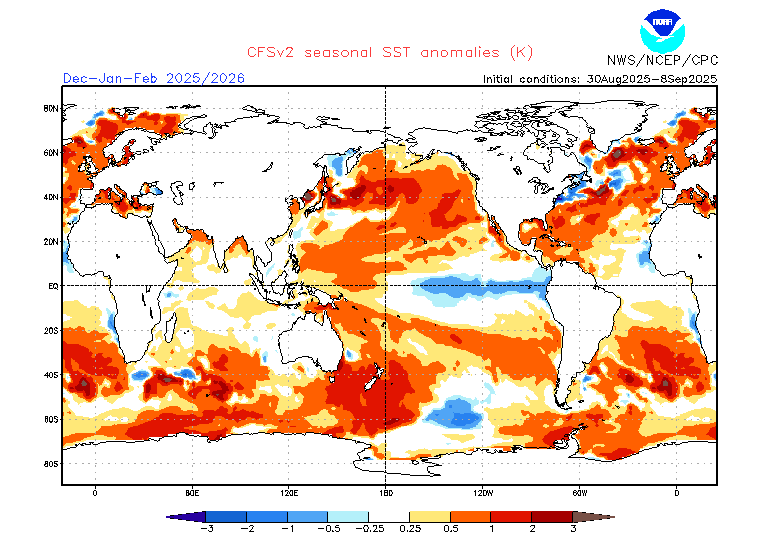
donsutherland1 replied to 40/70 Benchmark's topic in Weather Forecasting and Discussion
Assuming that the SSTs will drive the pattern, he would need big changes from what is forecast for Winter 2025-26 to be similar to that for Winter 2013-14. The core of the warm anomalies would need to shift much farther east. 2013-14 Current Forecast (ECMWF): Current Forecast (CFSv2):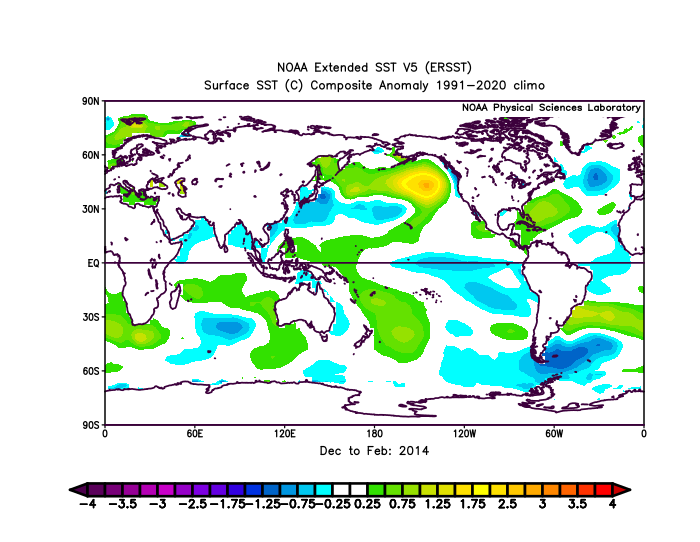
-
September 2025 OBS-Discussion centered NYC subforum
donsutherland1 replied to wdrag's topic in New York City Metro
White Plains recorded a low of 53° this morning, its second consecutive day with a low of 53° or below. 2025 has now seen two stretches of at least two consecutive lows of 53° or below through September 9th (August 30-31 and September 8-9). The last time that happened was in 2017 (September 1-2 and September 8-9). Since August 1, White Plains has had 20 days with lows of 59° or below. That is the most since 1994 and tied with 1962 and 1987 for the fourth most. Most Days with Lows < 60° (August 1-September 9): 1. 22, 1964 and 1994 3. 21, 1957 4. 20, 1962, 1987, 2025 7. 19, 1982 8. 18, 1986 9. 17, 1972, 1988, 1997 -
September 2025 OBS-Discussion centered NYC subforum
donsutherland1 replied to wdrag's topic in New York City Metro
Much of the region saw its chilliest morning so far this season. Low temperatures included: Binghamton: 44° Bridgeport: 50° Caldwell: 49° Danbury: 44° Farmingdale: 55° Hartford: 45° Islip: 58° Montgomery: 43° New Haven: 50° New York City-Central Park: 56° New York City-JFK Airport: 56° New York City-LaGuardia Airport: 60° Newark: 55° Philadelphia: 56° Poughkeepsie: 44° Trenton: 51° White Plains: 49° (earliest season first 40s since 2001) Temperatures will mainly top out in the 70s during the daytime and fall into the 50s at nighttime in New York City through at least Wednesday. Thursday could be briefly warmer with highs in the upper 70s to perhaps lower 80s. A shower or thundershower is possible on Wednesday as warm front moves across the region and Thursday as a cold front pushes through. The ENSO Region 1+2 anomaly was -0.3°C and the Region 3.4 anomaly was -0.4°C for the week centered around August 27. For the past six weeks, the ENSO Region 1+2 anomaly has averaged +0.33°C and the ENSO Region 3.4 anomaly has averaged -0.32°C. La Niña conditions will likely develop during mid- or late-autumn. The SOI was +0.06 today. The preliminary Arctic Oscillation (AO) was +0.073 today. Based on sensitivity analysis applied to the latest guidance, there is an implied near 61% probability that New York City will have a cooler than normal September (1991-2020 normal). September will likely finish with a mean temperature near 68.1° (1.1° below normal). Supplemental Information: The projected mean would be 0.1° above the 1981-2010 normal monthly value. -
September 2025 OBS-Discussion centered NYC subforum
donsutherland1 replied to wdrag's topic in New York City Metro
No. I checked. -
September 2025 OBS-Discussion centered NYC subforum
donsutherland1 replied to wdrag's topic in New York City Metro
The temperature dipped to 49° at White Plains this morning. Last year's first low in the 40s occurred on September 9. That is the earliest season low in the 40s since 2001 when the temperature fell to 49° on July 3. -
September 2025 OBS-Discussion centered NYC subforum
donsutherland1 replied to wdrag's topic in New York City Metro
FYI, the NWS has added the rainfall amounts that were missing for both August and yesterday for Bridgeport. The region benefits from its high quality and responsive NWS office.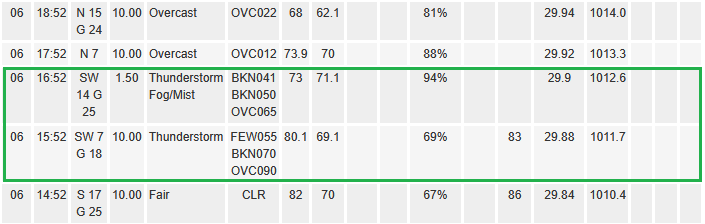
-
September 2025 OBS-Discussion centered NYC subforum
donsutherland1 replied to wdrag's topic in New York City Metro
As of 4 pm, Central Park had a high of 68°. Should Central Park have a high of 69° or below, it would be the first time New York City has seen a high in the 60s during the first week of September since September 6, 2019 when the mercury topped out at 67°. Yesterday, Central Park received 1.01" of rain, its first 1.00" or above daily rainfall since July 14. Additional rain fell today. Two-day rainfall amounts across the region included: Islip: 0.77" New Haven: 1.39" New York City-Central Park: 1.64" New York City-JFK Airport: 0.99" New York City-LaGuardia Airport: 1.56" Newark: 0.89" White Plains: 1.56" Temperatures will mainly top out in the 70s during the daytime and fall into the 50s at nighttime in New York City through at least Wednesday. Thursday could be briefly warmer with highs in the upper 70s to perhaps lower 80s. Additional showers or rain is possible on Thursday, as another cold front crosses the region. The ENSO Region 1+2 anomaly was -0.3°C and the Region 3.4 anomaly was -0.4°C for the week centered around August 27. For the past six weeks, the ENSO Region 1+2 anomaly has averaged +0.33°C and the ENSO Region 3.4 anomaly has averaged -0.32°C. La Niña conditions will likely develop during mid- or late-autumn. The SOI was +6.95 today. The preliminary Arctic Oscillation (AO) was -0.932 today. Based on sensitivity analysis applied to the latest guidance, there is an implied near 59% probability that New York City will have a cooler than normal September (1991-2020 normal). September will likely finish with a mean temperature near 68.2° (1.0° below normal). Supplemental Information: The projected mean would be 0.2° above the 1981-2010 normal monthly value. -
September 2025 OBS-Discussion centered NYC subforum
donsutherland1 replied to wdrag's topic in New York City Metro
Years with one or more 90° temperatures on or after the fall equinox for select New York City Area locations: Bridgeport: 1970 Islip: 1980 New York City-Central Park: 1881, 1895, 1914, 1927, 1933, 1938, 1939, 1941, 1959, 1961, 1970, 1980, 2017, 2019 New York City-JFK Airport: 1970, 1980, 2007, 2017, 2019 New York City-LaGuardia Airport: 1941, 1946, 1970, 1980, 1998, 2007, 2010, 2017, 2019 Newark: 1881, 1895, 1908, 1914, 1938, 1939, 1941, 1949, 1958, 1959, 1961, 1968, 1970, 1980, 1998, 2007, 2010, 2016, 2017, 2019 White Plains: 1970, 2017, 2019 -
September 2025 OBS-Discussion centered NYC subforum
donsutherland1 replied to wdrag's topic in New York City Metro
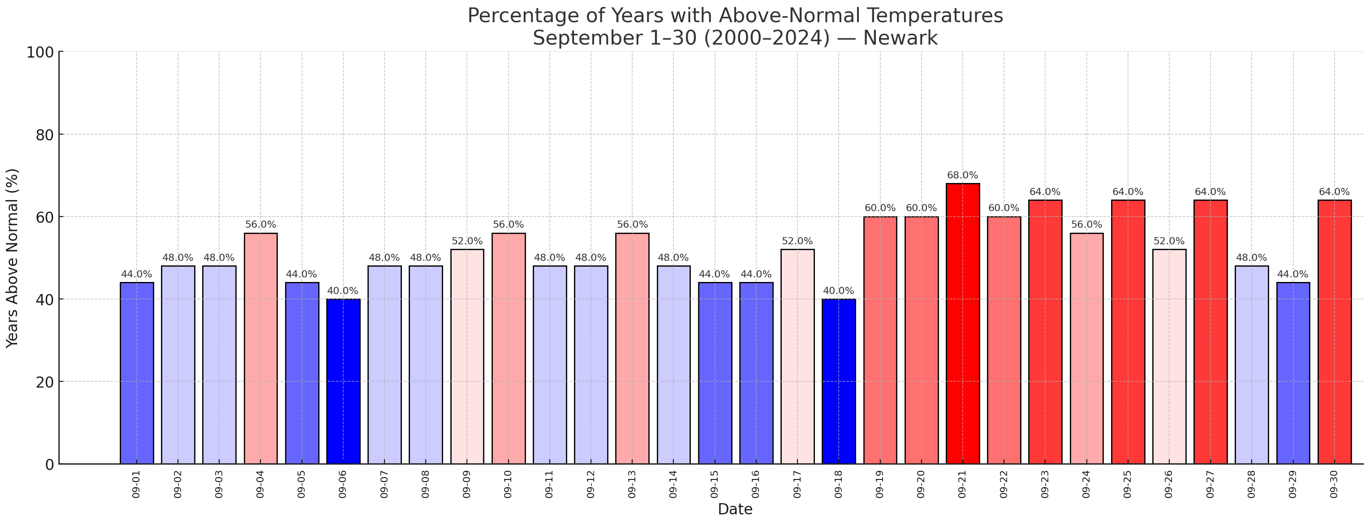
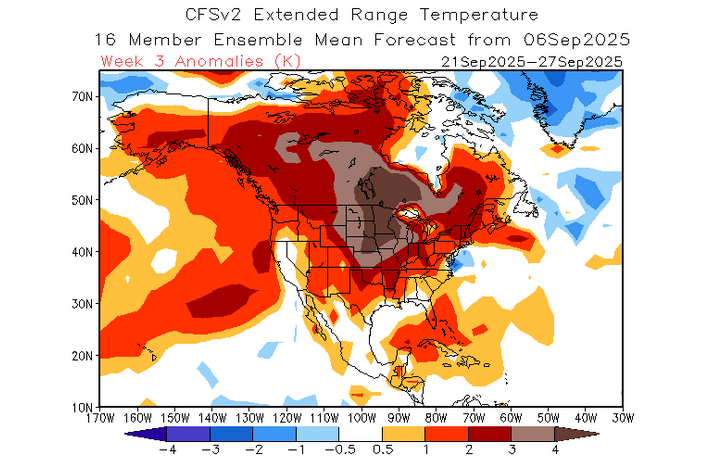
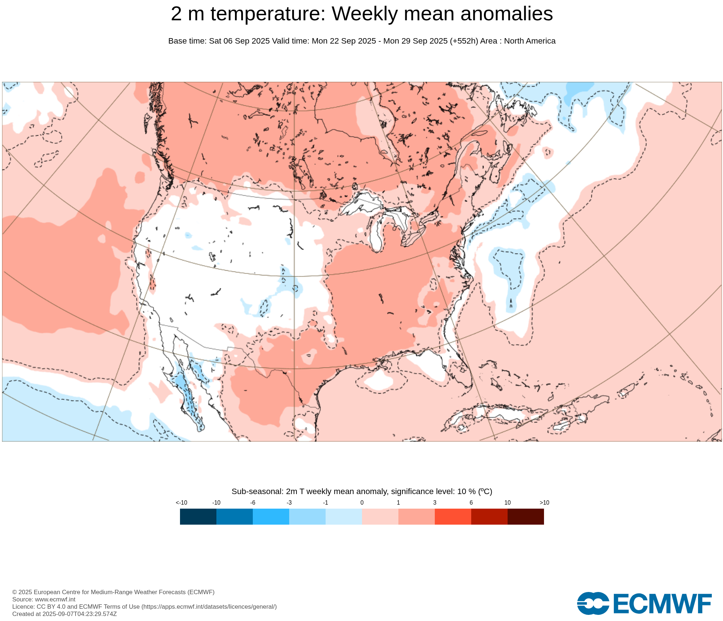
It should also be noted that since 2000, there has been a tendency for Newark's above normal days to be backloaded in September (relative to the 1991-2020 baseline): That doesn't mean that this year will be the case, but the idea that there could be much warmer air in the Plains States/Midwest toward mid-month suggests that it's something to watch for should the guidance continue to show such warmth in the Plains States/Midwest. The Week 3 outlooks on the ECMWF Weeklies and the CFSv2 are warmer than normal in the Northeast: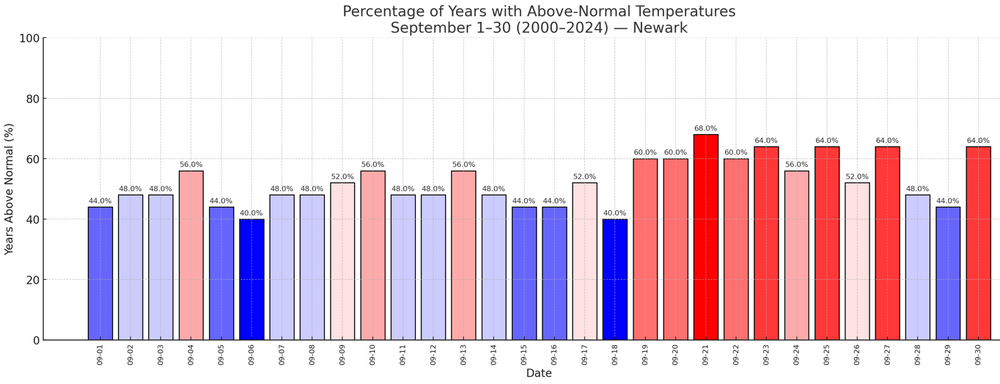
-
September 2025 OBS-Discussion centered NYC subforum
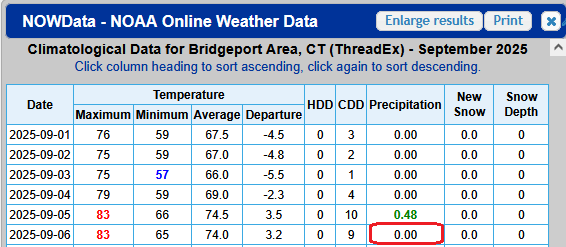
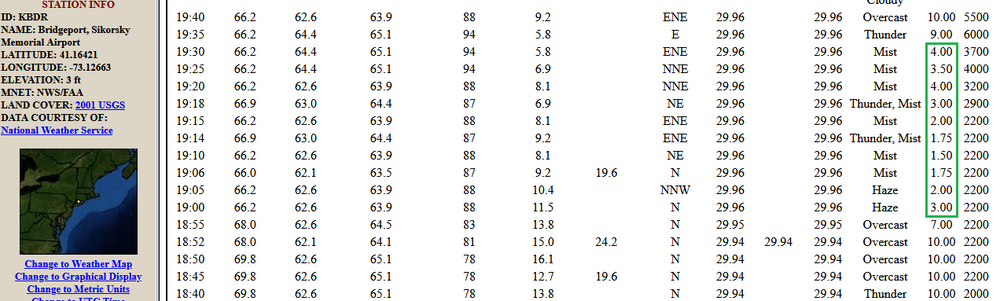
donsutherland1 replied to wdrag's topic in New York City Metro
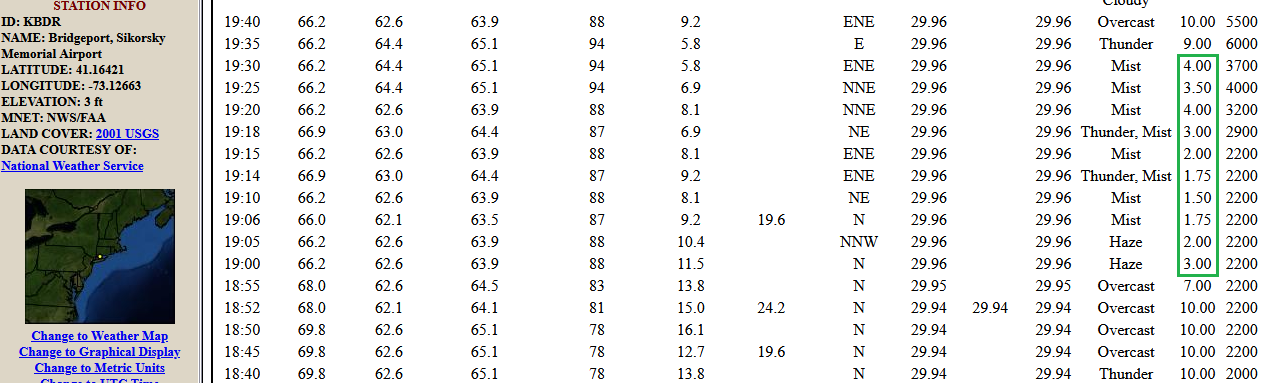
For the second time in less than a month, Bridgeport is not reporting its precipitation. Yesterday's hourly data: The lowered visibilities are consistent with falling rain: Yesterday's NOWData: In sum,Bridgeport had measurable rainfall yesterday. That data was not recorded. So far, today's rainfall has also not been measured.