donsutherland1
-
Posts
23,763 -
Joined
Content Type
Profiles
Blogs
Forums
American Weather
Media Demo
Store
Gallery
Everything posted by donsutherland1
-
As an example of how convective rainfall can drench areas while others see little rainfall, July 28, 2012 saw 2.98” fall at Islip and just 0.07” at JFK Airport.
-
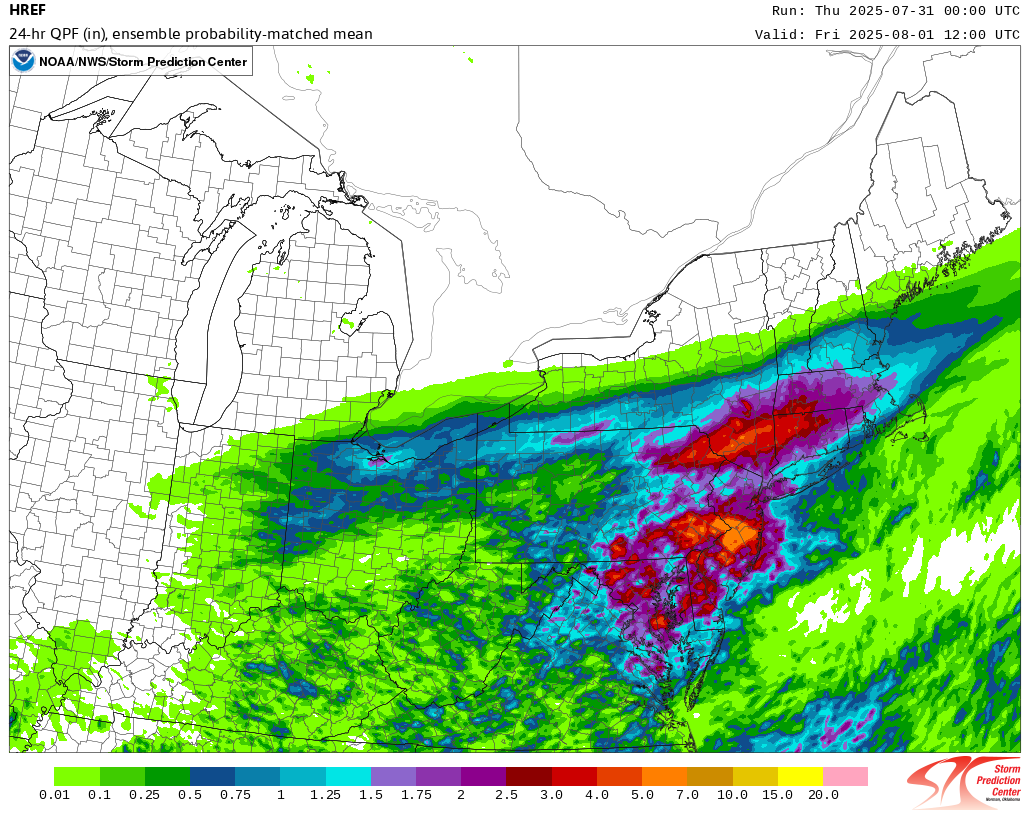
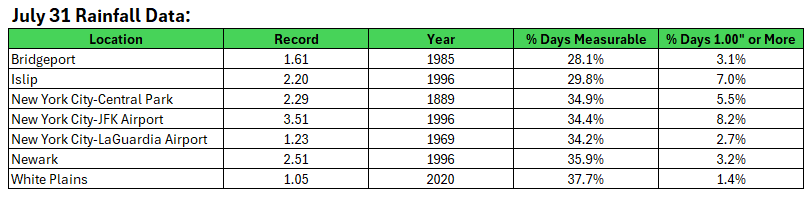
Islip has seen 1" or more of rain for the second consecutive hour. The daily rainfall has reached 2.69", which breaks the record of 2.20" from 1996. Flash flooding is very likely occurring in parts of Suffolk County.
-
July 2025 Discussion-OBS - seasonable summer variability
donsutherland1 replied to wdrag's topic in New York City Metro
Temperatures rose above modeled levels today on account of lower-than-expected cloud cover ahead of a slowly advancing front. High temperatures included: Bridgeport: 87° Islip: 89° New York City-Central Park: 89° New York City-JFK Airport: 91° New York City-LaGuardia Airport: 87° Newark: 91° Philadelphia (93°) reached 90° or above for a record-tying 21st day this month. A break in the heat is now imminent. A front will cross the region this evening triggering additional scattered showers and thundershowers. Some of the rain could be heavy. Behind the front, it will turn cooler for an extended period of time. Generally somewhat cooler than normal conditions will likely persist through the first week of August. There are hints on the long-range guidance that a new round of heat could develop past August 10th. The ENSO Region 1+2 anomaly was +0.6°C and the Region 3.4 anomaly was -0.2°C for the week centered around July 23. For the past six weeks, the ENSO Region 1+2 anomaly has averaged +0.48°C and the ENSO Region 3.4 anomaly has averaged 0.00°C. Neutral ENSO conditions will likely continue through the summer. The SOI was +10.59 today. The preliminary Arctic Oscillation (AO) was -0.240 today. -
Be careful. Hopefully, the worst will avoid you.
-
E PA/NJ/DE Summer 2025 Obs/Discussion
donsutherland1 replied to Hurricane Agnes's topic in Philadelphia Region
In the past hour, Reading picked up 2.47" (62.7 mm) of rain. That sets a new July hourly mark and is the third highest hourly figure on record. Reading's daily total of 2.67" (67.8 mm) breaks the July 31 daily mark of 2.56" (65.0 mm) set way back in 1887. -
Unfortunately, I have no PNS data.
-
July 2025 Discussion-OBS - seasonable summer variability
donsutherland1 replied to wdrag's topic in New York City Metro
Flood watches were posted starting in the afternoon. -
July 2025 Discussion-OBS - seasonable summer variability
donsutherland1 replied to wdrag's topic in New York City Metro
It's there right now, but the question is whether it will hold, as the lowest temperature will occur near 1 am EDT. -
E PA/NJ/DE Summer 2025 Obs/Discussion
donsutherland1 replied to Hurricane Agnes's topic in Philadelphia Region
#Philadelphia has reached 90° for the 21st time this month. That ties the July record for most such days. The record was set in 1952 and 1988, 1995, 2011, 2012, and 2020. -
July 2025 Discussion-OBS - seasonable summer variability
donsutherland1 replied to wdrag's topic in New York City Metro
JFK Airport is on track to be warmer than Central Park in July by its largest margin on record. The existing record is 0.3° in 1969 (JFK: 75.0°, Central Park: 74.7°). -
July 2025 Discussion-OBS - seasonable summer variability
donsutherland1 replied to wdrag's topic in New York City Metro
Ben is an invaluable source of weather information. Even when he was working in New Zealand, he often posted informative weather information (frequently focused on the Hudson Valley). -
For reference: Central Park's daily rainfall record for July 31 is 2.29", which was set way back in 1889. Central Park has seen 0.50" or above hourly amounts five times on July 31: 0.88", 1925 and 1942 0.81", 2016 0.74", 1961 0.56", 1996 It remains to be seen whether Central Park will see 1.00" or more hourly rainfall today for the first time on July 31. July 28-30 and August 1-4 have all seen 1.00" or more hourly rainfall.
-
July 2025 Discussion-OBS - seasonable summer variability
donsutherland1 replied to wdrag's topic in New York City Metro
Here's a gift link so that anyone can read the article: https://wapo.st/4mdOi2m -
July 2025 Discussion-OBS - seasonable summer variability
donsutherland1 replied to wdrag's topic in New York City Metro
White Plains has reached 80° or above for the 30th day this month. That ties the July mark of 30 days, which was set in 2022. -
E PA/NJ/DE Summer 2025 Obs/Discussion
donsutherland1 replied to Hurricane Agnes's topic in Philadelphia Region
Philadelphia has reached 80° or above for the 31st day this month. That ties the July mark of 31 days. It is also the third consecutive year with 31 such days. The old record of two consecutive years was set during 2010-2011. -
July 2025 Discussion-OBS - seasonable summer variability
donsutherland1 replied to wdrag's topic in New York City Metro
Bridgeport has now reached 80° this morning. That is the 29th 80° or above day this month. That ties the July record of 29 days, which was set in 1966 and tied in 1994. -
August DCA _ NYC _ BOS ___ ORD _ ATL _ IAH ___ DEN _ PHX _ SEA 0.3 0.5 0.6 0.4 0.2 0.2 1.6 2.1 2.2
-
July 2025 Discussion-OBS - seasonable summer variability
donsutherland1 replied to wdrag's topic in New York City Metro
Yesterday's low temperature of 80° at JFK Airport broke the daily mark of 79°. The old record was set in 1995 and tied in 2006. It was the second such low this year, which tied the all-time record of two days set in 1999 and tied in 2016. -
It’s available here: https://mesonet.agron.iastate.edu/wx/afos/list.phtml
-
July 2025 Discussion-OBS - seasonable summer variability
donsutherland1 replied to wdrag's topic in New York City Metro
Central Park (31 days) has tied its July record for most 80F (26.7C) or above days. In addition, July 2025 is the second consecutive July with 31 such days, which sets a new record for most consecutive years. The only other years were 1944, 2022 and 2024. -
July 2025 Discussion-OBS - seasonable summer variability
donsutherland1 replied to wdrag's topic in New York City Metro
JFK Airport (31 days) and Newark (31 days) have tied their July records for most 80F (26.7C) or above days. JFK Airport (2 consecutive years) and Newark (4 consecutive years) have their longest streaks of 31 80F (26.7C) or above July days. Neither site had ever had 2 consecutive such years before their current streaks. -
Low pressure moving along a nearly stationary front produced heavy thunderstorms with flash flooding in parts of the region. A snippet from the NWS: 000 TTAA00 KNYC 311600 FFWNYC NYC047-059-081-103-NYZ501-311800- BULLETIN - EAS ACTIVATION REQUESTED FLASH FLOOD WARNING AND SPECIAL MARINE WARNING NATIONAL WEATHER SERVICE NEW YORK NY 1200 PM EDT WED JUL 31 1996 THE NATIONAL WEATHER SERVICE IN NEW YORK HAS ISSUED A FLASH FLOOD WARNING AND SPECIAL MARINE WARNING EFFECTIVE UNTIL 200 PM EDT FOR THE PEOPLE IN THE FOLLOWING LOCATIONS... IN SOUTHEAST NEW YORK ...KINGS COUNTY...NASSAU COUNTY...QUEENS COUNTY ...WESTERN SUFFOLK COUNTY ...AND THE ADJACENT COASTAL WATERS A FLASH FLOOD WARNING IS NOW IN EFFECT FOR WESTERN SUFFOLK... NASSAU...QUEENS...AND KINGS COUNTIES UNTIL 2 PM. A SPECIAL MARINE WARNING IS ALSO IN EFFECT FOR THE COASTAL WATERS FROM SANDY HOOK TO MORICHES INLET UNTIL 2 PM. A STRONG LINE OF THUNDERSTORMS CONTINUES TO EFFECT THE WARNING AREA PRODUCING TORRENTIAL RAINS...AND DANGEROUS LIGHTNING. THESE THUNDERSTORMS HAVE CAUSED WIDESPREAD STREET...ROADWAY...AND BASEMENT FLOODING. AT 1200 PM THE HEAVIEST RAINS ARE OCCURRING OVER NASSAU COUNTY AND THE COASTAL WATERS SOUTH OF JONES BEACH. THE STORMS WILL EFFECT WESTERN SUFFOLK COUNTY AND ADJACENT WATERS SHORTLY. CONDITIONS WILL SLOWLY IMPROVE OVER QUEENS AND KINGS COUNTY BY 1 PM AS THE LINE OF THUNDERSTORMS MOVES EAST. THESE STORMS HAVE BEEN PRODUCING HEAVY FLOODING RAINS AND FREQUENT DANGEROUS LIGHTNING AND COULD PRODUCE GUSTY WINDS AND SMALL HAIL.
-
July 2025 Discussion-OBS - seasonable summer variability
donsutherland1 replied to wdrag's topic in New York City Metro
I suspect the changes in Atlantic and Pacific SSTAs have played a role in influencing synoptic patterns and their durability. Out in the Southwest, heat now locks in for longer durations. Heatwaves are more variable in the East (probably a combination of the patterns + wetter climate). Central Park notwithstanding, the region is having a hot summer so far.