donsutherland1
-
Posts
23,763 -
Joined
Content Type
Profiles
Blogs
Forums
American Weather
Media Demo
Store
Gallery
Everything posted by donsutherland1
-
The hourly guidance showed mostly cloudy skies this morning. The clouds should break late morning/early afternoon yielding to partly sunny skies.
-
Winter cancelled/uncancelled banter 25/26
donsutherland1 replied to Rjay's topic in New York City Metro
Congratulations and best wishes. -
Mountain West Discussion
donsutherland1 replied to mayjawintastawm's topic in Central/Western States
Today, the low temperature at Phoenix was only 76, its coolest since June 4 due to some monsoonal moisture. -
Tomorrow will turn cooler before it turns briefly warmer on Sunday. Highs on Sunday could reach the upper 80s. Parts of the region could reach the lower 90s. Noticeably cooler air will then overspread the region. High temperatures will likely reach the upper 70s Monday through Wednesday and then the lower 80s on Thursday. The extended range guidance increasingly suggests that the closing week of August could feature below normal temperatures. Precipitation could be near normal. The synoptic pattern should limit direct tropical cyclone threats for the foreseeable future. Impacts from elevated tides, surf, and rip currents would be the most likely effects produced by Erin as it tracks well offshore between the U.S. East Coast and Bermuda. The ENSO Region 1+2 anomaly was +0.8°C and the Region 3.4 anomaly was -0.3°C for the week centered around August 6. For the past six weeks, the ENSO Region 1+2 anomaly has averaged +0.50°C and the ENSO Region 3.4 anomaly has averaged -0.15°C. Neutral ENSO conditions will likely continue into early autumn. The SOI was -4.61 today. The preliminary Arctic Oscillation (AO) was -0.285 today. Based on sensitivity analysis applied to the latest guidance, there is an implied 57% probability that New York City will have a cooler than normal August (1991-2020 normal). August will likely finish with a mean temperature near 75.6° (0.5° below normal). Supplemental Information: The projected mean would be 0.4° above the 1981-2010 normal monthly value.
-
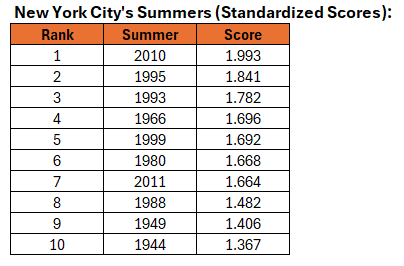
I ran the numbers for 1995 and 1993 where summer mean temperature was weighted at 50% and where the remaining 50% weight was equally divided among the other three variables. In that case, 1993 tops 1995. 2010 remains at the top.
-
Here's the breakdown: 1993: Mean Temperature Z-Score: 1.653 Max Temperature Z-Score: 1.638 Min Temperature Z-Score: 0.813 Number of 90°F+ Days Z-Score: 3.025 Summer Score: 1.782 1995: Mean Temperature Z-Score: 1.451 Max Temperature Z-Score: 1.638 Min Temperature Z-Score: 2.366 Number of 90°F+ Days Z-Score: 1.908 Summer Score: 1.841 All variables are equally weighted. Personally, I wouldn't give equal weight to each variable e.g.., I'd place greater weight on the summer mean temperature.
-
Here are the standardized scores for Central Park. I used the same criteria as for JFK Airport.
-
It's highly unlikely. Both LGA and Central Park had too few 90° or above days during 1948 and the summer mean was 0.4°-0.5° below that of 1949. Using just the 1948-2024 period, 1948 ranked 13 spots below 1949 at LGA and 19 spots below Central Park.
-
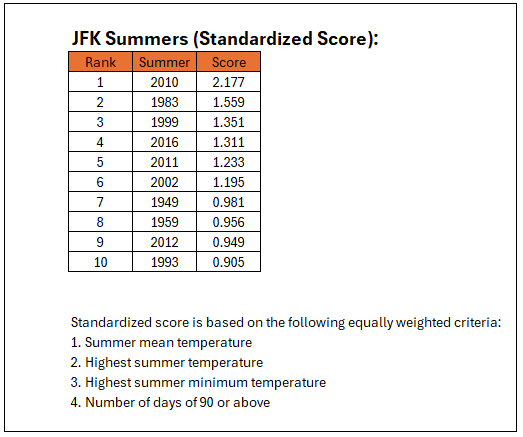
I cleaned up my typos. 1983 would remain second, but the difference between 2010 and 1983 would narrow were September added.
-
Adding September would still leave 1983 in second place, but the gap would narrow. The top five from most extreme to less extreme would be: 2010 (2.188), 1983 (1.762), 1999 (1.614), 2016 (1.297), and 2002 (1.232).
-
Mountain West Discussion
donsutherland1 replied to mayjawintastawm's topic in Central/Western States
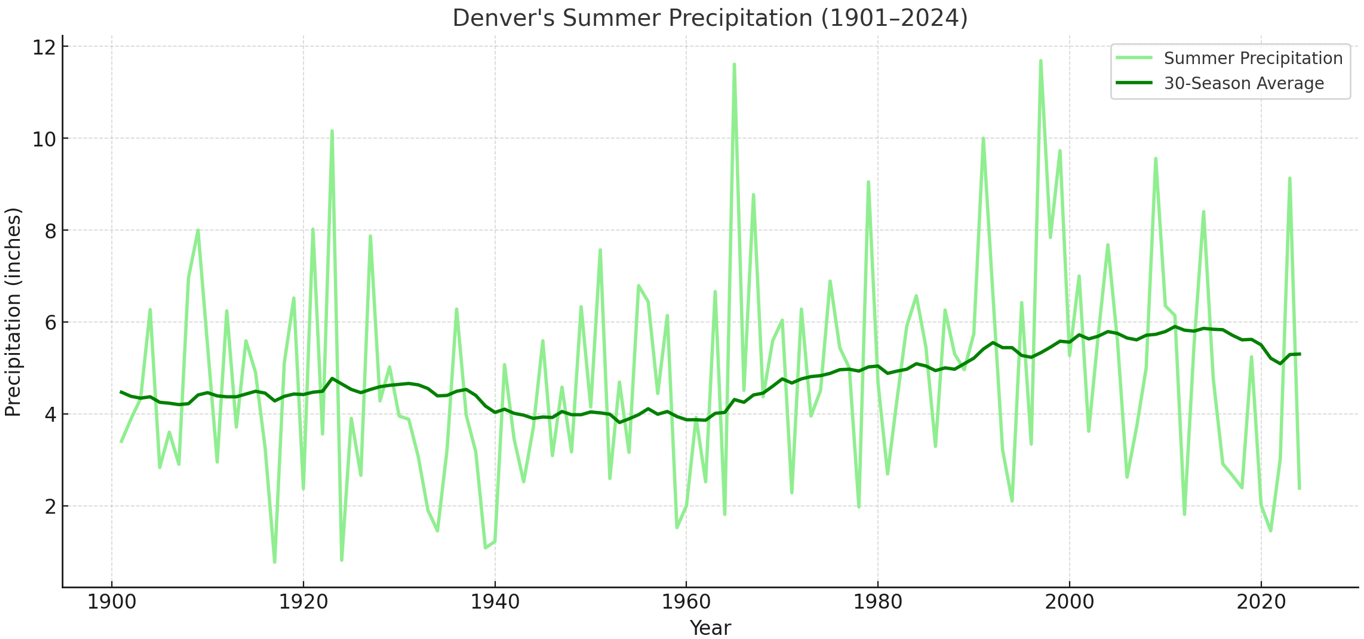
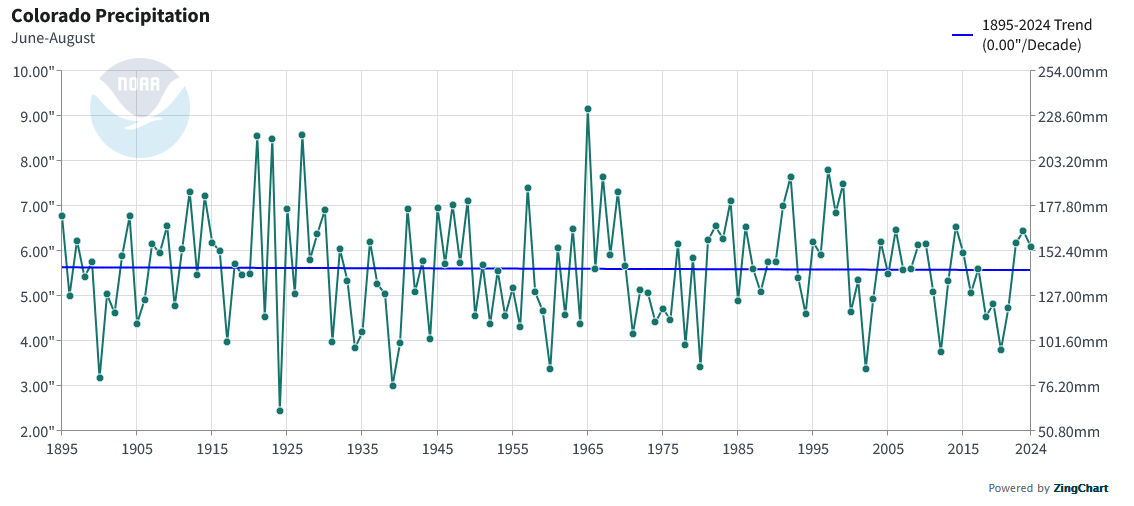
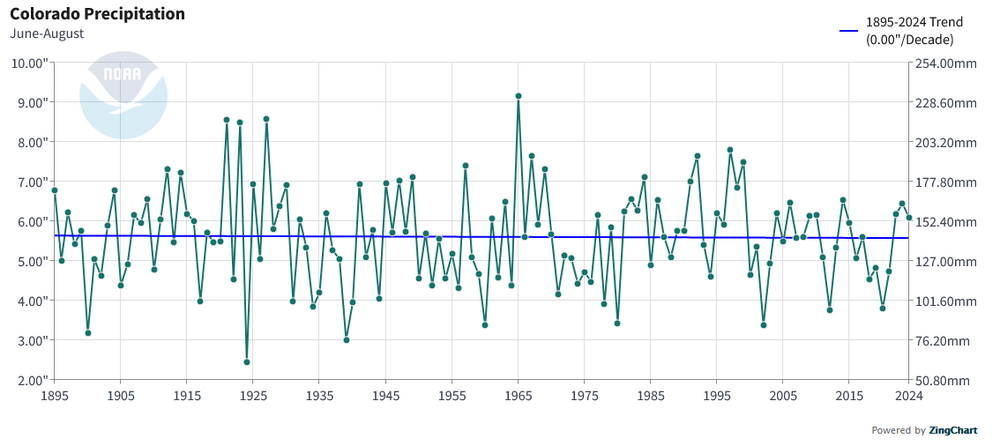
There's really no statewide trend in summer precipitation. Here are the precipitation-related charts for Denver and Colorado.
-
Occasional Thoughts on Climate Change
donsutherland1 replied to donsutherland1's topic in Climate Change
This was a very important paper--perhaps one of the most important weather/climate papers that will be published this year. It describes the mechanism by which climate change is driving Southwest aridification via marine heatwave-induced changes to the PDO. -
Central Park and Islip had identical high and low temperatures for the first time since May 16th. During the 1991-2020 period, they had identical high and low temperatures on an average of 6.6 days per year.
-
Yes. That’s true. I don’t have a sufficient base of daily dewpoint data to add it into the mix.
-
Mountain West Discussion
donsutherland1 replied to mayjawintastawm's topic in Central/Western States
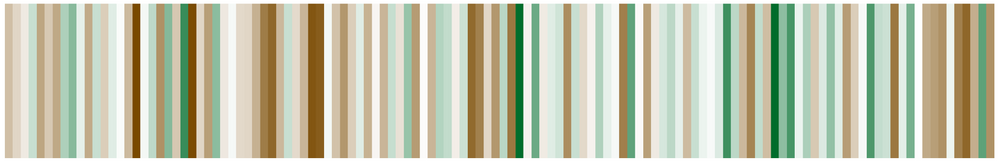
Denver reached 90° for the 40th time this year. Its warming climate has seen an explosion of years with a high number of 90° or above highs. The new regime of far more frequent 90° or above highs commenced in 2000. 2025 is on track for 50 or more such days. An Ed Hawkins-style warming stripes visualization of annual 90° days is below. Note: Both charts are for 1872-2024, as the 2025 total is not final. The outcome is consistent with Colorado's warming summers (0.2°F per decade over the historic climate period and 0.3°F/decade since 2000).


-
Here's a statistical ranking for JFK. The description is at the bottom of the chart. 1966 was 11th (pulled down by its relatively cool mean temperature and cool highest minimum temperature). Summer 1948 isn't listed, because about half the days (46) had no data. 2025 is currently battling for the third spot, but it will likely fade lower given the forecast for the second half of August.
-
Summer 1944 was somewhat cooler at Central Park (0.4°) and LaGuardia Airport (0.5°) than summer 1949.
-
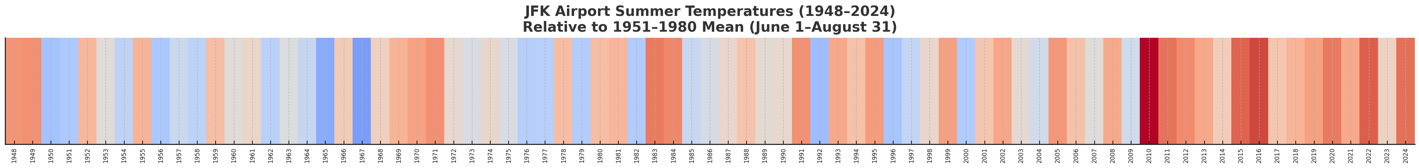
Here it is. Since the dataset goes back to 1948, I pegged the summer temperatures to the 1951-1980 mean (as in the NASA GISS record).

-
I thought it would be useful to provide greater context to how things are evolving. Some of the most extreme heatwaves occurred during summers that are relatively cool by recent standards i.e., 1966 and 1977. Even as some of the extreme heat has not occurred, the tradeoff has been summer warmth that is greater and more persistent. Of course, there have been some hot summers that fit both criteria e.g., 2010.
-
Tomorrow should be partly sunny. Clouds could become more numerous during the afternoon into the evening. We'll see how Saturday evolves.
-
Temperatures will likely top out in the middle and upper 80s across the region. Saturday will likely be somewhat cooler before it turns briefly warmer on Sunday. Noticeably cooler air will likely overspread the region early next week. High temperatures will likely reach the upper 70s and lower 80s during the first half of next week. The extended range guidance increasingly suggests that the closing week of August could feature below normal temperatures. Precipitation could be near normal. The synoptic pattern should limit direct tropical cyclone threats for the foreseeable future. Impacts from elevated tides, surf, and rip currents would be the most likely effects produced by Erin as it tracks well offshore between the U.S. East Coast and Bermuda. The ENSO Region 1+2 anomaly was +0.8°C and the Region 3.4 anomaly was -0.3°C for the week centered around August 6. For the past six weeks, the ENSO Region 1+2 anomaly has averaged +0.50°C and the ENSO Region 3.4 anomaly has averaged -0.15°C. Neutral ENSO conditions will likely continue into early autumn. The SOI was +0.18 today. The preliminary Arctic Oscillation (AO) was -0.342 today. Based on sensitivity analysis applied to the latest guidance, there is an implied 58% probability that New York City will have a cooler than normal August (1991-2020 normal). August will likely finish with a mean temperature near 75.6° (0.5° below normal). Supplemental Information: The projected mean would be 0.4° above the 1981-2010 normal monthly value.
-
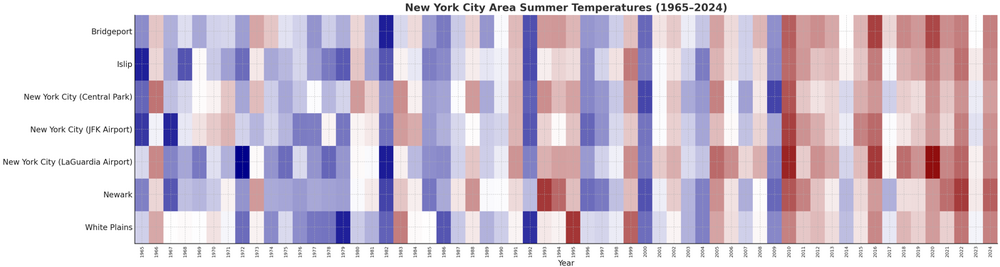
This outcome is consistent with the warming summers that the region has been experiencing. Warming is measured by summer mean temperature. I constructed a chart for seven regional sites for the last 60 years and pegged the shading to the median value for each site.
-
Occasional Thoughts on Climate Change
donsutherland1 replied to donsutherland1's topic in Climate Change
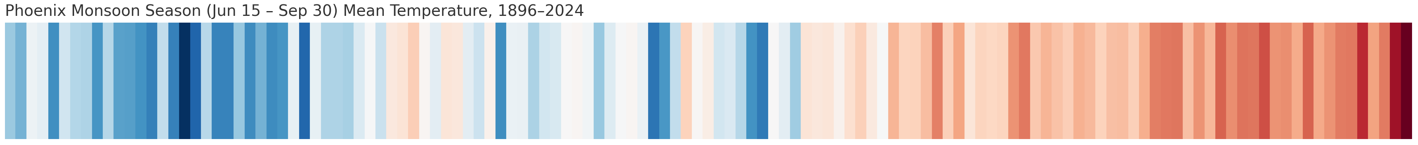
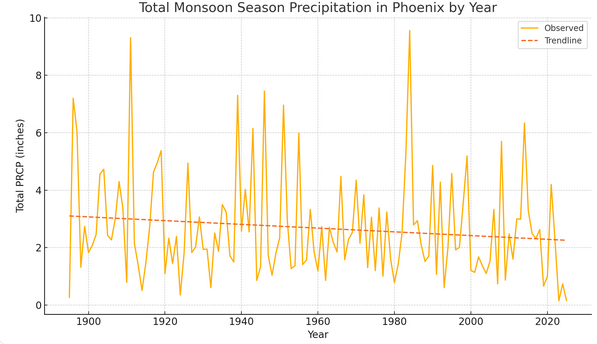
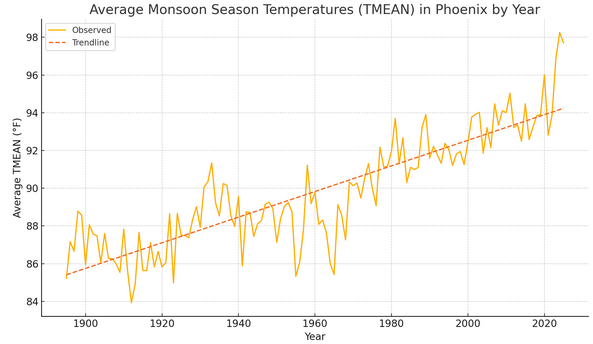
Phoenix's annual monsoon is changing in a warming climate. The most pronounced changes are fewer rainy days (days with measurable precipitation), reduced monsoon season precipitation, and a hotter monsoon season. The dramatic warming of the Monsoon Season shows up prominently in the Ed Hawkins-styled warming stripes: These developments are consistent with some of the literature concerning climate change and its impact on North America's monsoon season. Two examples: "It is found that the monsoon response to CO2 doubling is sensitive to sea-surface temperature biases. When minimizing these biases, the model projects a robust reduction in monsoonal precipitation over the southwestern United States, contrasting with previous multi-model assessments." Source: Pascale, S., Boos, W., Bordoni, S. et al. Weakening of the North American monsoon with global warming. Nature Clim Change 7, 806–812 (2017). https://doi.org/10.1038/nclimate3412 "Within climate science... focus has begun to include the growing role warming temperatures are playing as a potent driver of greater aridity: hotter climate extremes; drier soil conditions; more severe drought; and the impacts of hydrologic stress on rivers, forests, agriculture, and other systems. This shift in the hydrologic paradigm is most clear in the American Southwest..." Source: Overpeck, Jonathan T. and Udall, Bradley. Climate change and the aridification of North America. PNAS, Vol. 117, No. 22 (2020). https://www.pnas.org/doi/pdf/10.1073/pnas.2006323117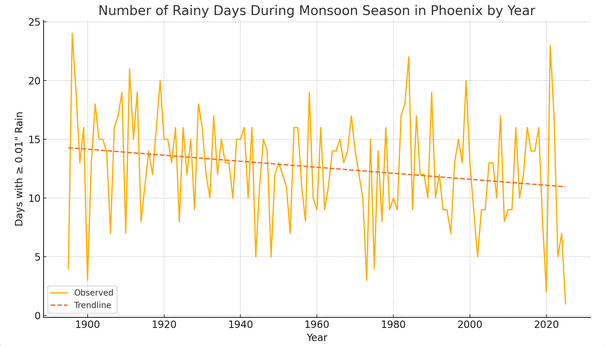

-
Yesterday was the first time since July 2, 2021 that saw Newark and White Plains pick up 1" or more of rain, while JFK Airport, LaGuardia Airport, and Central Park had less than 1" of rain. It was the first time where Bridgeport received no precipitation when Newark and White Plains picked up 1" or more of rain, while JFK Airport, LaGuardia Airport, and Central Park had less than 1" of rain.
-
White Plains picked up 1.12" of rain in the past hour.