donsutherland1
-
Posts
23,758 -
Joined
Content Type
Profiles
Blogs
Forums
American Weather
Media Demo
Store
Gallery
Everything posted by donsutherland1
-
For snowstorms, it's over. Finally. For daily snowfalls, it, unfortunately, continues.
-
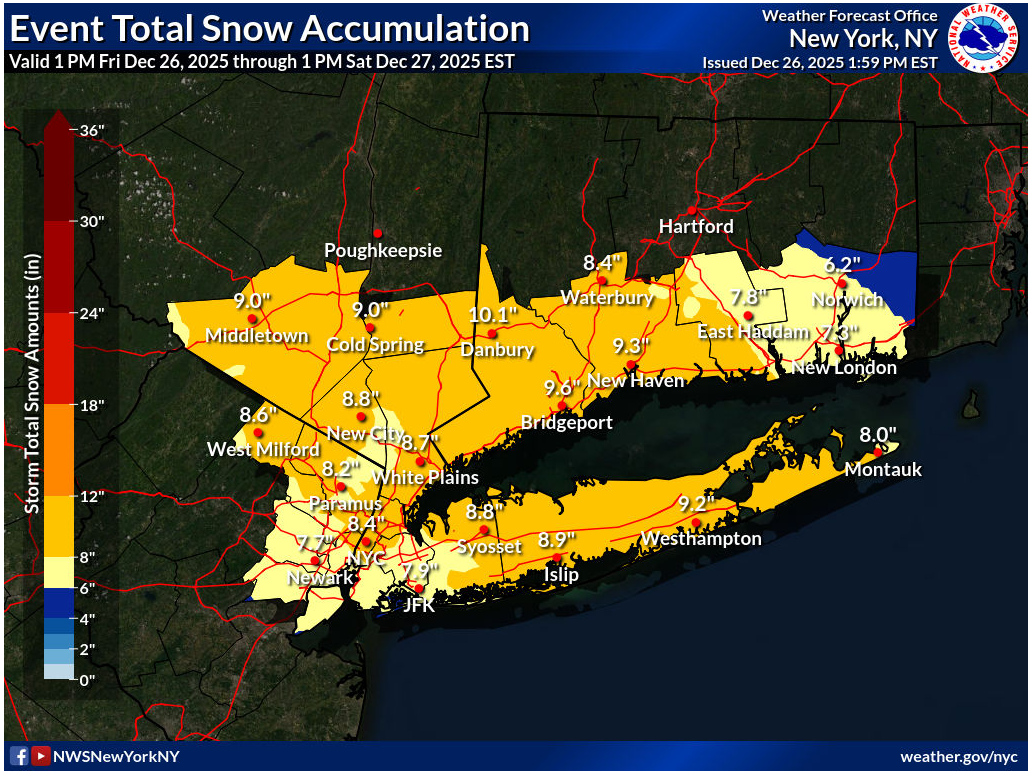
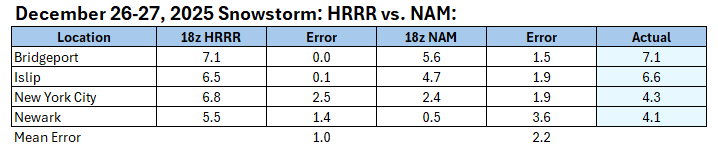
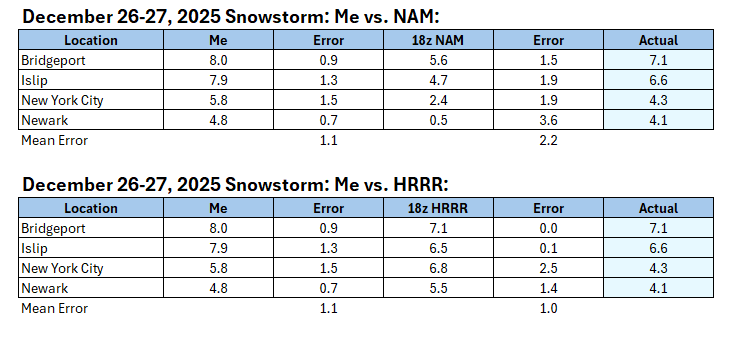
18z NAM vs. 18z HRRR: Here's how I fared against the two models: Final Accumulations: Bridgeport: 7.1" Islip: 6.6" New York City-Central Park: 4.3" New York City-JFK Airport: 4.1" New York City-LaGuardia Airport: 4.1" Newark: 4.2" The low end of the 4"-8" idea worked out. The loss of precipitation from the weak lift that developed in the spacing between the surface and mid-level low likely deprived the region of several inches of snow. It also allowed for some intrusion of sleet into the greater New York City area for a time until the lift improved.
-
655 NOUS41 KOKX 271249 PNSOKX CTZ005>012-NJZ002-004-006-103>108-NYZ067>075-078>081-176>179-280049- Public Information Statement National Weather Service New York NY 749 AM EST Sat Dec 27 2025 ...SNOWFALL REPORTS... Location Amount Time/Date Provider ...Connecticut... ...Fairfield County... 4 NNW New Fairfield 9.1 in 0409 AM 12/27 Trained Spotter Bridgeport Airport 7.1 in 0700 AM 12/27 Official NWS Obs 2 ENE New Canaan 7.1 in 0528 AM 12/27 Trained Spotter Bethel 6.5 in 0700 AM 12/27 Emergency Mngr 4 SSE Easton 6.2 in 0600 AM 12/27 Public 1 W Stamford 5.9 in 0605 AM 12/27 Trained Spotter 1 NNW Stamford 5.7 in 0100 AM 12/27 Trained Spotter ...Middlesex County... Clinton 8.0 in 0645 AM 12/27 Broadcast Media 1 SW Westbrook 7.7 in 0240 AM 12/27 Trained Spotter ...New Haven County... 1 NNW Meriden 9.0 in 0350 AM 12/27 Trained Spotter 1 ENE North Haven 7.7 in 1220 AM 12/27 Trained Spotter 2 NW Hamden 7.3 in 0647 AM 12/27 Public 4 SSE Durham 7.1 in 0200 AM 12/27 Public 3 ENE Branford 6.5 in 0647 AM 12/27 Public 3 ENE Branford 6.4 in 1201 AM 12/27 Public 1 NW Ansonia 6.0 in 0531 AM 12/27 Public ...New London County... 5 SSE Salem 7.0 in 0603 AM 12/27 Public New London 6.5 in 1139 PM 12/26 Trained Spotter Ledyard Center 5.5 in 0100 AM 12/27 Trained Spotter ...New Jersey... ...Bergen County... 1 S River Edge 3.3 in 0720 AM 12/27 Public 2 NNE Franklin Lakes 3.2 in 0138 AM 12/27 Public ...Essex County... 2 NE Springfield 3.0 in 0400 AM 12/27 Public 1 NW Newark 2.3 in 1226 AM 12/27 Public ...Hudson County... Harrison 4.0 in 0442 AM 12/27 CO-OP Observer Hoboken 3.9 in 0700 AM 12/27 Trained Spotter ...Union County... Newark Airport 4.2 in 0700 AM 12/27 Official NWS Obs 1 NW Cranford 3.0 in 0717 AM 12/27 Public 1 NE Union 3.0 in 0200 AM 12/27 Public ...New York... ...Bronx County... 1 NNE Fordham 4.3 in 0400 AM 12/27 Public ...Kings County... 1 SSE Williamsburg 4.3 in 0715 AM 12/27 Public 1 N Bay Ridge 3.1 in 0603 AM 12/27 Public ...Nassau County... Massapequa 4.1 in 0700 AM 12/27 Amateur Radio 1 N Centre Island 4.0 in 0529 AM 12/27 Public 1 SW Levittown 4.0 in 0202 AM 12/27 Public Carle Place 3.1 in 0645 AM 12/27 Amateur Radio 1 SW Elmont 2.0 in 1250 AM 12/27 Trained Spotter ...New York (Manhattan) County... Central Park 4.3 in 0700 AM 12/27 Official NWS Obs ...Orange County... 2 SSW Stewart Airport 5.7 in 0724 AM 12/27 Public 2 E Highland Mills 5.2 in 0130 AM 12/27 Public 2 NW Stewart Airport 5.0 in 0628 AM 12/27 Amateur Radio Monroe 5.0 in 0500 AM 12/27 Trained Spotter 2 SSW Stewart Airport 5.0 in 1212 AM 12/27 3 WNW Warwick 4.0 in 0603 AM 12/27 Trained Spotter ...Putnam County... 2 W Putnam Valley 5.7 in 0605 AM 12/27 NWS Employee ...Queens County... 1 WSW Howard Beach 4.6 in 0701 AM 12/27 Broadcast Media NYC/JFK 4.1 in 0700 AM 12/27 Official NWS Obs NYC/La Guardia 4.1 in 0700 AM 12/27 Official NWS Obs ...Suffolk County... Babylon 7.5 in 0645 AM 12/27 Amateur Radio Orient 7.5 in 0615 AM 12/27 Trained Spotter North Patchogue 6.8 in 0109 AM 12/27 Public Islip Airport 6.6 in 0700 AM 12/27 Official NWS Obs Upton (NWS Office) 6.5 in 0700 AM 12/27 Official NWS Obs Stony Brook 5.8 in 0700 AM 12/27 Trained Spotter 1 WNW Sound Beach 5.8 in 0700 AM 12/27 Public 2 E Flanders 5.8 in 1120 PM 12/26 Public 1 SSE Bohemia 5.6 in 0550 AM 12/27 Trained Spotter 2 SE Ridge 5.6 in 1159 PM 12/26 NWS Employee Deer Park 5.3 in 0600 AM 12/27 Trained Spotter 1 WSW Poquott 5.2 in 0425 AM 12/27 NWS Employee Sayville 5.1 in 0700 AM 12/27 NWS Employee 1 ESE East Patchogue 5.1 in 0541 AM 12/27 NWS Employee 1 SSE Bohemia 4.7 in 1205 AM 12/27 Public 2 S Commack 4.5 in 0145 AM 12/27 Public 1 N Smithtown 4.3 in 1200 AM 12/27 Trained Spotter Stony Brook 4.3 in 1155 PM 12/26 Trained Spotter 1 ENE Commack 4.0 in 1140 PM 12/26 Broadcast Media 1 E Kings Park 3.6 in 1259 AM 12/27 Public Medford 3.5 in 0723 AM 12/27 Amateur Radio ...Westchester County... Armonk 6.4 in 0200 AM 12/27 Trained Spotter 2 ENE Peekskill 6.1 in 1200 AM 12/27 Trained Spotter 1 E Pelham Manor 2.8 in 0736 AM 12/27 Public
-
Snow/sleet mixture.
-
At 7 pm. It’s probably around 2”-3”.
-
Light sleet in Larchmont.
-
Thank you, Volcanic Winter.
-
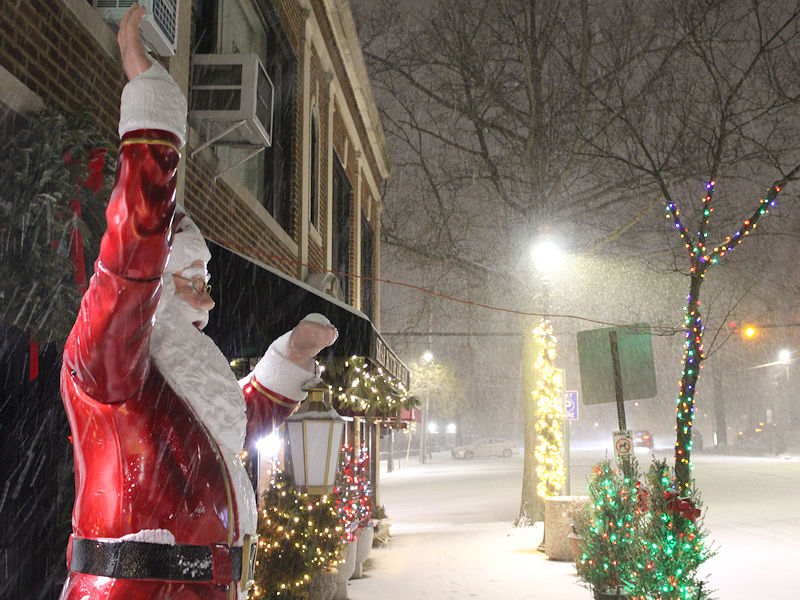
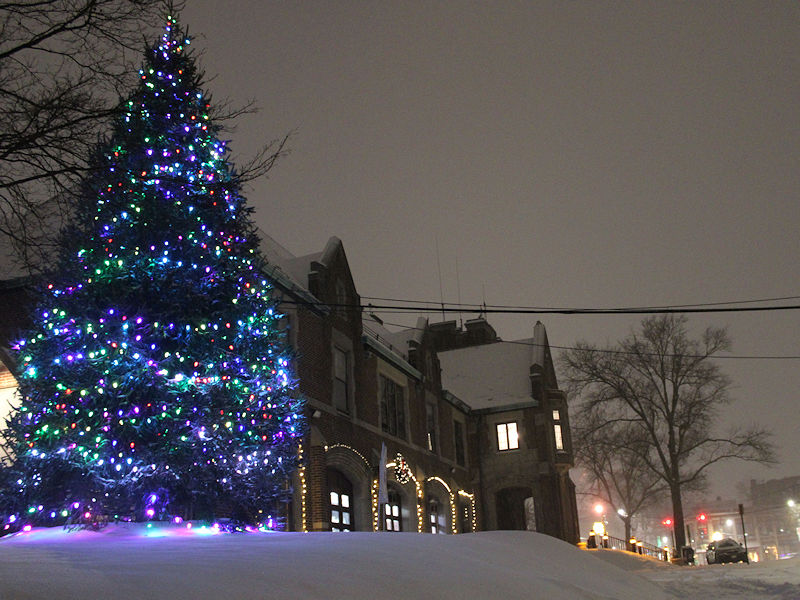
Two photos from this evening:
-
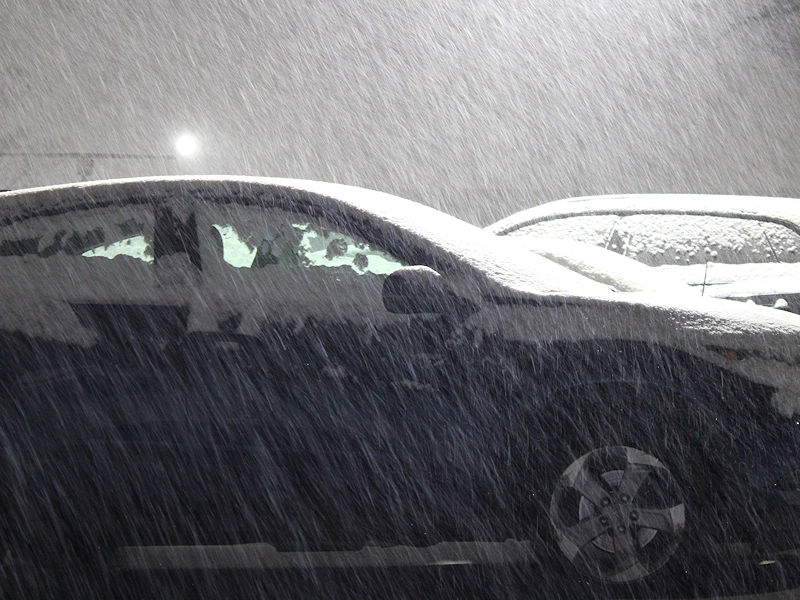
Moderate to heavy snow has developed in the Larchmont area.
-
0.5" in Larchmont, NY.
-
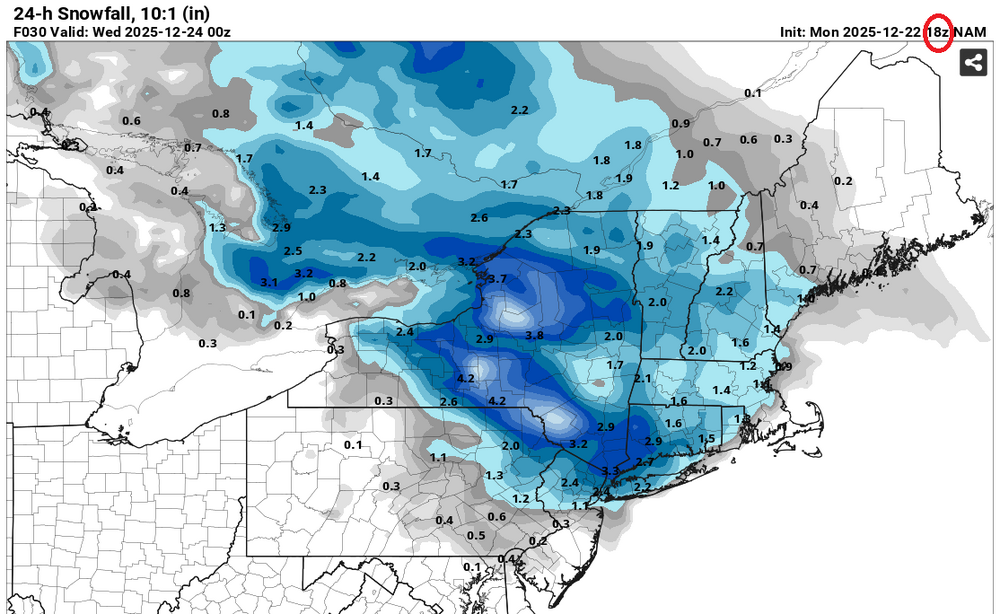
First NAM bust incoming... According to the 12/26 18z NAM (using four algorithms on Bufkit), 1.2"-1.5" of snow was expected at Binghamton before the transition to several hours of sleet. Binghamton has seen snowfall approaching 3.0" as of 5:05 pm with moderate continuing snow to fall.
-
Light-to-moderate snow in Larchmont. The ground is coated.
-
Light snow has reached Larchmont in southern Westchester County.
-
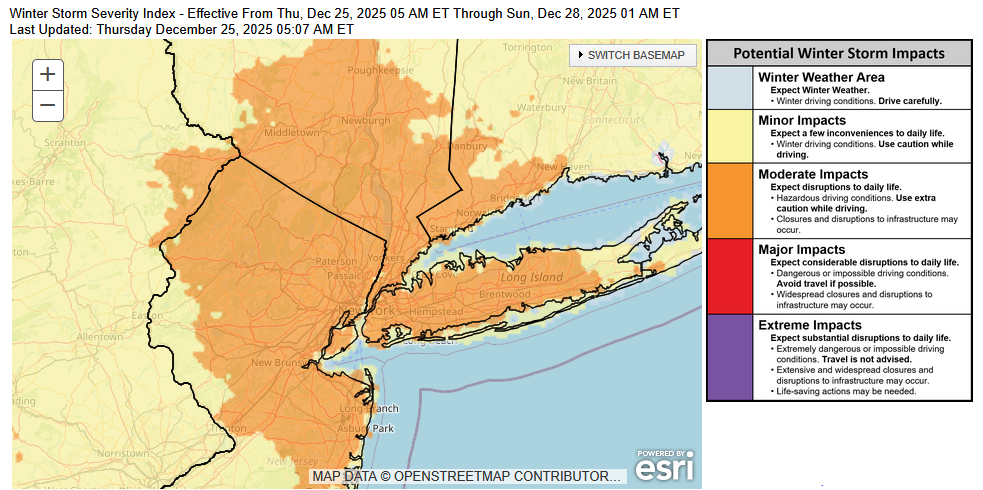
Snow is now approaching the New York City region. Snow is currently falling in northeastern Pennsylvania, parts of southeastern New York State and extreme northwestern New Jersey. The snow will fall moderately to even heavily for a time during the first half of tonight. Sleet or freezing rain could mix in toward the end of the storm in parts of the region. A general 4"-8" snowfall is likely in and around the New York City area. Some locally higher amounts are possible. Areas to the south and west of New York City will see a larger share of precipitation fall as sleet. As a result from central New Jersey southward, snow accumulations will be noticeably lower. Philadelphia could pick up a coating to 2" of mainly sleet. The storm will be followed by a chilly weekend. A storm cutting to the Great Lakes could bring some rain and milder weather on Monday before cold air returns to close out December. The closing days of December will likely be colder than normal. December 2025 will very likely finish with a maximum monthly temperature below 60° in New York City. The last time that happened was in 2019 when the monthly high was 58°. If 2025 has a monthly high below 60°, that would be only the fifth such occurrence since 2000 (2003, 2004, 2005, and 2019 are the cases since 2000). The ENSO Region 1+2 anomaly was -0.6°C and the Region 3.4 anomaly was -0.8°C for the week centered around December 17. For the past six weeks, the ENSO Region 1+2 anomaly has averaged -0.40°C and the ENSO Region 3.4 anomaly has averaged -0.68°C. La Niña conditions will likely continue through at least mid-winter. The SOI was -0.88 today. The preliminary Arctic Oscillation (AO) was -0.705 today. Based on sensitivity analysis applied to the latest guidance, there is an implied near 100% probability that New York City will have a cooler than normal December (1991-2020 normal). December will likely finish with a mean temperature near 34.0° (5.1° below normal). That will make December 2025 the coldest December since 2010 when the monthly mean temperature was 32.8°. It would also make 2025 the third coldest December since 2000. Supplemental Information: The projected mean would be 3.4° below the 1981-2010 normal monthly value.
-
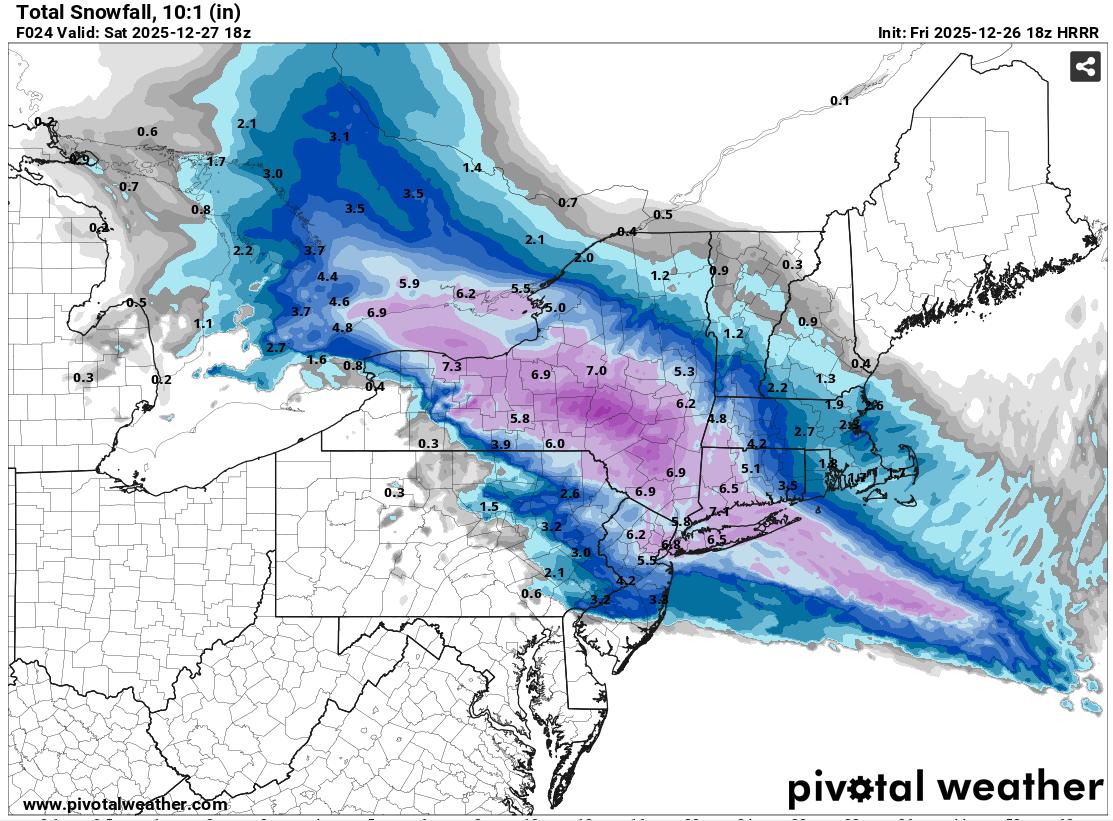
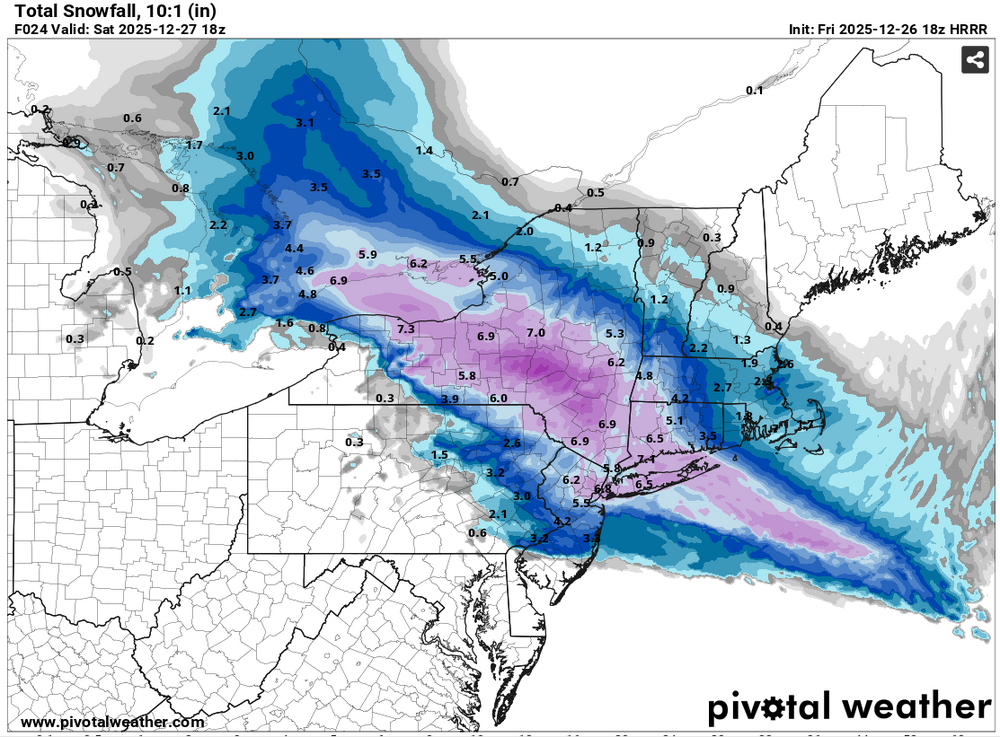
I'll do the 18z HRRR, too. I think that model is often cold-biased, but let's see how it does. 18z HRRR. I will also compare the 18z NAM and 18z HRRR. My point estimates: Bridgeport: 8.0" Islip: 7.9" New York City (Central Park): 5.8" Newark: 4.8"
-
For fun, let's compare the 18z NAM with the NWS for select locations that provide snowfall reports: 18z NAM: NWS Forecast: I will be looking at the other 18z guidance. For now, I still think a general 4"-8" snowfall is likely in and around New York City (including all of the above locations).


-
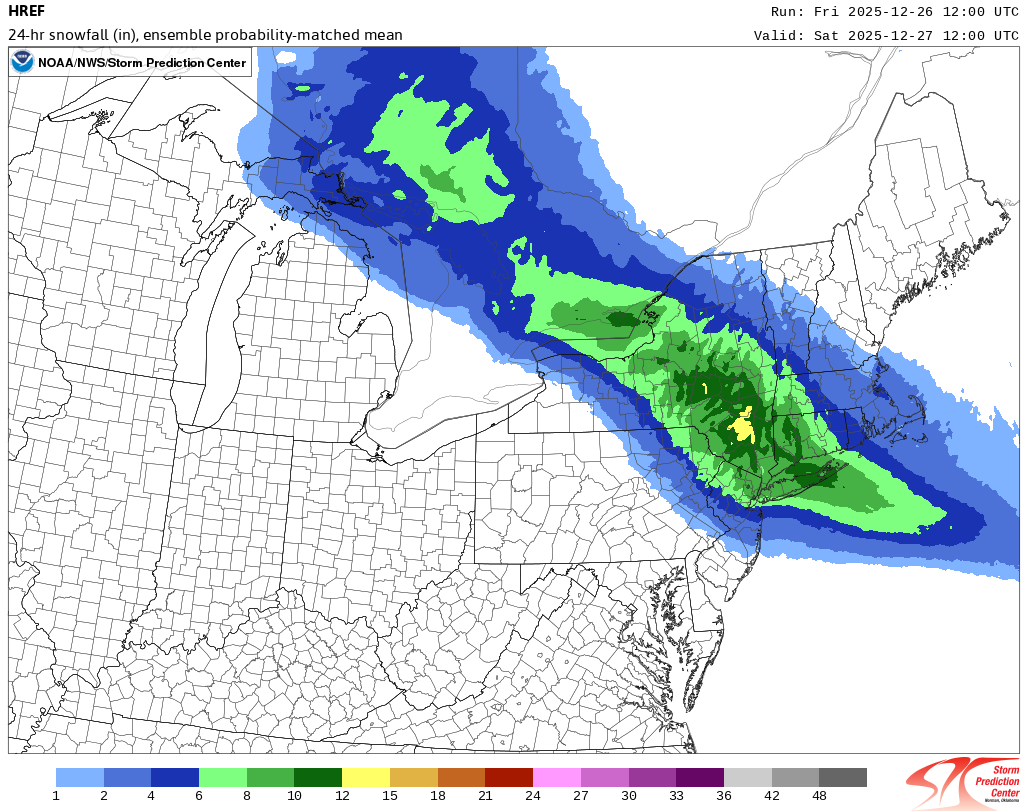
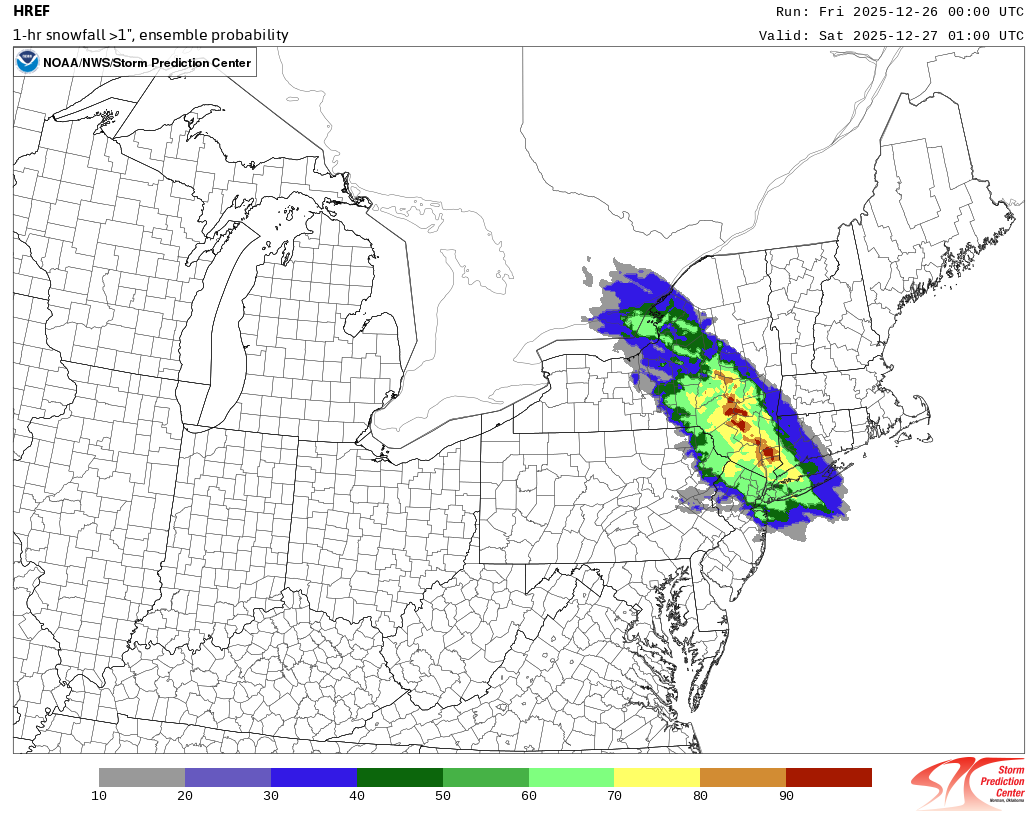
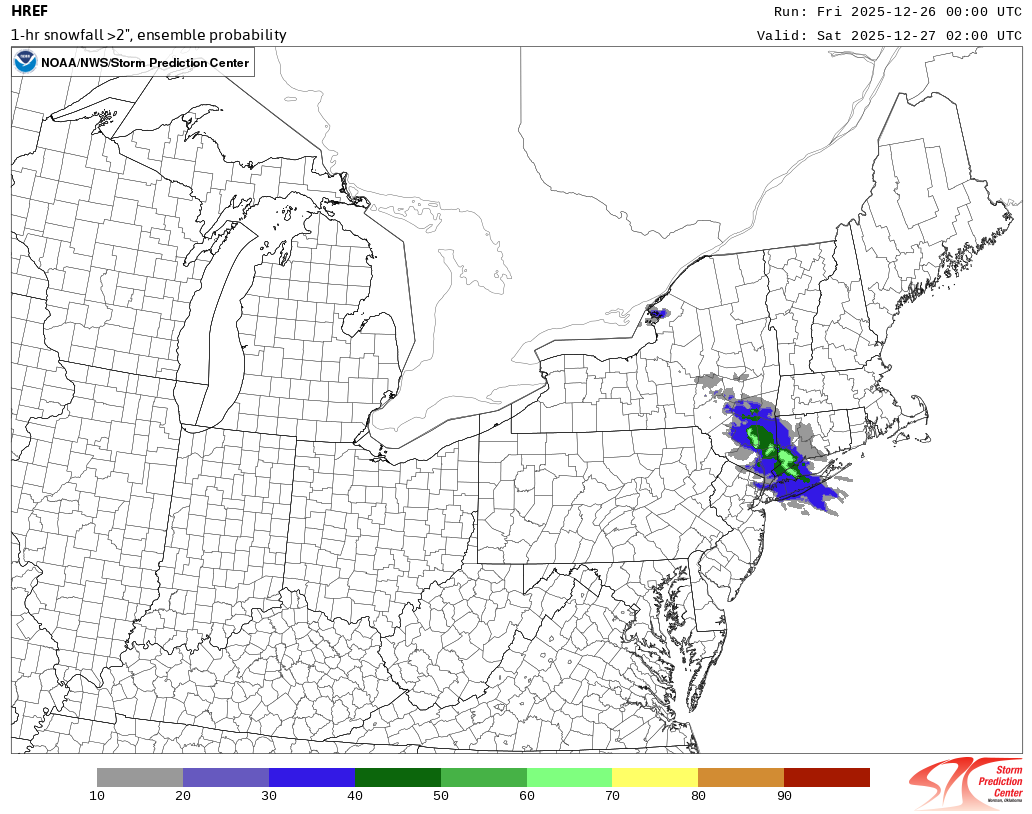
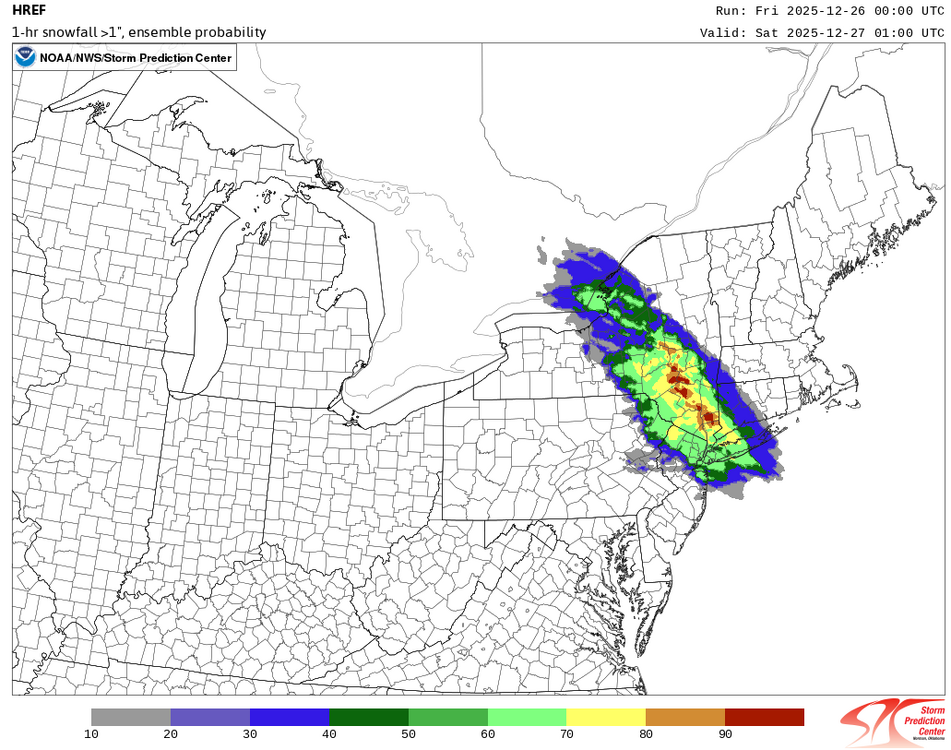
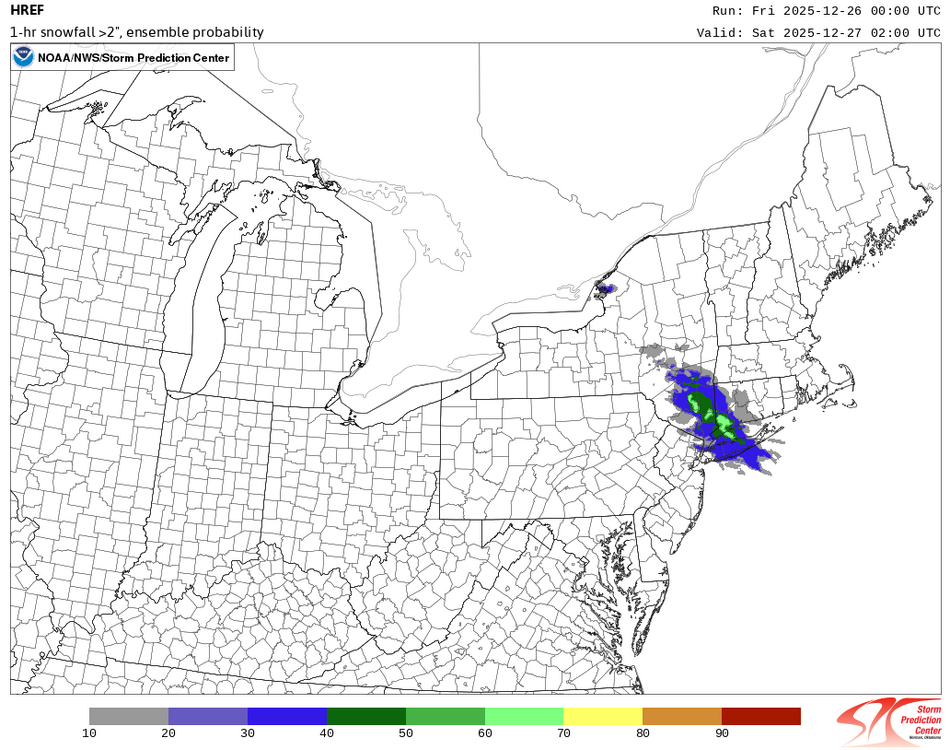
Coming back from the New York Botanical Garden and its lonely blooming camellia, and reading the many pages that have accumulated in this thread, it seems that chaos ruled. Seemingly with every model in every cycle, the forecast has changed. Posts proclaimed a confidence-boosting snowfall. Others stripped it all away. Snowfall totals advanced, retreated, and advanced again. There were calls for confidence. There were calls for panic. The furious activity over a few hours suggested that AmWx readers were frantically refreshing their phones the way sailors once scanned the horizon, hoping the weather would make up its mind (or at least those posting on the forthcoming storm would). Reading the alternating encouraging and dampening posts felt like whiplash. By the end of the thread, no one truly could know what to plan for. Reading the ups and downs and twists and turns was like sitting in a plane on final approach while the pilot yanked the controls left, then right, then left again, never really committing to the runway. In fact, in synoptic terms, things have been far less chaotic. Most of the reliable guidance has continued to be a model of fairly impressive consistency for the snow-starved New York City region. The New York City area, Hudson Valley, southwestern Connecticut, and parts of Long Island remain in line for a moderate-to-significant snowfall (4"-8"). The real battle zone where uncertainty and drama have reigned has been southwest of there from central New Jersey southward and northeast of there into Massachusetts. Will Philadelphia be left with only miserable sleet and freezing rain? Will some of the steady snow cross Storrow Drive into downtown Boston? The latest HREF shows that things remain on track. As is typically the case, if one reduces the categories of snowfall by one category e.g., 6"-8" is reduced to 4"-6", one gets a good picture of what is likely at this stage while taking into consideration the modest uncertainty that still exists. Even a two-category reduction would yield 4"-6" for most of New York City. Meanwhile, snow is advancing through western New York State. New York City is poised to see its biggest snowfall since January 28-29, 2022 when 8.5" fell.


-
For fun, my point estimate for Central Park is 5.8" with a general 4"-8" in and around the City.
-
The overnight guidance has reaffirmed the idea of a 4"-8" snowfall in and around the New York City area. Much of the snow could fall during a 3-hour stretch during the evening when snowfall rates approach or reach 1" per hour. Parts of the Hudson Valley and western Connecticut could see even more intense hourly snowfall rates. During the height of the storm, snow-to-liquid ratios could be 11:1-12:1 in the region. Ratios will fall as the mid-level warms and will likely be around 8:1 late in the storm. The storm could still end with some sleet in and around New York City. The risk of sleet increases the farther south and west one goes. The consistency of the quality guidance in focusing the heaviest snows on an area that covers New York City, the Hudson Valley, and western Connecticut provides confidence that this region will experience a significant snowfall. In terms of the EPS and GEFS, 90.2% of ensemble members show 4" or more snow for New York City. Just 1 member has 2". The range between lowest and highest amounts is 2"-8" on the ensembles. A much larger share of precipitation will fall as freezing rain and/or sleet farther south. Philadelphia will likely pick up a coating to 2" of mainly sleet. The lower part of that range is probably more likely than the upper end. In contrast, Boston will see the heaviest snows pass to its south. A 1"-3" snowfall is likely there. If Boston and Philadelphia see less than 2" of snow while New York City picks up 6" or more, that would be a very infrequent outcome. Since 1890, 175 storms have brought 6" or more snow to New York City, but just five saw both Boston and Philadelphia pick up less than 2" of snow. The most recent such storm occurred during February 26-27, 1991 when Boston saw 0.7", New York City picked up 8.9", and Philadelphia received 0.1". All said, New York City and its nearby suburbs remain in line for a 4"-8" snowfall. The snow should start overspreading the region during the mid- or late afternoon and work across Long Island during the early evening.
-
Max temp profile did ok using Bufkit. But these are the maps being posted to make claims about the snowfall (past storm and the upcoming one). Thus, my critique covers those maps. As noted previously, virtually none of the individual EPS and GEFS ensemble members supported the idea that NYC would see < 1” snow from the upcoming system. In fact, the quality guidance has consistently favored a 3”-6”/4”-8” event for the NYC area.
-
This was the NAM just over 12 hours before the onset of Tuesday's precipitation for NYC: Outcome: Trace not 2.4".
-
Tomorrow will see increasing clouds. Snow will arrive during the late afternoon or evening and continue overnight. The snow could fall moderately to even heavily for a time. Sleet or freezing rain could mix in toward the end of the storm in parts of the region. A general 4"-8" snowfall is likely in and around the New York City area. Through 18z, a 4"-8" snowfall in and around New York City remains the baseline scenario. The NBM (19z: 8.0") and 76.8% of the EPS/GEFS ensemble members show 4.0" or more snow for New York City while 8.5% show 2" or less. The RRFS A, the NAM's successor, which had been a southern outlier yesterday has stabilized today with snowfall focused on the New York City area and Hudson Valley. Both the 18z RGEM and GFS also focused the snowfall in the consensus area. The 18z NAM is a northern outlier that is largely on its own. Almost always, the skillful models fare better than the NAM when the NAM is largely on its own. Areas to the south and west of New York City will see a larger share of precipitation fall as sleet and/or freezing rain. As a result from central New Jersey southward, snow accumulations will be noticeably lower. Philadelphia could pick up a coating to 2" of mainly sleet. The storm will be followed by a chilly weekend. A storm cutting to the Great Lakes could bring some rain and milder weather on Monday before cold air returns to close out December. The closing days of December will likely be colder than normal. December 2025 will very likely finish with a maximum monthly temperature below 60° in New York City. The last time that happened was in 2019 when the monthly high was 58°. If 2025 has a monthly high below 60°, that would be only the fifth such occurrence since 2000 (2003, 2004, 2005, and 2019 are the cases since 2000). The ENSO Region 1+2 anomaly was -0.6°C and the Region 3.4 anomaly was -0.8°C for the week centered around December 17. For the past six weeks, the ENSO Region 1+2 anomaly has averaged -0.40°C and the ENSO Region 3.4 anomaly has averaged -0.68°C. La Niña conditions will likely continue through at least mid-winter. The SOI was -2.96 today. The preliminary Arctic Oscillation (AO) was +0.775 today. Based on sensitivity analysis applied to the latest guidance, there is an implied near 100% probability that New York City will have a cooler than normal December (1991-2020 normal). December will likely finish with a mean temperature near 33.9° (5.2° below normal). That will make December 2025 the coldest December since 2010 when the monthly mean temperature was 32.8°. It would also make 2025 the third coldest December since 2000. Supplemental Information: The projected mean would be 3.5° below the 1981-2010 normal monthly value.
-
It has virtually no support by any of the 12z GEFS and EPS ensembles.
-
Through the early 12z guidance, my thinking that the New York City area remains in line for a 4"–8" snowfall has remained unchanged. The snow could still end as a period of sleet and/or freezing rain. The quality models such as the ECMWF, GFS, RGEM, along with the GEFS/EPS ensembles, provided reasonably consistent guidance overnight. The NAM, after flirting with the idea that NYC might see little to no snow in a bid to out-grinch the Grinch finally woke up, rubbed its digital eyes, and acknowledged the realities of the pattern and the evolving synoptic details. Its prior solution was disregarded, as virtually every EPS and GEFS ensemble member disagreed with its stingy snowfall total. Thus, the NAM had been offering an unrealistic scenario. After all, if what it was offering was realistic, at least some of the ensemble members would have provided support. For reference, New York City's last 6" or above snowfall occurred on January 28-29, 2022 when 8.3" fell from a blizzard that crushed parts of Long Island under more than two feet of snow.
-
From the WPC: