donsutherland1
-
Posts
24,194 -
Joined
Content Type
Profiles
Blogs
Forums
American Weather
Media Demo
Store
Gallery
Everything posted by donsutherland1
-
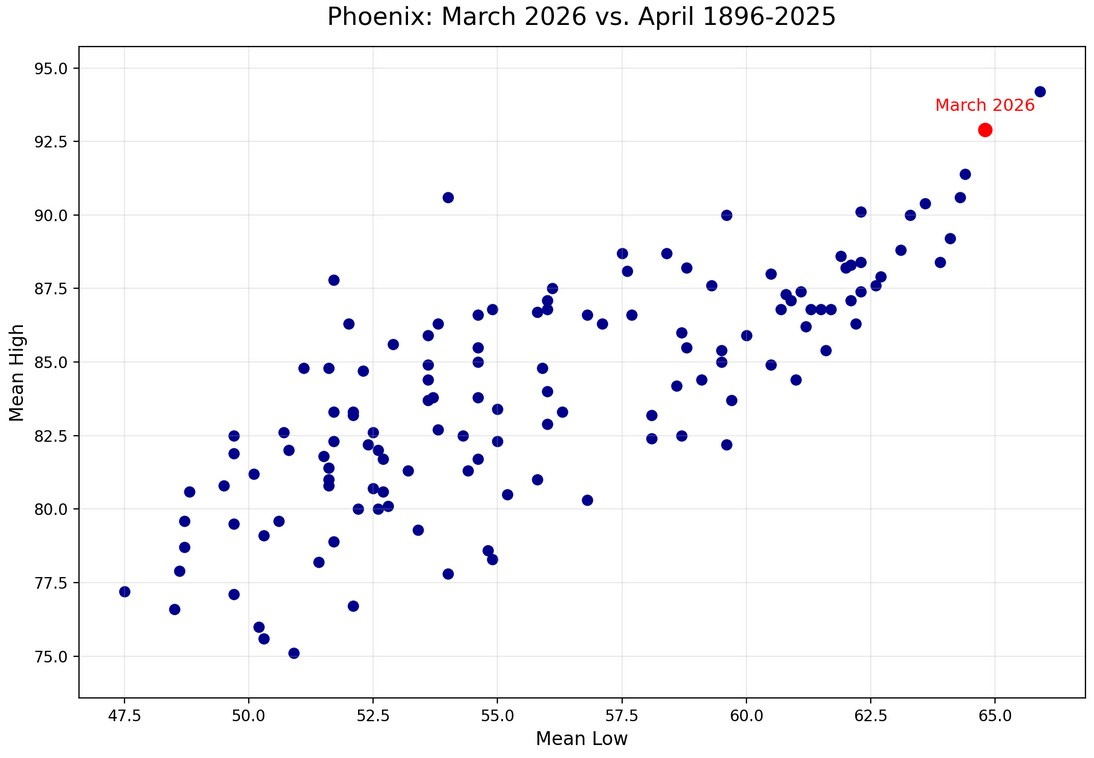
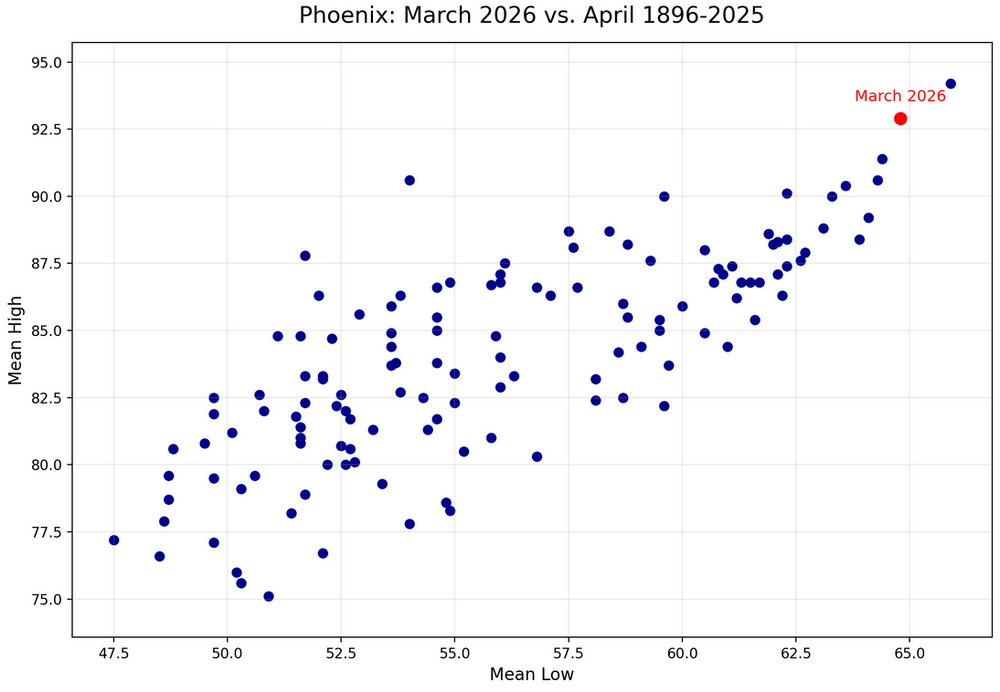
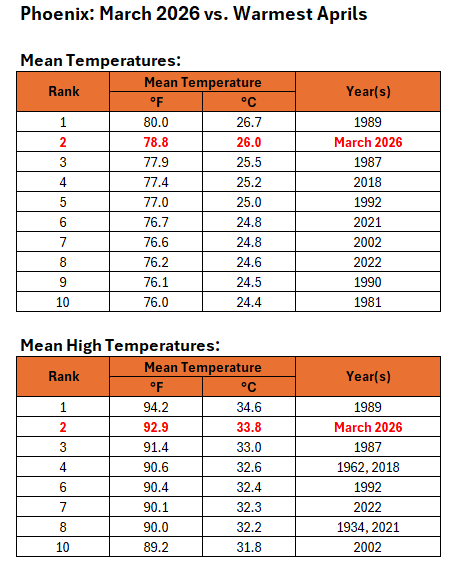
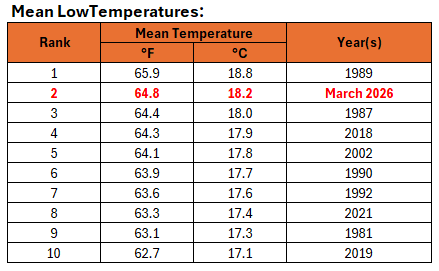
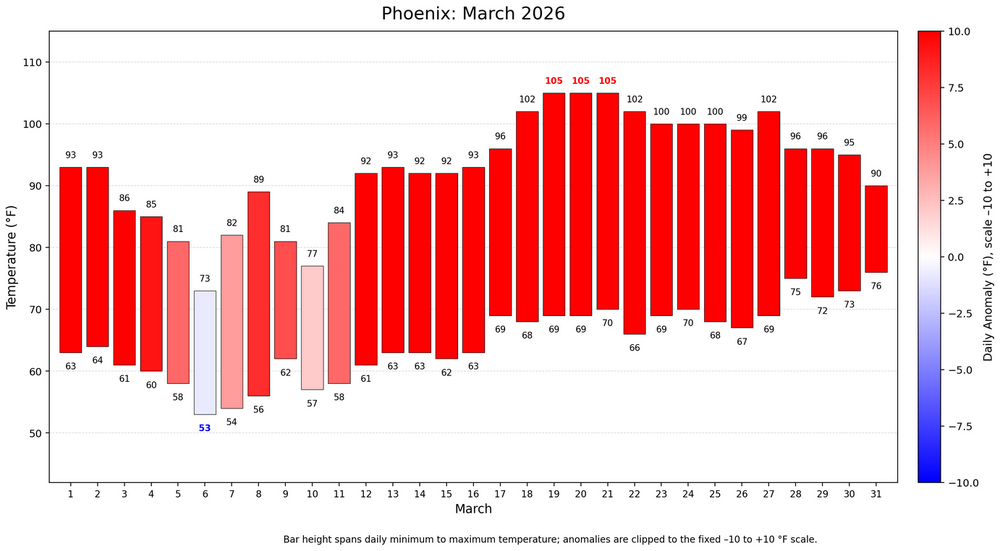
Phoenix was so warm during March 2026 that its mean monthly low, mean monthly high, and mean monthly temperatures would all have ranked second hottest on record for April. Numerous March temperature records surpassed the most extreme values experienced during April.
-
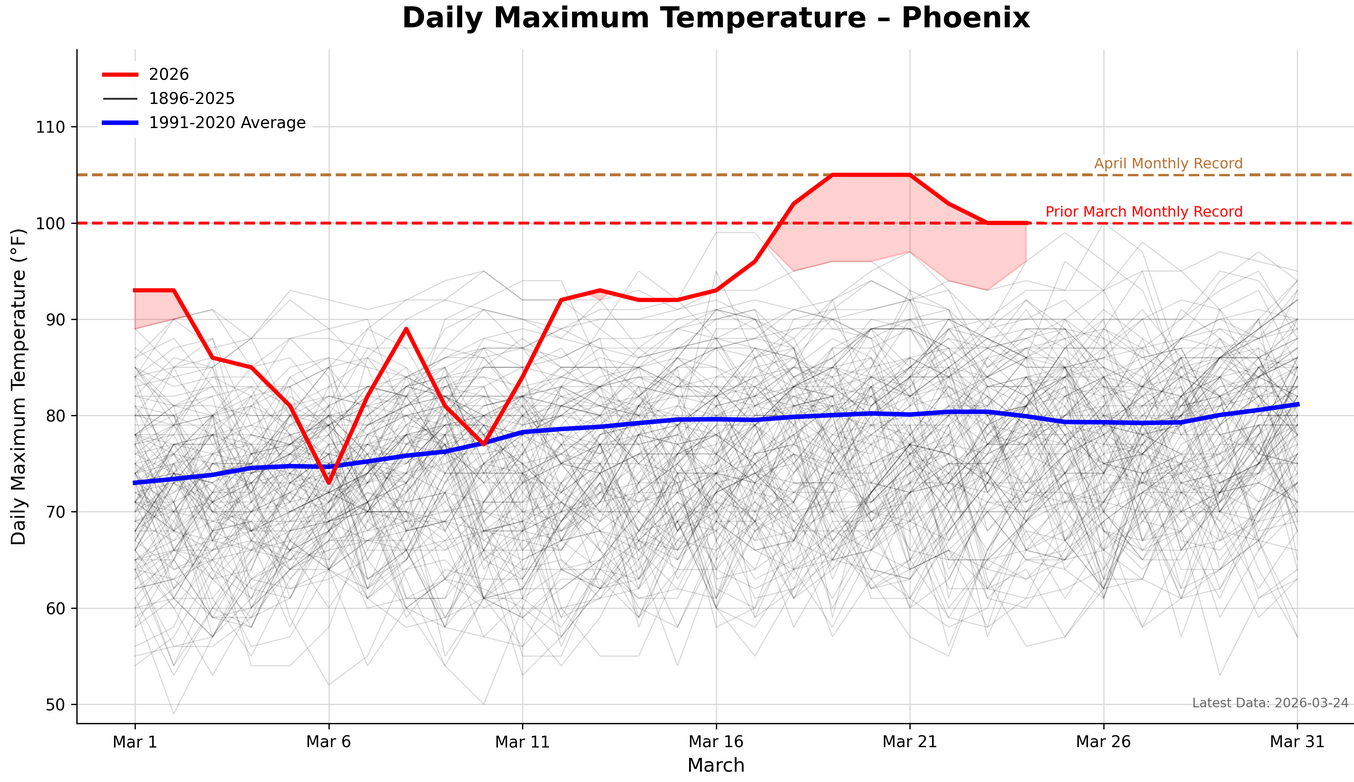
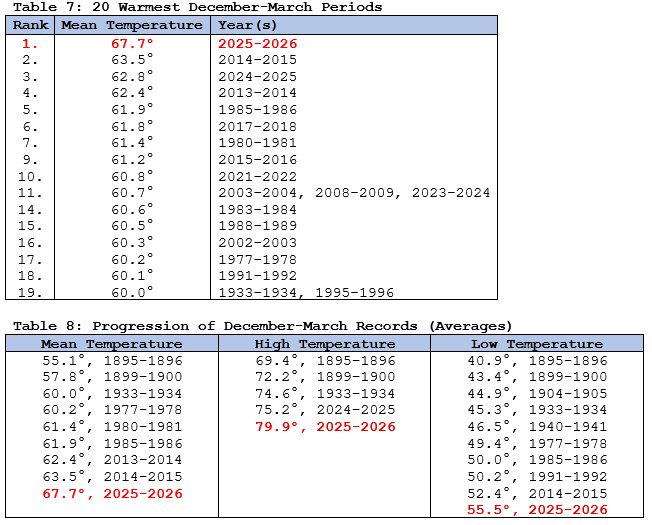
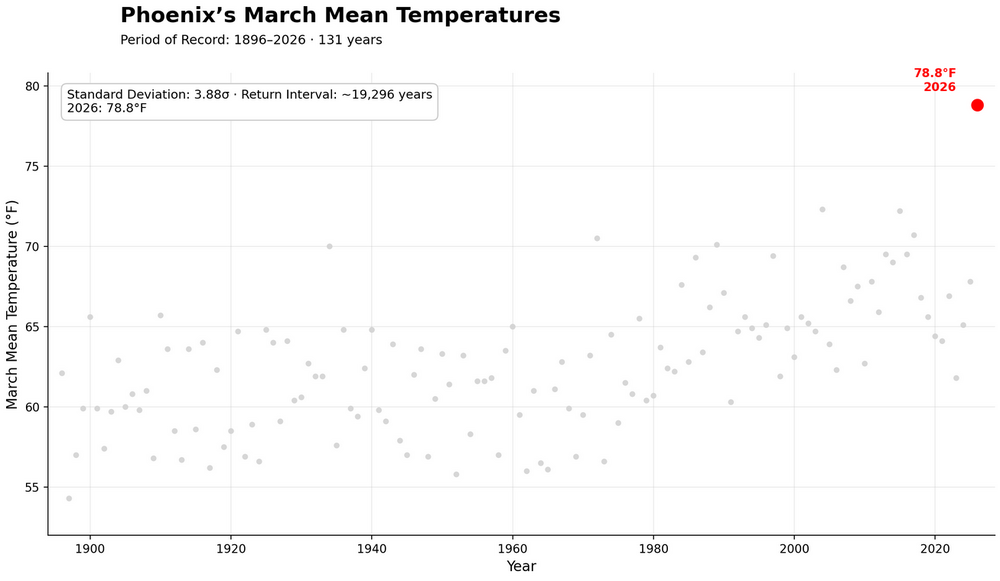
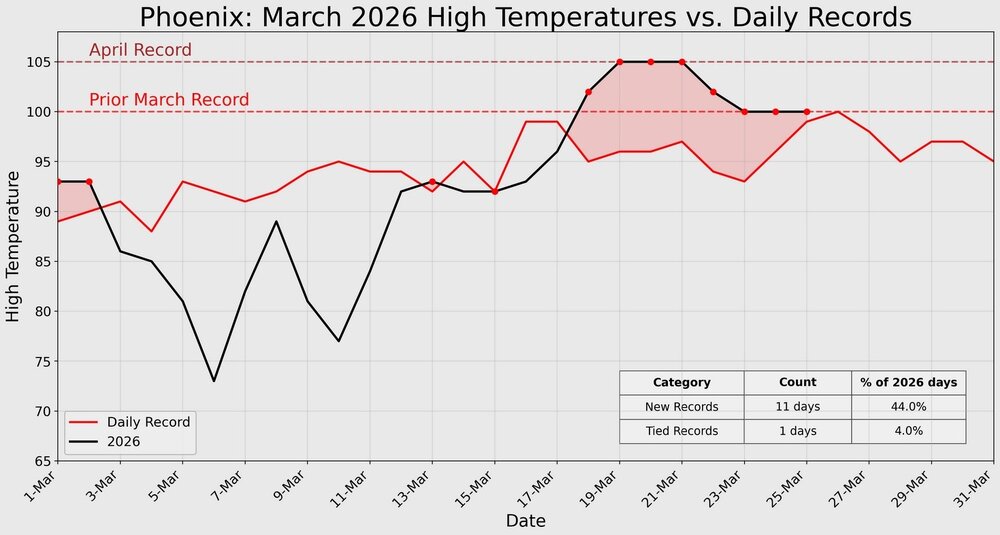
Powered by a monster heat dome that would be a rarity during the summer, Phoenix and the Southwest experienced mind-boggling warmth during March. Chart 1: Daily Temperatures: Chart 2: Return Time of Monthly Mean Temperature (Historic Period): The warmth has been persistent since December. December, February, and March set new records for warmest December, February, and March on record. As a result, Phoenix also experienced its warmest December-March period by a large margin.

-
Yes. That would be better. The instrument details mentioned by @chubbs could still play a role at some sites.
-
Bad methodology. Notice he uses MT and WY. 90s in March are virtually assured to be near or at zero. Thus he assures himself the kind of conclusion he seeks. A more robust approach would involve standardized measurements, e.g., the number of highs 1 sigma, 2 sigma, etc., above the 20th century baseline.
-
Tomorrow will be noticeably warmer. High temperatures will reach the lower and middle 60s in the New York City area. The warming trend will continue through the remainder of March with the temperature reaching the lower and middle 70s as March concludes on Monday. April will also start with readings topping out in the lower to middle 70s, but a cold front will knock down temperatures shortly afterward. A wet period could follow. The ENSO Region 1+2 anomaly was +1.6°C and the Region 3.4 anomaly was 0.0°C for the week centered around March 18. For the past six weeks, the ENSO Region 1+2 anomaly has averaged +1.15°C and the ENSO Region 3.4 anomaly has averaged -0.08°C. Neutral ENSO conditions will continue through at least mid-spring. The SOI was -8.86 today. The preliminary Arctic Oscillation (AO) was +3.443 today. Based on sensitivity analysis applied to the latest guidance, there is an implied near 100% probability that New York City will have a warmer than normal March (1991-2020 normal). March will likely finish with a mean temperature near 46.5° (3.7° above normal). Supplemental Information: The projected mean would be 4.0° above the 1981-2010 normal monthly value.
-
Occasional Thoughts on Climate Change
donsutherland1 replied to donsutherland1's topic in Climate Change
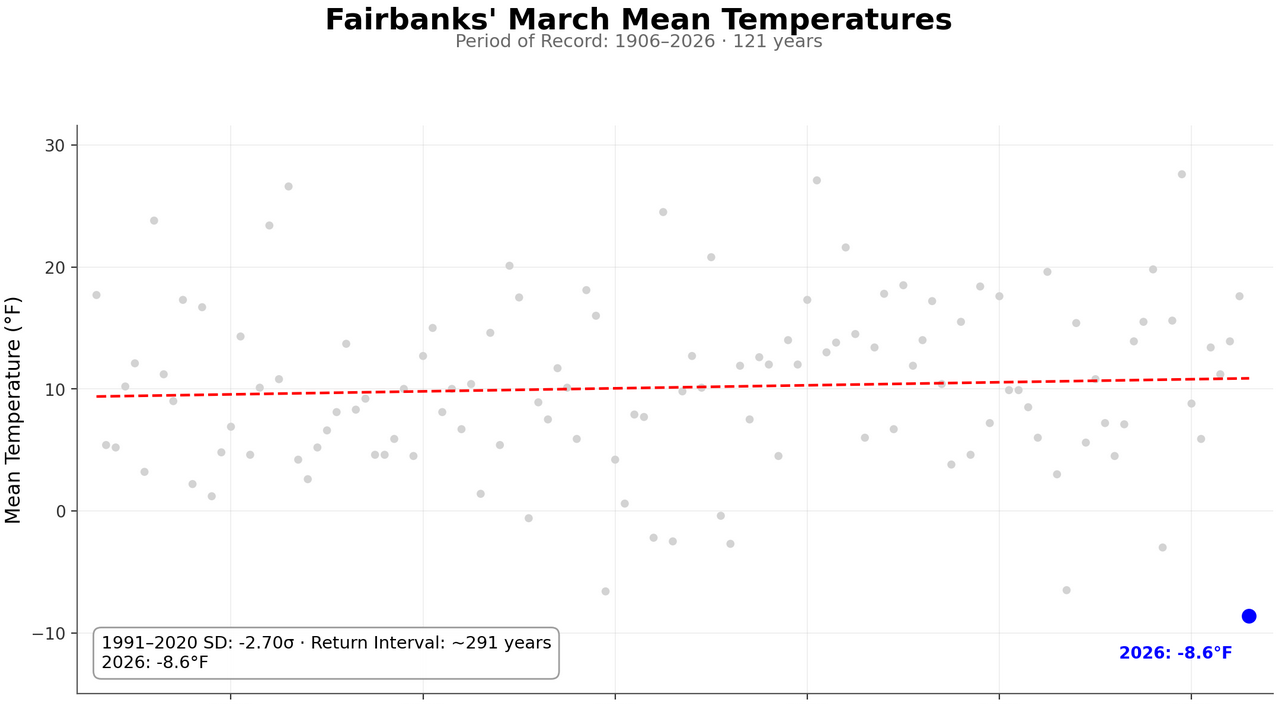
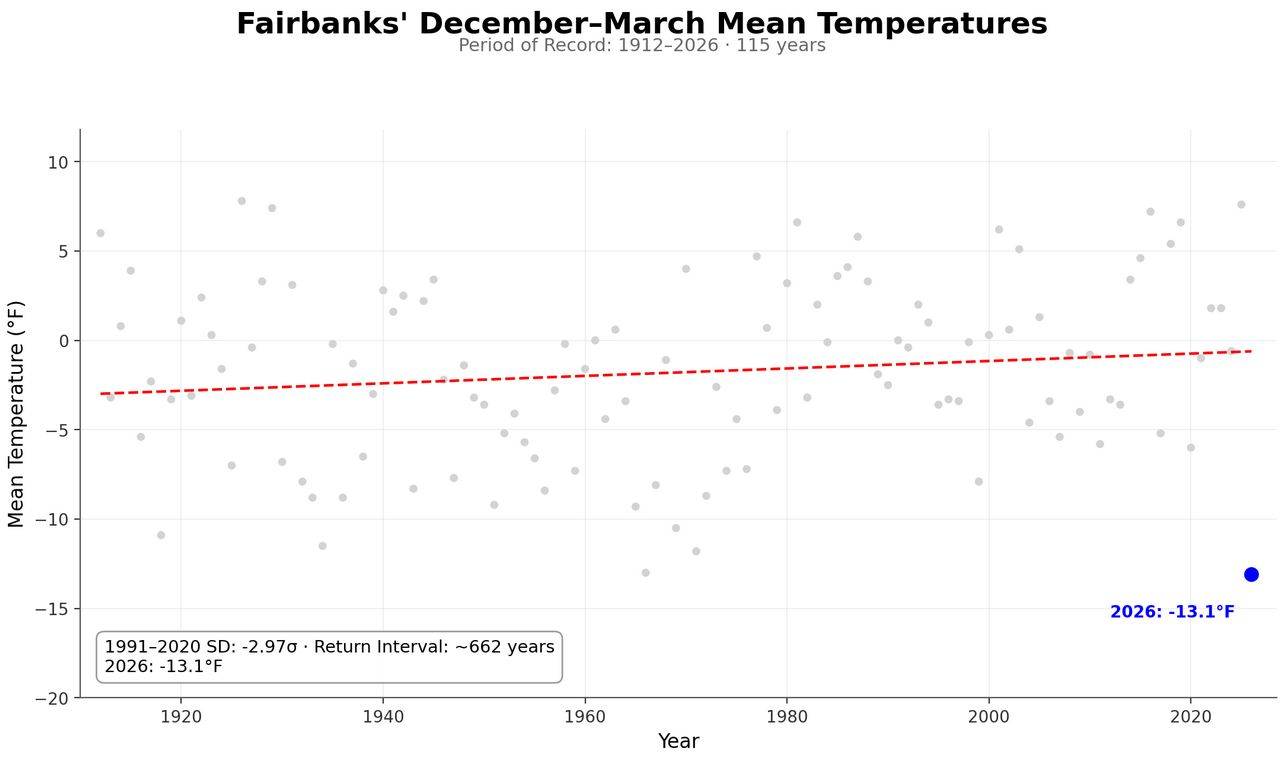
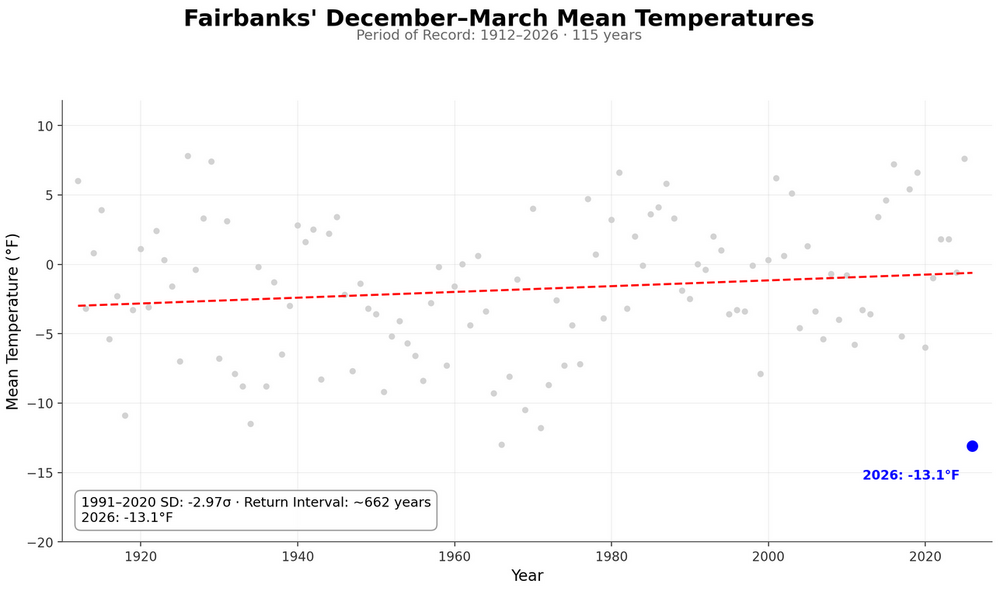
Using a chart inspired by Jeff Berardelli's return-time charts, here's how Fairbanks would look for March 2026: And December-March (cases prior to 1911-12 were excluded due to the number of missing days during the 1905-06 through 1910-11 period):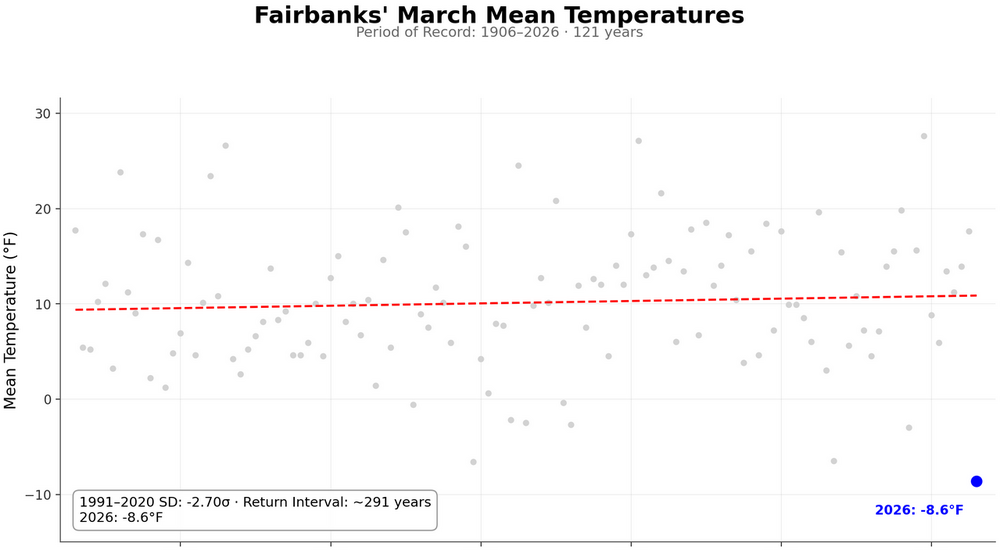
-
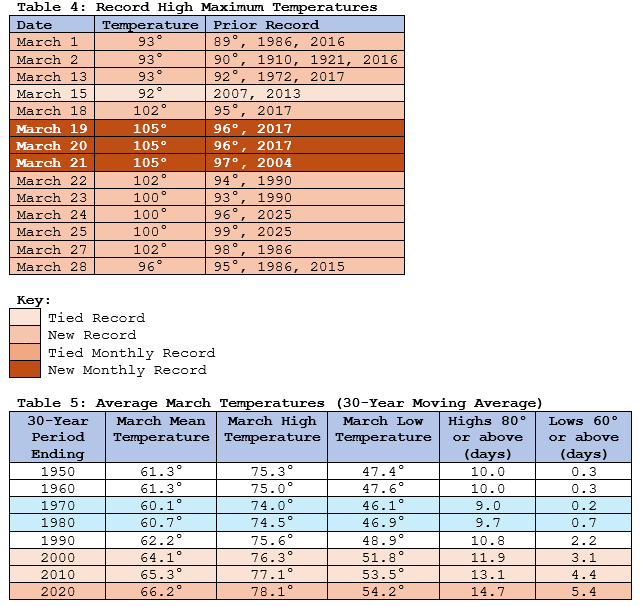
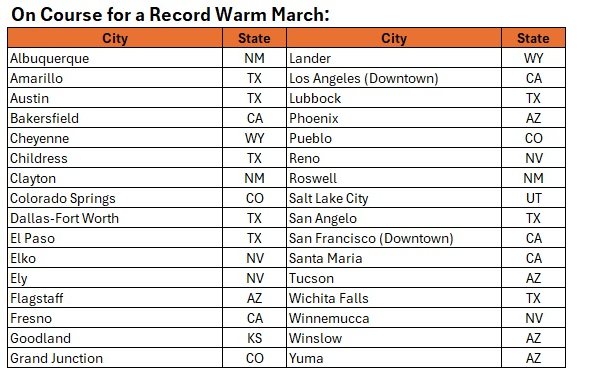
UHI, which is an important contributor, has been mentioned in several of the past Phoenix-related threads. Even setting aside, UHI, there has been a strong warming trend in Arizona and the Southwest. During 1970-2025, Arizona's minimum temperatures have warmed an average of 0.6°/decade. Phoenix's have increased by 0.8°/decade. In terms of maximum temperatures, Arizona's rate of warming has been 0.7°/decade while Phoenix's has been 0.8°/decade. The differences are a reasonable but not perfect proxy for the impact of UHI. The ongoing March heat is widespread. The following stations with 100-year or longer climate records are on course for their warmest March on record. Some will break their existing records by sizable margins.
-
The weekend started on a cold note. Low temperatures included: Boston: 27° Danbury: 28° Bridgeport: 31° Islip: 32° New York City: 31° Newark: 31° Philadelphia: 33° Poughkeepsie: 25° Sussex: 25° White Plains: 27° Tomorrow will become somewhat milder. The warming trend will continue through the remainder of March with the temperature reaching the lower and middle 70s as March concludes. April will also start with readings topping out in the lower to middle 70s, but a cold front will knock down temperatures shortly afterward. A wet period could follow. The ENSO Region 1+2 anomaly was +1.6°C and the Region 3.4 anomaly was 0.0°C for the week centered around March 18. For the past six weeks, the ENSO Region 1+2 anomaly has averaged +1.15°C and the ENSO Region 3.4 anomaly has averaged -0.08°C. Neutral ENSO conditions will continue through at least mid-spring. The SOI was -11.92 today. The preliminary Arctic Oscillation (AO) was +2.569 today. Based on sensitivity analysis applied to the latest guidance, there is an implied near 100% probability that New York City will have a warmer than normal March (1991-2020 normal). March will likely finish with a mean temperature near 46.4° (3.6° above normal). Supplemental Information: The projected mean would be 3.9° above the 1981-2010 normal monthly value.
-
Flagstaff has an altitude > 2,100 meters or about 7,000 feet ASL.
-
Many cities in the Southwest and even California will have experienced their warmest March on record, some by large margins.
-
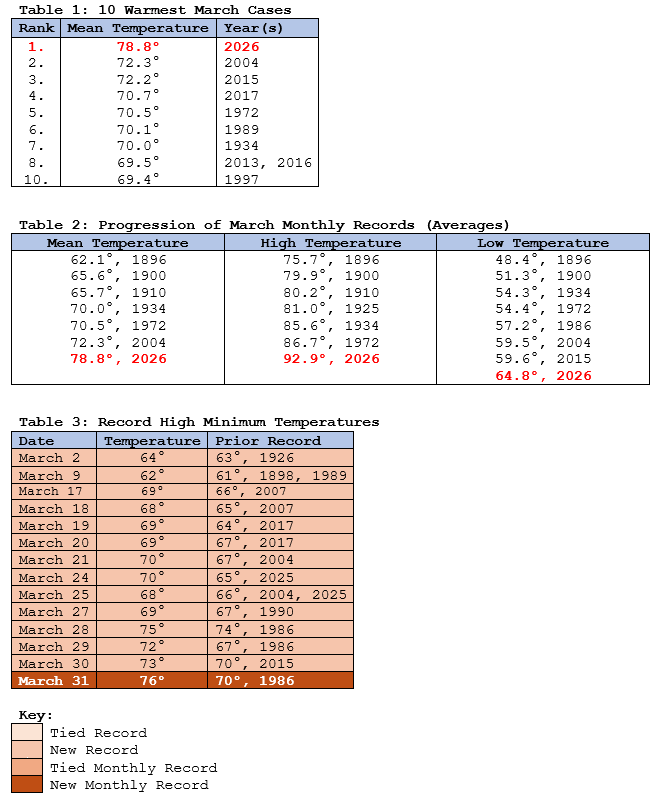
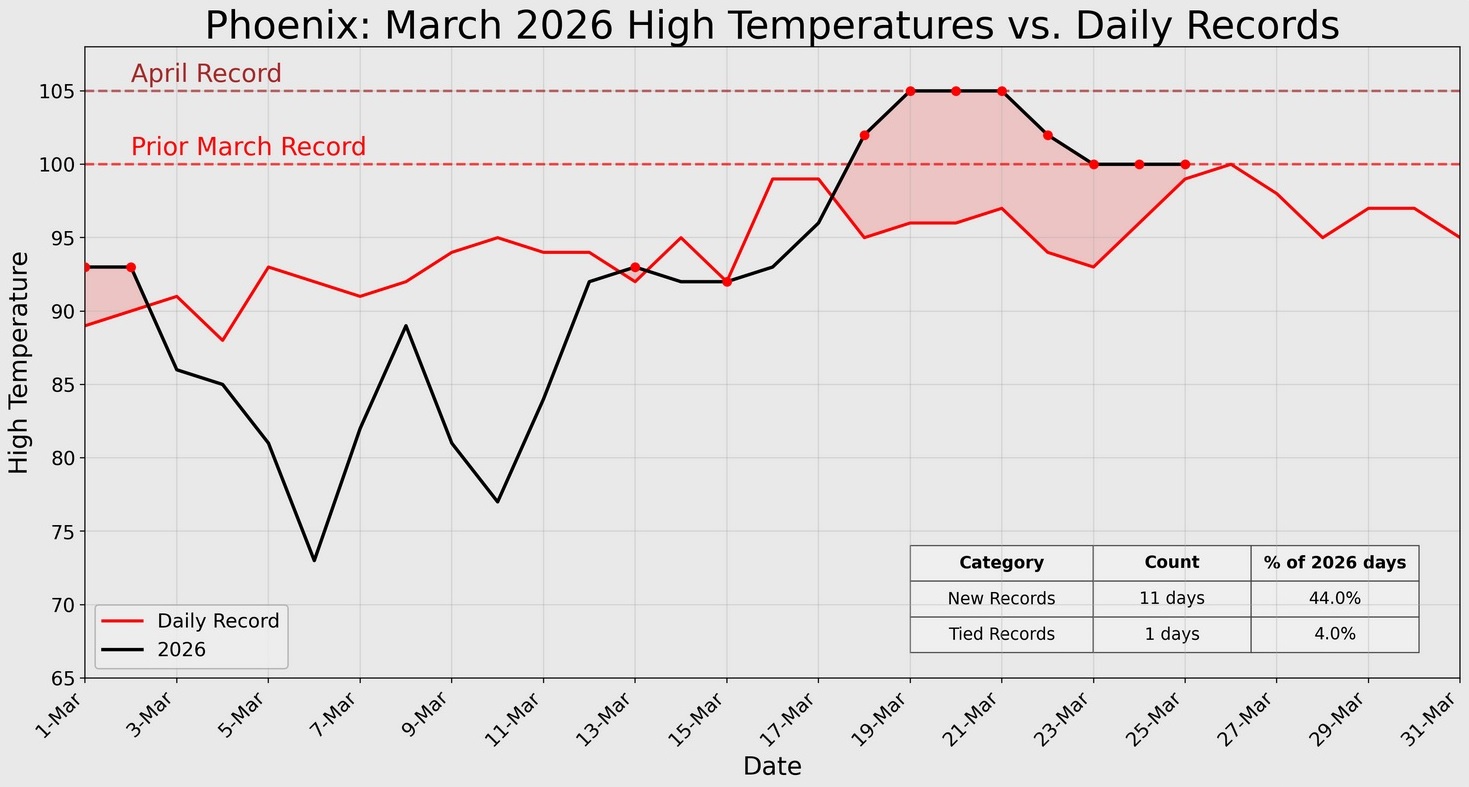
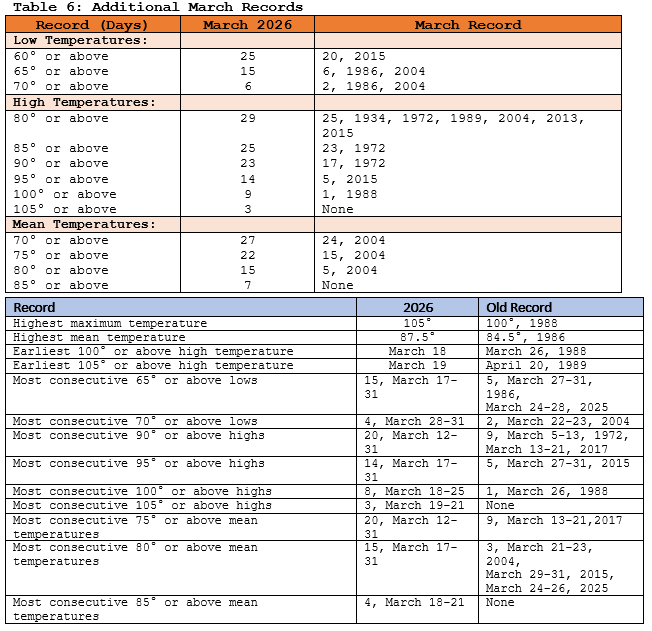
Phoenix's hottest March on record is nearing an end. This space will provide numerous highlights. Some things that are virtually certain: 1) March 2026 will have a mean temperature that would rank it as the second warmest April. 2) Prior to 2026, the average record high maximum temperature for March 16-31 was 96.6°. The March 16-31 period will have an average high temperature that exceeds that average. 3) Phoenix tied or exceeded its March monthly record high temperature on 9 days. 4) In terms of statistical anomalies related to monthly mean temperatures, the Phoenix monthly mean temperature will easily surpass the December 2015 mean in New York City relative to each city's historical climate record. The above is an AI-generated artistic rendition of the March 2026 heat in Phoenix.

-
The weekend will start on a cold note with the low temperature likely near freezing in New York City and high temperatures in the middle 40s on Saturday. Sunday will become somewhat milder. The warming trend will continue through the remainder of March with the temperature reaching the 70s as March concludes. The ENSO Region 1+2 anomaly was +1.6°C and the Region 3.4 anomaly was 0.0°C for the week centered around March 18. For the past six weeks, the ENSO Region 1+2 anomaly has averaged +1.15°C and the ENSO Region 3.4 anomaly has averaged -0.08°C. Neutral ENSO conditions will continue through at least mid-spring. The SOI was -12.30 today. The preliminary Arctic Oscillation (AO) was +2.511 today. Based on sensitivity analysis applied to the latest guidance, there is an implied near 100% probability that New York City will have a warmer than normal March (1991-2020 normal). March will likely finish with a mean temperature near 46.2° (3.4° above normal). Supplemental Information: The projected mean would be 3.7° above the 1981-2010 normal monthly value.
-
The SST chart comes from here: https://climatereanalyzer.org/clim/sst_daily/?dm_id=world2
-
2025-2026 ENSO
donsutherland1 replied to 40/70 Benchmark's topic in Weather Forecasting and Discussion
At this time, especially with the seasonal transition underway, one has to be cautious about such events given model skill limitations. The "spring ENSO barrier" in prediction remains real. By early summer, the picture should be clearer. -
Occasional Thoughts on Climate Change
donsutherland1 replied to donsutherland1's topic in Climate Change
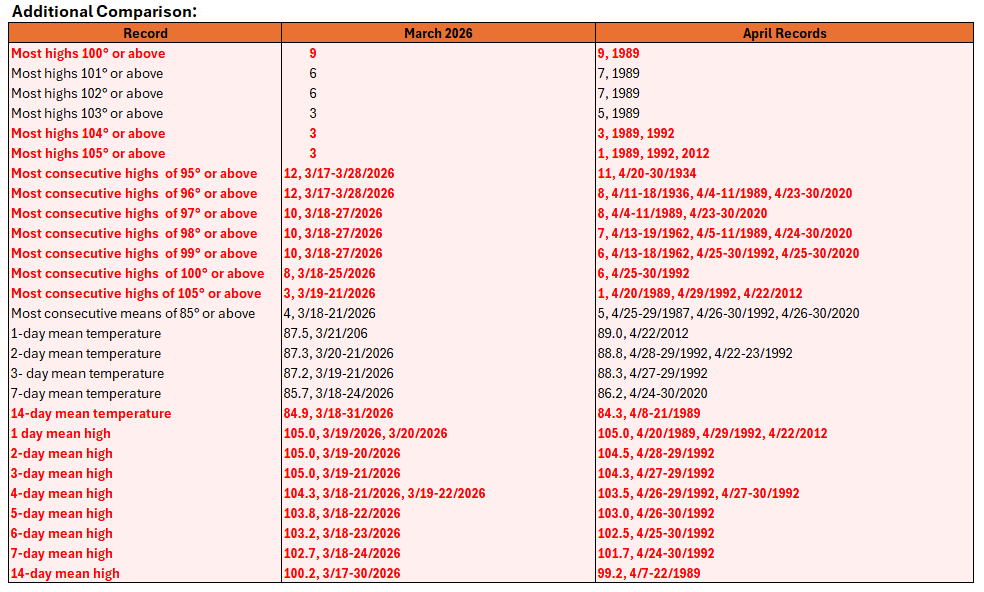
The most extreme March heatwave on record in the United States is now concluding. Additional monthly records were set today. Below is a selection of March records that matched or beat April records during the unprecedented heatwave.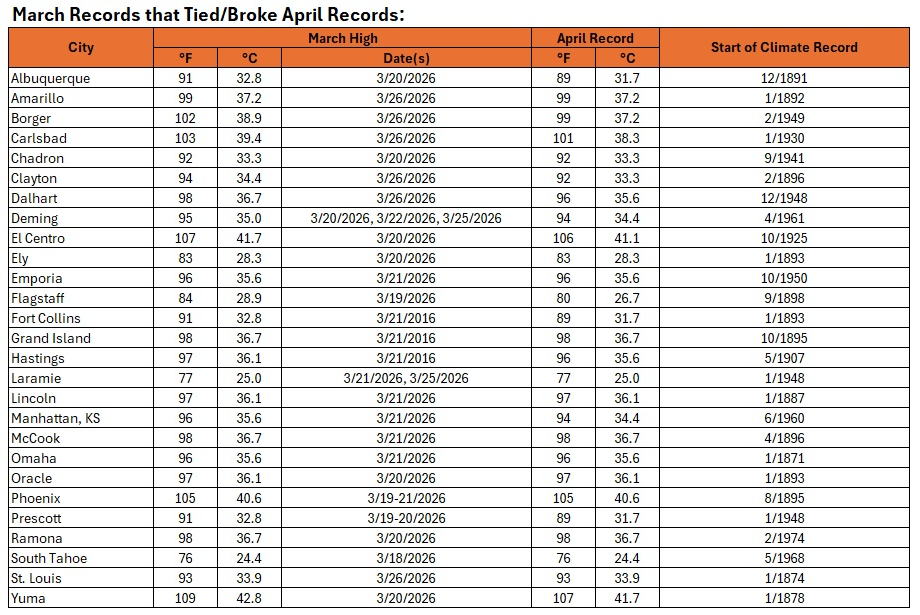
-
After some overnight showers and perhaps a thundershower, it will turn somewhat cooler tomorrow with highs reaching the lower and middle 50s. The weekend will start on a cold note with the low temperature likely near or even somewhat below freezing in New York City and high temperatures in the middle 40s on Saturday. Sunday will become somewhat milder. The ENSO Region 1+2 anomaly was +1.6°C and the Region 3.4 anomaly was 0.0°C for the week centered around March 18. For the past six weeks, the ENSO Region 1+2 anomaly has averaged +1.15°C and the ENSO Region 3.4 anomaly has averaged -0.08°C. Neutral ENSO conditions will continue through at least mid-spring. The SOI was -9.10 today. The preliminary Arctic Oscillation (AO) was +2.529 today. Based on sensitivity analysis applied to the latest guidance, there is an implied near 100% probability that New York City will have a warmer than normal March (1991-2020 normal). March will likely finish with a mean temperature near 45.8° (3.0° above normal). Supplemental Information: The projected mean would be 3.3° above the 1981-2010 normal monthly value.
-
And the updated chart:
-
I'd want to continue to play in his memory. Like you, I don't know how he calculated his curve.
-
Unseasonably warm air will briefly move into the region tomorrow. Hights will top out in the upper 60s and lower 70s. Friday will be somewhat cooler with highs reaching the middle 50s. Another cold front could cross the region on tomorrow night or Friday. The front will bring a few showers or thundershowers. The weekend will start on a cold note with the low temperature likely near or even somewhat below freezing in New York City and high temperatures in the middle 40s on Saturday. Sunday will become somewhat milder. The ENSO Region 1+2 anomaly was +1.6°C and the Region 3.4 anomaly was 0.0°C for the week centered around March 18. For the past six weeks, the ENSO Region 1+2 anomaly has averaged +1.15°C and the ENSO Region 3.4 anomaly has averaged -0.08°C. Neutral ENSO conditions will continue through at least mid-spring. The SOI was -9.62 today. The preliminary Arctic Oscillation (AO) was +2.585 today. Based on sensitivity analysis applied to the latest guidance, there is an implied near 100% probability that New York City will have a warmer than normal March (1991-2020 normal). March will likely finish with a mean temperature near 45.5° (2.7° above normal). Supplemental Information: The projected mean would be 3.0° above the 1981-2010 normal monthly value.
-
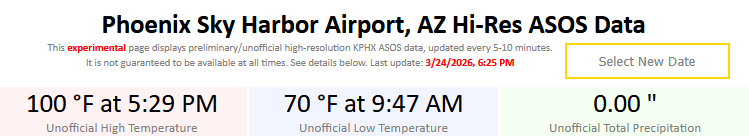
Phoenix: March 1-24, 2026 vs. its historical record.

-
To illustrate the extreme nature of the ongoing heatwave in Phoenix, there were six dates since 1980 when the daily record was broken by 8F or more. Four were: 3/19/2026, 3/20/2026, 3/21/2026, 3/22/2026. The others: 9/28/2024, 10/6/2024.
-
Phoenix has now reached 100° for the seventh consecutive day. That surpasses the April record of six consecutive days from April 25-30, 1992. Over the past seven days (March 18-24), Phoenix has had a mean high temperature of 102.7°. That tops the seven-day record for April of 101.7° that was set during April 24-30, 1992.
-
Milder air will return for the remainder of the work week. The temperature will return to the lower and perhaps middle 50s through Friday. Another cold front could cross the region on Friday. The weekend will start on a cold note with the low temperature likely near or even somewhat below freezing in New York City and high temperatures in the middle 40s on Saturday. Sunday will become somewhat milder. The ENSO Region 1+2 anomaly was +1.6°C and the Region 3.4 anomaly was 0.0°C for the week centered around March 18. For the past six weeks, the ENSO Region 1+2 anomaly has averaged +1.15°C and the ENSO Region 3.4 anomaly has averaged -0.08°C. Neutral ENSO conditions will continue through at least mid-spring. The SOI was +0.86 today. The preliminary Arctic Oscillation (AO) was +2.779 today. Based on sensitivity analysis applied to the latest guidance, there is an implied 99% probability that New York City will have a warmer than normal March (1991-2020 normal). March will likely finish with a mean temperature near 45.4° (2.6° above normal). Supplemental Information: The projected mean would be 2.9° above the 1981-2010 normal monthly value.
-
Occasional Thoughts on Climate Change
donsutherland1 replied to donsutherland1's topic in Climate Change
Here's Yellowknife's coldest March: https://climate.weather.gc.ca/climate_data/monthly_data_e.html?hlyRange=1953-01-01|2013-01-17&dlyRange=1942-07-01|2013-01-16&mlyRange=1942-01-01|2007-11-01&climate_id=2204100&Prov=NT&urlExtension=_e.html&searchType=stnName&optLimit=yearRange&StartYear=1840&EndYear=2026&selRowPerPage=25&Line=0&searchMethod=contains&Month=3&Day=23&txtStationName=yellowknife&timeframe=3&Year=1964 That translates into a monthly mean temperature of -17.6°F.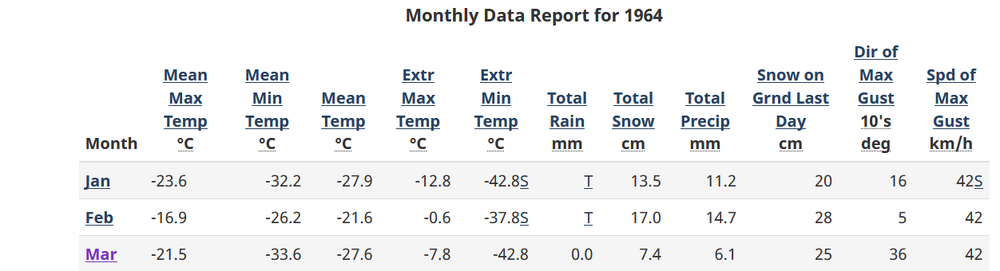
-
Occasional Thoughts on Climate Change
donsutherland1 replied to donsutherland1's topic in Climate Change
I believe that's the ranking, not the number of days.