donsutherland1
-
Posts
23,987 -
Joined
Content Type
Profiles
Blogs
Forums
American Weather
Media Demo
Store
Gallery
Everything posted by donsutherland1
-
Atlantic City saw 6.0".
-
Yes. The April 3-4, 1915 snowstorm brought 19.4" to Philadelphia and 10.2" to NYC. Baltimore received 6.5" and Washington, DC saw 3.5". Interestingly enough, there was also an area of heavy snow farther south with Richmond and Raleigh both picking up 10.0".
-
The mild weather will continue through tomorrow. It could turn briefly cooler on tomorrow. The arrival of the cooler air will be preceded by showers or a period of rain tonight into tomorrow morning. Another brief shot of cold air is likely on Sunday. A more sustained period of cold could develop starting late next week. The chill could then linger for much of the remainder of the month. The ENSO Region 1+2 anomaly was +1.3°C and the Region 3.4 anomaly was +0.3°C for the week centered around March 12. For the past six weeks, the ENSO Region 1+2 anomaly has averaged +1.00°C and the ENSO Region 3.4 anomaly has averaged -0.18°C. Neutral ENSO conditions will likely continue into at least late spring. The SOI was +9.72 today. The preliminary Arctic Oscillation (AO) was +1.124 today. Based on sensitivity analysis applied to the latest guidance, there is an implied 90% probability that New York City will have a warmer than normal March (1991-2020 normal). March will likely finish with a mean temperature near 45.6° (2.8° above normal).
-
No. Newark received 8.7". Once one moved north and east of NYC, amounts fell off as the precipitation was lighter.
-
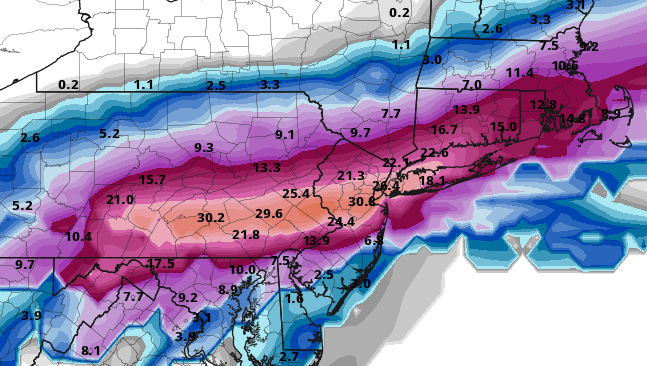
As noted yesterday, the GFS currently has a notorious reputation for struggling in the spring, especially when it comes to handling marginally cold air masses during storms. It seems that the model’s algorithms overamplify the cold, feeding back on itself until the simulated atmosphere becomes drastically colder than reality. This often leads to wildly exaggerated snowfall predictions, forecasting massive, historic snowstorms. Today's cycle is no different. 3/18/2025 12z Cycle: 24-hour snowfall (10:1 ratio), Valid 4/2/2025 0z: 3/18/2025 12z Cycle: 24-hour snowfall (Kuchera), Valid 4/2/2025 0z: This time, let's take a closer look at the historical record. Common snowfall records for Baltimore, Philadelphia, and Washington are available beginning in March 1892. The GFS forecast has the following select amounts: Baltimore: 10:1: 19.0"; Kuchera: 13.0" Philadelphia: 10:1: 11.9"; Kuchera: 9.9" Washington, DC: 10:1: 16.5"; Kuchera: 10.8" Since common snowfall records began, there has been no storm after March 15th that brought 6" or more snow to all three cities. The latest-season storm to bring 6" or more to all three cities was the March 12-14, 1993 superstorm. Prior to regular recordkeeping, a storm during March 16-17, 1843 brought 6" or more snow to all three cities. The latest-season storm to bring 10" or more to all three cities was the February 17-19, 1979 "President's Day Blizzard." Finally, the biggest snowstorm on record for Washington, DC after March 15th occurred on March 27-28, 1891 when 12.0" of snow fell. Large late-season events tend to be more localized in area e.g., Baltimore-Washington or Baltimore-Philadelphia, but not all three cities pick up substantial amounts of snow. There remains virtually no chance that the GFS's latest idea will verify. At this time of year, its maps for big snowstorms should be dismissed unless there is strong and consistent support from the other guidance.
-
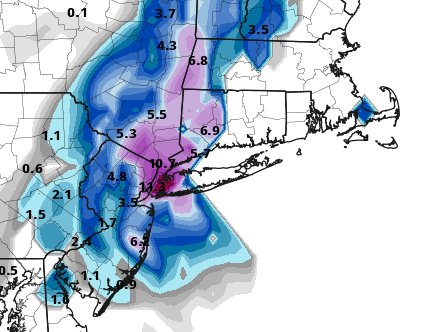
The map has issues. First, the snowstorm occurred on March 20-21, 2018, not March 28-29. Second, snowfall amounts included: Bridgeport: 3.0"; Farmingdale: 13.1"; Islip: 18.4"; New Brunswick: 8.9"; New York City-Central Park: 8.4"; New York City-JFK Airport: 8.7"; New York City-LaGuardia Airport: 9.6"; Newark: 8.3"; and, White Plains: 7.0"
-
Yes, the guidance has grown cooler for the last week or so of the month.
-
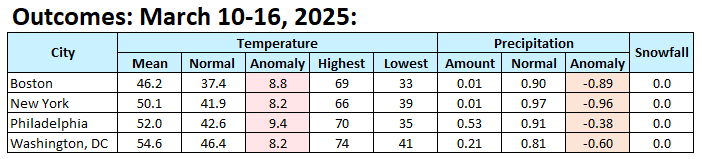
Final figures: Not quite as warm as had been modeled.
-
The mild weather will continue through tomorrow. It could turn briefly cooler on Friday. The arrival of the cooler air will be preceded by a period of rain Thursday night into Friday. A stronger shot of cold is possible next week. The chill could then linger for much of the remainder of the month. The ENSO Region 1+2 anomaly was +1.3°C and the Region 3.4 anomaly was +0.3°C for the week centered around March 12. For the past six weeks, the ENSO Region 1+2 anomaly has averaged +1.00°C and the ENSO Region 3.4 anomaly has averaged -0.18°C. Neutral ENSO conditions will likely continue into at least late spring. The SOI was +12.59 yesterday. The preliminary Arctic Oscillation (AO) was +1.053 today. Based on sensitivity analysis applied to the latest guidance, there is an implied 87% probability that New York City will have a warmer than normal March (1991-2020 normal). March will likely finish with a mean temperature near 45.7° (2.9° above normal).
-
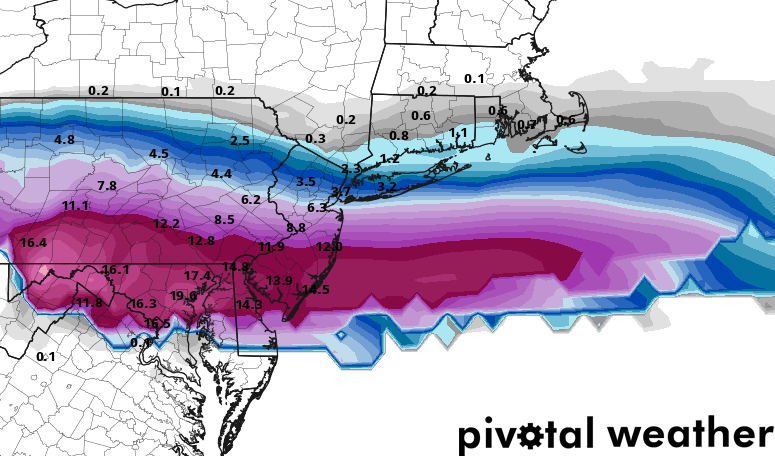
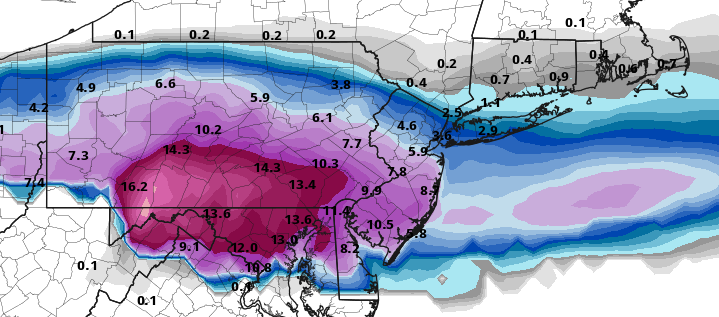
The GFS, in its current version, has a notorious reputation for struggling in the spring, especially when it comes to handling marginally cold air masses during storms. It seems that the model’s algorithms overamplify the cold, feeding back on itself until the simulated atmosphere becomes drastically colder than reality. This often leads to wildly exaggerated snowfall predictions, forecasting massive, historic snowstorms. Absent strong support from the other guidance, its big snowfall projections are pure fantasy. Most now know this reality. Therefore, few (mainly on X) now call attention to such runs. The two below maps from Pivotal Weather illustrate the GFS's problem: 3/18/2025 12z Cycle: 24-hour snowfall (10:1 ratio), Valid 3/22/2025 0z: 3/19/2025 0z Cycle: 24-hour snowfall (10:1 ratio), Valid 3/31/2025 12z: Since 1869, New York City's 10 biggest snowstorms after March 20th are: 1. 11.8", March 20-21, 1958 2. 10.2", April 3-4, 1915 3. 10.0", April 12-14, 1875 4. 9.6", April 6, 1982 5. 9.0", March 22, 1967 6. 8.5", April 1, 1924 7. 8.4", March 21-22, 2018 8. 6.5", April 8-9, 1917 and April 5, 1944 10. 6.4", April 6-7, 1938 Its latest-season snowfall of 12" or more occurred on March 12-14, 1888. Its latest-season snowfall of 24" or more occurred on February 11-12, 2006. Those are Central Park measurements. Parts of New York City very likely saw two feet of snow during the 1888 blizzard. Although one can never fully rule out an unprecedented event perhaps a farther south version of the March 31-April 1997 snowstorm that dumped 25.4" at Boston, but there was strong support for a big event just ahead of the storm. One needs strong and sustained support, especially for extraordinary events. Given the GFS's known springtime bias, it's better to wait for another model to take the lead on any potential late-season significant or major snow event. A major snowstorm remains very unlikely for the remainder of the 2024-2025 snow season. The GFS has been an outlier at all times (most recently both the 3/19 0z and 6z runs). Moreover, the historic experience following the kind of strong PNA+ ridge that predominated during the second half of February has not been followed by a 10" or greater snowfall in New York City during March 1 or later (1950-2024).
-
The mild weather will continue through Thursday. It could turn briefly cooler on Friday. The arrival of the cooler air will be preceded by a period of rain Thursday night into Friday. A stronger shot of cold is possible next week. The ENSO Region 1+2 anomaly was +1.3°C and the Region 3.4 anomaly was +0.3°C for the week centered around March 12. For the past six weeks, the ENSO Region 1+2 anomaly has averaged +1.00°C and the ENSO Region 3.4 anomaly has averaged -0.18°C. Neutral ENSO conditions will likely continue into at least late spring. The SOI was +12.59 today. The preliminary Arctic Oscillation (AO) was +0.870 today. Based on sensitivity analysis applied to the latest guidance, there is an implied 87% probability that New York City will have a warmer than normal March (1991-2020 normal). March will likely finish with a mean temperature near 46.0° (3.2° above normal).
-
The area picked up a general 0.50"-1.50" of rain. In the wake of the rainstorm, the mild weather will continue through the middle of the week. It could turn briefly cooler late next week. Aside from some rain late in the week, the week ahead should be mainly dry once today's rainstorm departs. The ENSO Region 1+2 anomaly was +1.3°C and the Region 3.4 anomaly was +0.3°C for the week centered around March 12. For the past six weeks, the ENSO Region 1+2 anomaly has averaged +1.00°C and the ENSO Region 3.4 anomaly has averaged -0.18°C. Neutral ENSO conditions will likely continue into at least late spring. The SOI was +9.96 yesterday. The preliminary Arctic Oscillation (AO) was +0.998 today. Based on sensitivity analysis applied to the latest guidance, there is an implied 93% probability that New York City will have a warmer than normal March (1991-2020 normal). March will likely finish with a mean temperature near 46.5° (3.7° above normal).
-
Rain will develop this evening. A thunderstorm is possible. The rain will end early tomorrow. A general 0.50"-1.50" rainfall is likely in and around New York City. In the wake of the rainstorm, the mild weather will continue through the middle of the week. It could turn briefly cooler late next week. Aside from some showers on Thursday, the week ahead should be mainly dry once today's rainstorm departs. The long-range guidance has turned warmer for much of the remainder of March. As a result, there is an increasing prospect that New York City has seen its last measurable snowfall of the 2024-2025 season. The ENSO Region 1+2 anomaly was +1.6°C and the Region 3.4 anomaly was 0.0°C for the week centered around March 5. For the past six weeks, the ENSO Region 1+2 anomaly has averaged +0.68°C and the ENSO Region 3.4 anomaly has averaged -0.37°C. Neutral ENSO conditions have developed. Neutral ENSO conditions will likely continue into at least late spring. The SOI was +9.96 today. The preliminary Arctic Oscillation (AO) was +0.586 today. Based on sensitivity analysis applied to the latest guidance, there is an implied 94% probability that New York City will have a warmer than normal March (1991-2020 normal). March will likely finish with a mean temperature near 46.7° (3.9° above normal).
-
The week ahead:

-
Tomorrow will be variably cloudy and unseasonably warm with temperatures rising into the lower and middle 60s. Showers and rain will arrive and continue into Monday. A thunderstorm is possible. A general 0.50"-1.50" rainfall is likely in and around New York City. In the wake of the rainstorm, the mild weather will continue through the middle of next week. It could turn briefly cooler late next week. The long-range guidance has turned warmer for much of the remainder of March. As a result, there is an increasing prospect that New York City has seen its last measurable snowfall of the 2024-2025 season. The ENSO Region 1+2 anomaly was +1.6°C and the Region 3.4 anomaly was 0.0°C for the week centered around March 5. For the past six weeks, the ENSO Region 1+2 anomaly has averaged +0.68°C and the ENSO Region 3.4 anomaly has averaged -0.37°C. Neutral ENSO conditions have developed. Neutral ENSO conditions will likely continue into at least late spring. The SOI was +9.52 today. The preliminary Arctic Oscillation (AO) was +0.256 today. Based on sensitivity analysis applied to the latest guidance, there is an implied 90% probability that New York City will have a warmer than normal March (1991-2020 normal). March will likely finish with a mean temperature near 46.7° (3.9° above normal).
-
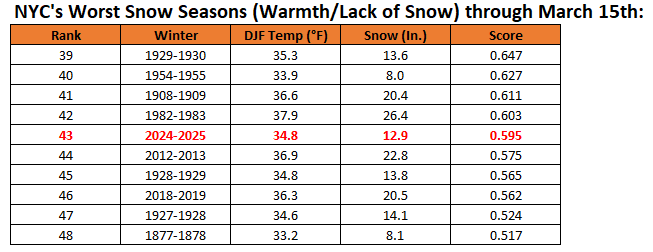
The rankings are from worst to best. Its higher ranking means that it was worse than the current winter.
-
Snow season ranking through March 15th:
-
A warming trend is now underway. Morning clouds--clouds that obscured the lunar eclipse in parts of the region--yielded to sunshine. The mercury rebounded into the lower and middle 50s. A mild weekend lies ahead. Tomorrow will be mainly cloudy with temperatures rising into the lower and middle 50s. The weekend could end with unseasonably warm temperatures in the lower and middle 60s. Rain will likely arrive on Sunday and continue into Monday. A thunderstorm is possible. A general 0.50"-1.50" rainfall is likely in and around New York City. In the wake of the rainstorm, the mild weather will continue. The long-range guidance has turned warmer for much of the remainder of March. As a result, there is an increasing prospect that New York City has seen its last measurable snowfall of the 2024-2025 season. The ENSO Region 1+2 anomaly was +1.6°C and the Region 3.4 anomaly was 0.0°C for the week centered around March 5. For the past six weeks, the ENSO Region 1+2 anomaly has averaged +0.68°C and the ENSO Region 3.4 anomaly has averaged -0.37°C. Neutral ENSO conditions have developed. Neutral ENSO conditions will likely continue into at least late spring. The SOI was +5.22 today. The preliminary Arctic Oscillation (AO) was -0.439 today. Based on sensitivity analysis applied to the latest guidance, there is an implied 93% probability that New York City will have a warmer than normal March (1991-2020 normal). March will likely finish with a mean temperature near 46.9° (4.1° above normal).
-
A warming trend will commence tomorrow. The weekend could end with unseasonably warm temperatures in the lower and middle 60s. In addition, rain will likely arrive on Sunday and continue into Monday. A general 0.50"-1.50" rainfall is likely in and around New York City. In the wake of the rainstorm, the mild weather will continue. The long-range guidance has turned warmer for much of the remainder of March. As a result, there is an increasing prospect that New York City has seen its last measurable snowfall of the 2024-2025 season. The ENSO Region 1+2 anomaly was +1.6°C and the Region 3.4 anomaly was 0.0°C for the week centered around March 5. For the past six weeks, the ENSO Region 1+2 anomaly has averaged +0.68°C and the ENSO Region 3.4 anomaly has averaged -0.37°C. Neutral ENSO conditions have developed. Neutral ENSO conditions will likely continue into at least late spring. The SOI was +12.35 today. The preliminary Arctic Oscillation (AO) was -1.369 today. Based on sensitivity analysis applied to the latest guidance, there is an implied 92% probability that New York City will have a warmer than normal March (1991-2020 normal). March will likely finish with a mean temperature near 46.9° (4.1° above normal).
-
Rain could arrive on Sunday and continue into Monday. The potential exists for a moderate to significant rainfall. The risk of a moderate (4" or more) in the New York City area remains low through at least the first three weeks of March. A significant or substantial snowfall in New York City is unlikely for the remainder of the 2024-2025 snow season. There is an increasing prospect that New York City has seen its last measurable snowfall of the 2024-2025 season. The strong PNA ridge that predominated for most of the second half of February dissipated during the first week of March. However, the peak magnitude of that previous PNA ridge suggests that the New York City area likely won't experience any major snowfalls for the remainder of the 2024-2025 snow season. The historic experience hints that the rising warmth of spring becomes too great to overcome by the time an otherwise favorable pattern for such snowfalls develops. The PNA reached +1.500 on February 19th and remained at or above +1.500 through February 23rd and at or above +1.000 through February 28th. In all 12 years that saw the PNA reach +1.500 or above on February 15 or later since 1950, the remainder of winter saw no 10" or greater snowstorms. If historic experience holds true yet again, that would make the 2024-2025 snow season the fourth consecutive snow season without a 10" or above snowstorm in New York City. The last time that happened was during 2016-2017 through 2019-2020. Most of the 12 cases cited above went on to see some additional measurable snowfall with a few seeing a 6"+ storm. The ENSO Region 1+2 anomaly was +1.6°C and the Region 3.4 anomaly was 0.0°C for the week centered around March 5. For the past six weeks, the ENSO Region 1+2 anomaly has averaged +0.68°C and the ENSO Region 3.4 anomaly has averaged -0.37°C. Neutral ENSO conditions have developed. Neutral ENSO conditions will likely continue into at least late spring. The SOI was +7.42 today. The preliminary Arctic Oscillation (AO) was -1.157 today. Based on sensitivity analysis applied to the latest guidance, there is an implied 90% probability that New York City will have a warmer than normal March (1991-2020 normal). March will likely finish with a mean temperature near 46.8° (4.0° above normal).
-
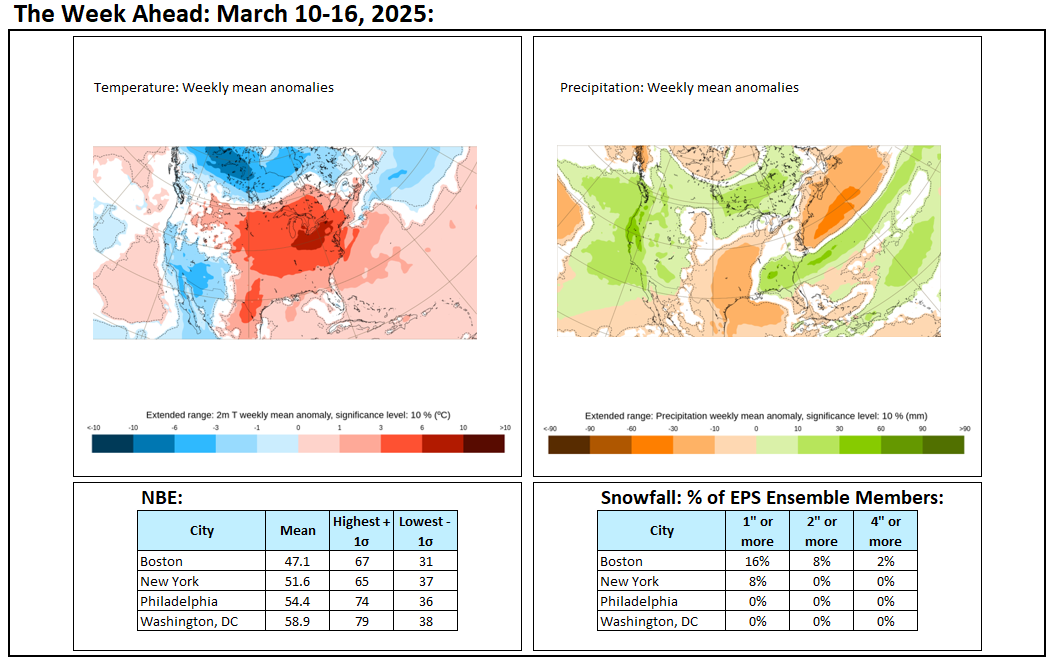
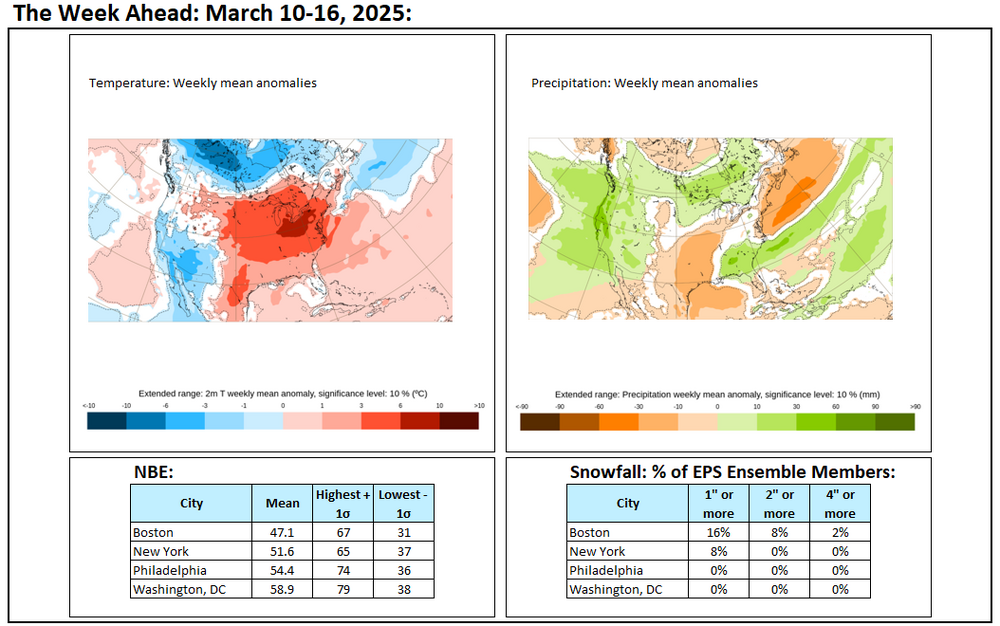
Tomorrow and Thursday will be cooler days. Highs tomorrow will reach the lower 50s. Readings on Thursday could top out in the middle and upper 40s. Nevertheless, a generally mild pattern continues and will last through at least the weekend. The March 10-17 period will see temperatures average much above normal across the Middle Atlantic and southern New England regions. Rain could arrive on Sunday and continue into Monday. The potential exists for a moderate to significant rainfall. The risk of a moderate (4" or more) in the New York City area remains low through at least the first three weeks of March. A significant or substantial snowfall in New York City is unlikely for the remainder of the 2024-2025 snow season. There is an increasing prospect that New York City has seen its last measurable snowfall of the 2024-2025 season. The strong PNA ridge that predominated for most of the second half of February dissipated during the first week of March. However, the peak magnitude of that previous PNA ridge suggests that the New York City area likely won't experience any major snowfalls for the remainder of the 2024-2025 snow season. The historic experience hints that the rising warmth of spring becomes too great to overcome by the time an otherwise favorable pattern for such snowfalls develops. The PNA reached +1.500 on February 19th and remained at or above +1.500 through February 23rd and at or above +1.000 through February 28th. In all 12 years that saw the PNA reach +1.500 or above on February 15 or later since 1950, the remainder of winter saw no 10" or greater snowstorms. If historic experience holds true yet again, that would make the 2024-2025 snow season the fourth consecutive snow season without a 10" or above snowstorm in New York City. The last time that happened was during 2016-2017 through 2019-2020. Most of the 12 cases cited above went on to see some additional measurable snowfall with a few seeing a 6"+ storm. The ENSO Region 1+2 anomaly was +1.6°C and the Region 3.4 anomaly was 0.0°C for the week centered around March 5. For the past six weeks, the ENSO Region 1+2 anomaly has averaged +0.68°C and the ENSO Region 3.4 anomaly has averaged -0.37°C. Neutral ENSO conditions have developed. Neutral ENSO conditions will likely continue into at least late spring. The SOI was +10.29 today. The preliminary Arctic Oscillation (AO) was -0.729 today. Based on sensitivity analysis applied to the latest guidance, there is an implied 85% probability that New York City will have a warmer than normal March (1991-2020 normal). March will likely finish with a mean temperature near 46.3° (3.5° above normal).
-
I don’t have daily data from there.
-
I'm not sure what was going on to explain the differences. However, I had previously run a regression equation contrasting the amounts with snowfall at Philadelphia. The Central Park site had a stronger correlation and smaller error. My hypothesis is that the Battery Park measurements were inflated at times due to drifting (stronger winds coming in off New York Harbor).
-
Under bright sunshine, the temperature surged into the middle 60s across the New York City area. Through March 10th, New York City has a monthly mean temperature of 42.3°. Since 2000, there have been 11 cases with a March 1-10 mean temperature of 42.0° or above. In 10 (91%) of cases, March wound up with a warmer than normal monthly average. In six (55%) of cases, March had a monthly temperature anomaly of 3° or more above normal. The generally unseasonably mild weather will likely continue through the remainder of the week even as Wednesday and Thursday will be briefly cooler days. The March 10-17 period will see temperatures average much above normal across the Middle Atlantic and southern New England regions. Parts of the region will likely experience their warmest weather so far this season during the warm spell. Rain could arrive on Sunday and continue into Monday. The risk of a moderate (4" or more) in the New York City area remains low through at least the first three weeks of March. A significant or substantial snowfall in New York City is unlikely for the remainder of the 2024-2025 snow season. There is an increasing prospect that New York City has seen its last measurable snowfall of the 2024-2025 season. The strong PNA ridge that predominated for most of the second half of February dissipated during the first week of March. However, the peak magnitude of that previous PNA ridge suggests that the New York City area likely won't experience any major snowfalls for the remainder of the 2024-2025 snow season. The historic experience hints that the rising warmth of spring becomes too great to overcome by the time an otherwise favorable pattern for such snowfalls develops. The PNA reached +1.500 on February 19th and remained at or above +1.500 through February 23rd and at or above +1.000 through February 28th. In all 12 years that saw the PNA reach +1.500 or above on February 15 or later since 1950, the remainder of winter saw no 10" or greater snowstorms. If historic experience holds true yet again, that would make the 2024-2025 snow season the fourth consecutive snow season without a 10" or above snowstorm in New York City. The last time that happened was during 2016-2017 through 2019-2020. Most of the 12 cases cited above went on to see some additional measurable snowfall with a few seeing a 6"+ storm. The ENSO Region 1+2 anomaly was +1.6°C and the Region 3.4 anomaly was 0.0°C for the week centered around March 5. For the past six weeks, the ENSO Region 1+2 anomaly has averaged +0.68°C and the ENSO Region 3.4 anomaly has averaged -0.37°C. Neutral ENSO conditions have developed. Neutral ENSO conditions will likely continue into at least late spring. The SOI was +6.17 today. The preliminary Arctic Oscillation (AO) was -0.850 today. Based on sensitivity analysis applied to the latest guidance, there is an implied 81% probability that New York City will have a warmer than normal March (1991-2020 normal). March will likely finish with a mean temperature near 46.0° (3.2° above normal).