donsutherland1
-
Posts
24,138 -
Joined
Content Type
Profiles
Blogs
Forums
American Weather
Media Demo
Store
Gallery
Everything posted by donsutherland1
-
Much of this week will see temperatures top out in the lower and middle 60s. Additional showers are possible on Thursday as a warm front moves northward. It will turn noticeably warmer during the weekend. Parts of the area could reach or exceed 80° on Saturday and especially Sunday. The warmth will likely continue through the middle of next week. Temperatures could rise into the upper 80s to perhaps near 90° on Tuesday and Wednesday. It will turn much cooler after midweek. The ENSO Region 1+2 anomaly was +1.6°C and the Region 3.4 anomaly was +0.9°C for the week centered around May 6. For the past six weeks, the ENSO Region 1+2 anomaly has averaged +1.50°C and the ENSO Region 3.4 anomaly has averaged +0.55°C. El Niño conditions are rapidly developing and will likely be in place in the next few weeks. The SOI was -11.78 today. The preliminary Arctic Oscillation (AO) was +1.054 today. Based on sensitivity analysis applied to the latest guidance, there is an implied near 55% probability that New York City will have a warmer than normal May (1991-2020 normal). May will likely finish with a mean temperature near 63.5° (0.3° above normal). Supplemental Information: The projected mean would be 1.0° above the 1981-2010 normal monthly value.
-
Much of this week will see temperatures top out in the lower and middle 60s. Additional showers are possible on Thursday as a warm front moves northward. It will turn noticeably warmer during the weekend. Parts of the area could reach or exceed 80° on Saturday and especially Sunday. The warmth will likely continue into early next week. In the long-range, there has been a shift in the guidance toward a near or somewhat warmer than normal second half of May. The probability of a warmer than normal second half of May has increased. The ENSO Region 1+2 anomaly was +1.6°C and the Region 3.4 anomaly was +0.9°C for the week centered around May 6. For the past six weeks, the ENSO Region 1+2 anomaly has averaged +1.50°C and the ENSO Region 3.4 anomaly has averaged +0.55°C. El Niño conditions are rapidly developing and will likely be in place in the next few weeks. The SOI was -11.78 today. The preliminary Arctic Oscillation (AO) was +0.980 today. Based on sensitivity analysis applied to the latest guidance, there is an implied near 50% probability that New York City will have a cooler than normal May (1991-2020 normal). May will likely finish with a mean temperature near 63.2° (near normal). Supplemental Information: The projected mean would be 0.7° above the 1981-2010 normal monthly value.
-
Much of this week will see temperatures top out in the lower and middle 60s. Additional showers are possible on Thursday as a warm front moves northward. There remains a risk that the front could stall for a time. Friday could see temperatures return to the 70° or above should the front clear the region. It will turn warmer during the weekend. Parts of the area could reach or exceed 80° on Saturday and especially Sunday. In the long-range, there has been a shift in the guidance toward a near or somewhat warmer than normal second half of May. The probability of a warmer than normal second half of May has increased. The ENSO Region 1+2 anomaly was +1.6°C and the Region 3.4 anomaly was +0.9°C for the week centered around May 6. For the past six weeks, the ENSO Region 1+2 anomaly has averaged +1.50°C and the ENSO Region 3.4 anomaly has averaged +0.55°C. El Niño conditions are rapidly developing and will likely be in place in the next few weeks. The SOI was -9.25 today. The preliminary Arctic Oscillation (AO) was +0.922 today. Based on sensitivity analysis applied to the latest guidance, there is an implied near 50% probability that New York City will have a cooler than normal May (1991-2020 normal). May will likely finish with a mean temperature near 63.2° (near normal). Supplemental Information: The projected mean would be 0.7° above the 1981-2010 normal monthly value.
-
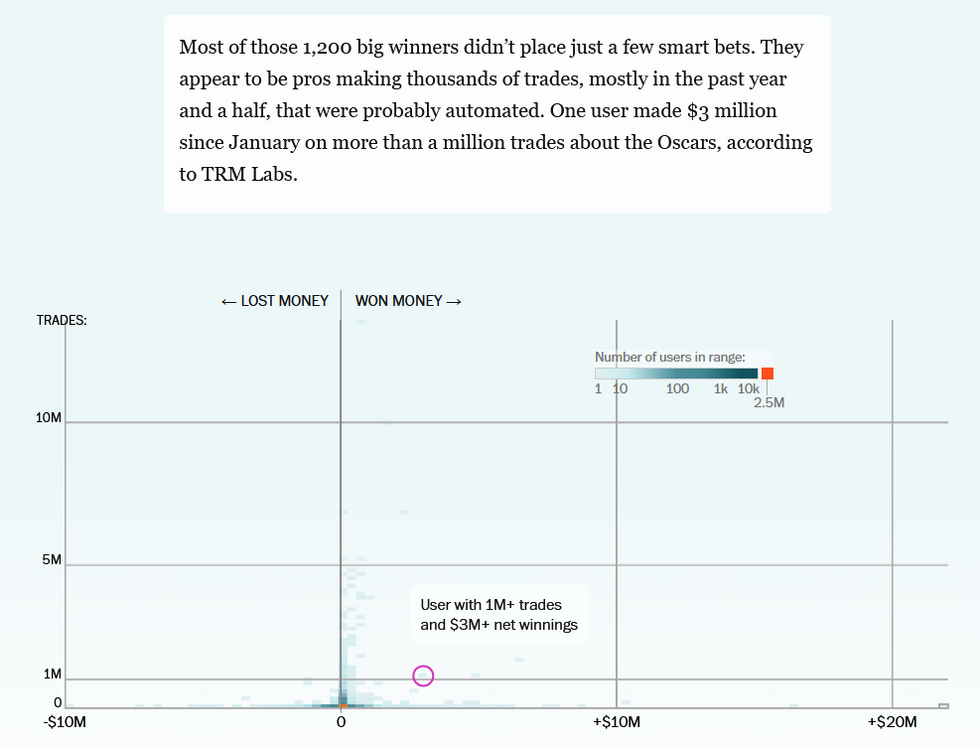
The Washington Post has a feature story concerning prediction markets. Far from this form of betting providing insight into the future, the Post's article suggests manipulation through massive numbers of automated transactions of 1 million or more transactions (roughly one every 3 seconds). If so, the prediction value is limited, as perceptions are created to back a given narrative disconnected from actual probabilities (an issue that is much less present in large, deep markets where handfuls of accounts lack the capacity to manipulate prices in most cases). As transactions in any buying-selling decision influence prices, these automated trades almost certainly have a price impact and, in the process, give their users a qualitative advantage by creating a skewed perception about the future. Not mentioned, but also a consideration, is the possession and use of inside information. Examples where such information might have been involved range from large trades shortly before President made tariff-related announcements e.g., postponing their implementation, and the recent military operation to remove President Maduro from Venezuela (one special forces soldier involved in the operation had placed large bets). One image from the piece: The full story can be found here: https://wapo.st/49o6Jxc
-
Five photos from the New York Botanical Garden today:


-
May 1-10 is finishing with a mean temperature of 58.8° in Central Park. That is 1.6° below normal. Some additional showers and a thundershower are possible late tonight. Much of this week will see temperatures top out in the lower and middle 60s. Additional showers are possible on Thursday as a warm front moves northward. There remains a risk that the front could stall for a time. Friday could see temperatures return to the 70° or above should the front clear the region. It will turn warmer during the weekend. Parts of the area could reach or exceed 80° on Saturday and especially Sunday. In the long-range, there has been a shift in the guidance toward a near or somewhat warmer than normal second half of May. The probability of a warmer than normal second half of May has increased. The ENSO Region 1+2 anomaly was +1.3°C and the Region 3.4 anomaly was +0.9°C for the week centered around April 29. For the past six weeks, the ENSO Region 1+2 anomaly has averaged +1.47°C and the ENSO Region 3.4 anomaly has averaged +0.42°C. El Niño conditions will likely develop during late spring or early summer. The SOI was +1.86 today. The preliminary Arctic Oscillation (AO) was +0.109 today. Based on sensitivity analysis applied to the latest guidance, there is an implied near 51% probability that New York City will have a cooler than normal May (1991-2020 normal). May will likely finish with a mean temperature near 63.0° (0.2° below normal). Supplemental Information: The projected mean would be 0.5° above the 1981-2010 normal monthly value.
-
Occasional Thoughts on Climate Change
donsutherland1 replied to donsutherland1's topic in Climate Change
There is actually one paper that suggests that AI-generated headlines may garner greater attention. https://www.mdpi.com/2673-5172/5/4/110 This concerns me. My worry is that sometimes the actual nuance is lost in the AI-generated content. As a result, even as the headlines might be catchy, those headlines could be somewhat inconsistent with the content. That creates a credibility gap (which already occurs with "clickbait" headlines). I am not aware of research on that aspect of AI usage. I remain an advocate of AI, but suggest that one should beware of its knowledge limits (pre-training) and working context. The former can lead to an inability to analyze novel situations, extreme outcomes, etc., e.g., it's no accident that physics-based models remain superior to AI when it comes to forecasting extreme events. The latter can impede the quality of the AI's output even as subsequent models have grown better at following instructions and understanding the user's goals/intent. Overall, AI can create stunning visualizations/infographics. I use it at work for just that purpose e.g., creating graphics for presentation slides. I still need to verify the output as every now and then, things need to be tweaked. AI can also assess the strength and weakness of arguments and help identify "blind spots." I don't believe AI should be used to generate all arguments, much less as a substitute for human judgment. That's the case even as there are more advanced features that can also be applied, an increased capacity in AI coding (Claude Code, Codex, etc.) and sustained work that can be carried out through agentic AI. Finally, these are my opinions. Others may well disagree with me. -
After some additional rain and showers tonight into early tomorrow, tomorrow will turn noticeably warmer under variably cloudy skies. Highs will likely top out in the middle 70s. Some additional showers and a thundershower are possible late tomorrow and tomorrow night. Nevertheless, the first 10 days of May will likely see temperatures average cooler than normal normal overall. Much of next week will see temperatures top out in the lower and middle 60s. Additional showers are possible Thursday and Friday as a frontal boundary stalls near the region. Warmer air could arrive during the weekend. In the long-range, there has been a shift in the guidance toward a near or somewhat warmer than normal second half of May. The probability of a warmer than normal second half of May has increased. The ENSO Region 1+2 anomaly was +1.3°C and the Region 3.4 anomaly was +0.9°C for the week centered around April 29. For the past six weeks, the ENSO Region 1+2 anomaly has averaged +1.47°C and the ENSO Region 3.4 anomaly has averaged +0.42°C. El Niño conditions will likely develop during late spring or early summer. The SOI was +6.07 today. The preliminary Arctic Oscillation (AO) was -0.659 today. Based on sensitivity analysis applied to the latest guidance, there is an implied near 54% probability that New York City will have a cooler than normal May (1991-2020 normal). May will likely finish with a mean temperature near 62.5° (0.7° below normal). Supplemental Information: The projected mean would be 0.1° above the 1981-2010 normal monthly value.
-
Somewhat cooler weather will continue through the remainder of the week. The first 10 days of May will likely see temperatures average cooler than normal normal overall. Showers are possible tomorrow into tomorrow evening as a warm front moves across the region. Sunday will turn warmer with highs reaching the 70s. Additional rain and somewhat cooler conditions will return for Sunday night into Monday. Rainfall amounts are not likely to be significant. In the long-range, there has been a shift in the guidance toward a near or somewhat warmer than normal second half of May. The probability of a warmer than normal second half of May has increased. The ENSO Region 1+2 anomaly was +1.3°C and the Region 3.4 anomaly was +0.9°C for the week centered around April 29. For the past six weeks, the ENSO Region 1+2 anomaly has averaged +1.47°C and the ENSO Region 3.4 anomaly has averaged +0.42°C. El Niño conditions will likely develop during late spring or early summer. The SOI was -0.90 today. The preliminary Arctic Oscillation (AO) was -0.612 today. Based on sensitivity analysis applied to the latest guidance, there is an implied near 60% probability that New York City will have a cooler than normal May (1991-2020 normal). May will likely finish with a mean temperature near 62.2° (1.0° below normal). Supplemental Information: The projected mean would be 0.2° below the 1981-2010 normal monthly value.
-
Occasional Thoughts on Climate Change
donsutherland1 replied to donsutherland1's topic in Climate Change
It's uncertain. "Internal climate variability" could concern long-period ocean circulation. Seismic/volcanic activity aren't the only explanation for internal variability. I welcome additional research. Overall, I suspect that anthropogenic and natural variables are contributing, though the anthropogenic one is probably growing relative to the impact of natural variables due to increasing anthropogenic forcing. -
Somewhat cooler weather will continue through the remainder of the week. The first 10 days of May will likely see temperatures average cooler than normal normal overall. Showers are possible Saturday night as a warm front moves across the region. Sunday will turn warmer with highs reaching the 70s. Additional rain and somewhat cooler conditions will return for Monday. In the long-range, there has been some shift in the guidance toward a near or somewhat warmer than normal second half of May. The ENSO Region 1+2 anomaly was +1.3°C and the Region 3.4 anomaly was +0.9°C for the week centered around April 29. For the past six weeks, the ENSO Region 1+2 anomaly has averaged +1.47°C and the ENSO Region 3.4 anomaly has averaged +0.42°C. El Niño conditions will likely develop during late spring or early summer. The SOI was -5.50 today. The preliminary Arctic Oscillation (AO) was -0.040 today. Based on sensitivity analysis applied to the latest guidance, there is an implied near 59% probability that New York City will have a cooler than normal May (1991-2020 normal). May will likely finish with a mean temperature near 62.2° (1.0° below normal). Supplemental Information: The projected mean would be 0.2° below the 1981-2010 normal monthly value.
-
Somewhat cooler weather will conclude the week. Overall, the first 10 days of May will likely see temperatures average cooler than normal normal overall. Showers are possible Saturday night as a warm front moves across the region. Sunday will turn warmer with highs reaching the 70s. Additional rain and somewhat cooler conditions will return for Monday. The ENSO Region 1+2 anomaly was +1.3°C and the Region 3.4 anomaly was +0.9°C for the week centered around April 29. For the past six weeks, the ENSO Region 1+2 anomaly has averaged +1.47°C and the ENSO Region 3.4 anomaly has averaged +0.42°C. El Niño conditions will likely develop during late spring or early summer. The SOI was -2.89 today. The preliminary Arctic Oscillation (AO) was -0.007 today.
-
A cold front moved across the region this morning bringing some scattered showers. Tomorrow will be especially cool with morning lows in the middle 40s in New York City and 30s in many suburban areas. The coldest spots could experience a freeze. Highs will reach the upper 50s to lower 60s despite partly sunny skies. It will then turn springlike early next week with readings reaching the 70s on Monday through Wednesday. Parts of the region, especially interior sections of New Jersey, could reach 80° or above on Tuesday. However the first 10 days of May will likely see temperatures average somewhat below normal overall. The ENSO Region 1+2 anomaly was +1.5°C and the Region 3.4 anomaly was +0.7°C for the week centered around April 22. For the past six weeks, the ENSO Region 1+2 anomaly has averaged +1.47°C and the ENSO Region 3.4 anomaly has averaged +0.27°C. El Niño conditions will likely develop during late spring or early summer. The SOI was -0.29 today. The preliminary Arctic Oscillation (AO) was +0.418 today.
-
May has opened with cooler than normal conditions. New York City saw the temperature fall to 46° this morning. Some areas saw readings in the 30s. Danbury reached 34° and Poughkeepsie saw the temperature fall to 35°. A shower is possible tomorrow as cooler air continues to move into the region. Sunday could be especially cool with highs only in the upper 50s to near 60° despite partly sunny skies. It could turn more springlike early next week with readings reaching the lower 70s on Tuesday and Wednesday. However the first 7-10 days of May will likely see temperatures average below normal overall. The ENSO Region 1+2 anomaly was +1.5°C and the Region 3.4 anomaly was +0.7°C for the week centered around April 22. For the past six weeks, the ENSO Region 1+2 anomaly has averaged +1.47°C and the ENSO Region 3.4 anomaly has averaged +0.27°C. El Niño conditions will likely develop during late spring or early summer. The SOI was -2.36 today. The preliminary Arctic Oscillation (AO) was -0.187 today.
-
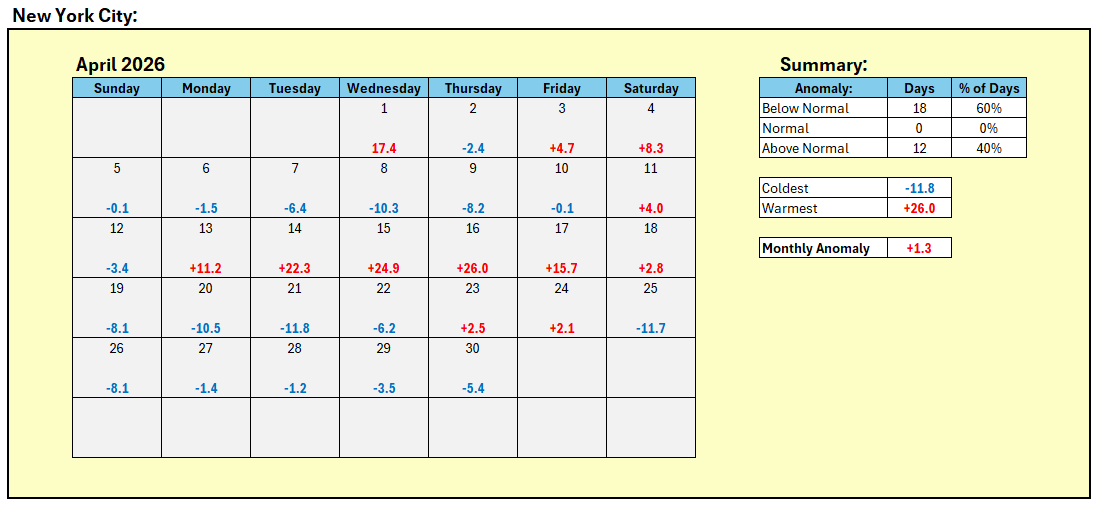
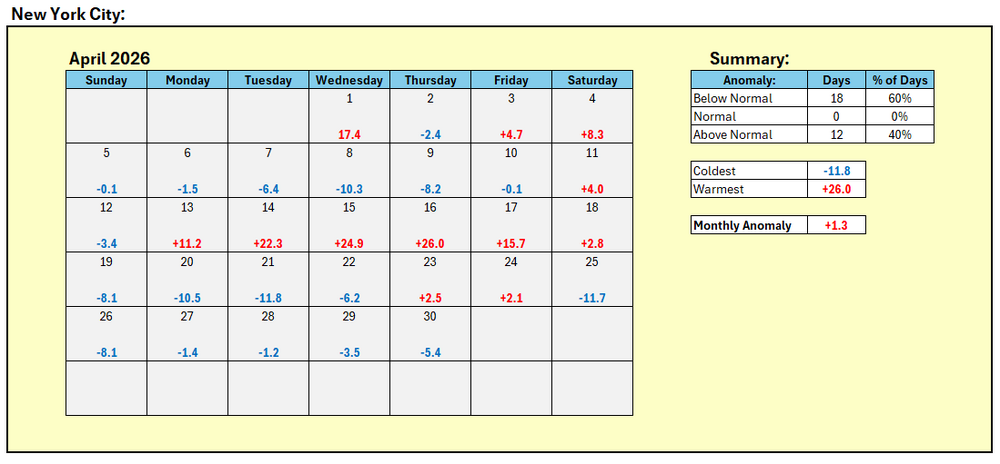
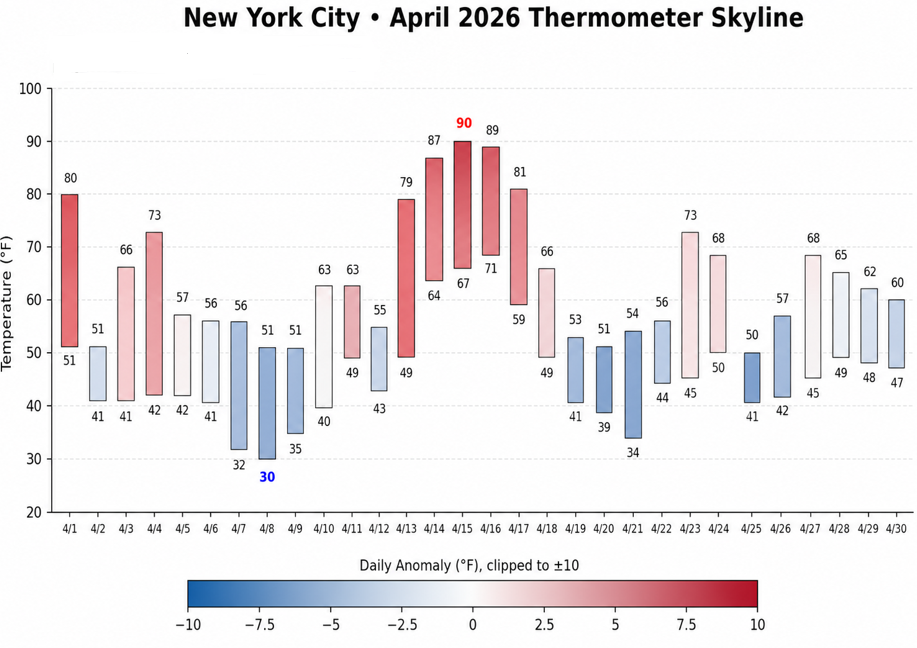
Final numbers for April 2026: Mean Temperature: 55.0° (1.3° above normal).
- 970 replies
-
- 1
-

-
- april showers bring may..
- rain
- (and 2 more)
-
April is finishing with a mean temperature of 55.0° (1.3° above normal/2.0° above the earlier 1981-2010 baseline). May will open with cooler than normal conditions. A shower is possible on Saturday as cooler air moves into the region. Sunday could be especially cool with highs only in the upper 50s to near 60° despite partly sunny skies. It could turn more springlike early next week with readings reaching the lower 70s on Tuesday and Wednesday. However the first 7-10 days of May will likely see temperatures average below normal overall. The ENSO Region 1+2 anomaly was +1.5°C and the Region 3.4 anomaly was +0.7°C for the week centered around April 22. For the past six weeks, the ENSO Region 1+2 anomaly has averaged +1.47°C and the ENSO Region 3.4 anomaly has averaged +0.27°C. El Niño conditions will likely develop during late spring or early summer. The SOI was -10.17 today. The preliminary Arctic Oscillation (AO) was +0.224 today.
-
May DCA NYC BOS ORD ATL IAH DEN PHX SEA -1.0 -0.8 -0.3 -1.0 -0.1 0.0 +0.5 +0.7 +2.5
-
It will be rainy tonight into tomorrow morning. A general 0.50"-1.00" rainfall appears likely. Following the rainfall, temperatures will top out in the lower to perhaps middle 60s through Saturday. May will likely open with cooler than normal conditions. Sunday could be especially cool with highs only in the upper 50s despite partly sunny skies. The ENSO Region 1+2 anomaly was +1.5°C and the Region 3.4 anomaly was +0.7°C for the week centered around April 22. For the past six weeks, the ENSO Region 1+2 anomaly has averaged +1.47°C and the ENSO Region 3.4 anomaly has averaged +0.27°C. El Niño conditions will likely develop during late spring or early summer. The SOI was -5.41 today. The preliminary Arctic Oscillation (AO) was +0.224 today. Based on sensitivity analysis applied to the latest guidance, there is an implied near 100% probability that New York City will have a warmer than normal April (1991-2020 normal). April will likely finish with a mean temperature near 55.2° (1.5° above normal). Supplemental Information: The projected mean would be 2.2° above the 1981-2010 normal monthly value.
- 970 replies
-
- 1
-
-
- april showers bring may..
- rain
- (and 2 more)
-
This is the first I heard about it. Thanks for sharing this update.
-
Tomorrow will see temperatures reach the lower 60s. Another shot of rain will arrive. A general 0.50"-1.00" rainfall appears likely tomorrow into Thursday. Following the rainfall, temperatures will top out in the lower 60s through Saturday. May will likely open with cooler than normal conditions. Sunday could be especially cool with highs only in the upper 50s. The ENSO Region 1+2 anomaly was +1.5°C and the Region 3.4 anomaly was +0.7°C for the week centered around April 22. For the past six weeks, the ENSO Region 1+2 anomaly has averaged +1.47°C and the ENSO Region 3.4 anomaly has averaged +0.27°C. El Niño conditions will likely develop during late spring or early summer. The SOI was -15.07 today. The preliminary Arctic Oscillation (AO) was +0.394 today. Based on sensitivity analysis applied to the latest guidance, there is an implied near 100% probability that New York City will have a warmer than normal April (1991-2020 normal). April will likely finish with a mean temperature near 55.2° (1.5° above normal). Supplemental Information: The projected mean would be 2.2° above the 1981-2010 normal monthly value.
- 970 replies
-
- 1
-
-
- april showers bring may..
- rain
- (and 2 more)
-
Tomorrow and Wednesday will see temperatures reach the lower and middle 60s, with tomorrow being the warmer day. However, another shot of rain followed by somewhat cooler temperatures will arrive during the middle of the week. A general 0.50"-1.00" rainfall appears likely for Wednesday into Thursday. May could also open with cooler than normal conditions. The ENSO Region 1+2 anomaly was +1.5°C and the Region 3.4 anomaly was +0.7°C for the week centered around April 22. For the past six weeks, the ENSO Region 1+2 anomaly has averaged +1.47°C and the ENSO Region 3.4 anomaly has averaged +0.27°C. El Niño conditions will likely develop during late spring or early summer. The SOI was -19.11 today. The preliminary Arctic Oscillation (AO) was -0.189 today. Based on sensitivity analysis applied to the latest guidance, there is an implied near 100% probability that New York City will have a warmer than normal April (1991-2020 normal). April will likely finish with a mean temperature near 55.2° (1.5° above normal). Supplemental Information: The projected mean would be 2.2° above the 1981-2010 normal monthly value.
- 970 replies
-
- 1
-
-
- april showers bring may..
- rain
- (and 2 more)
-
The recent rain delivered 0.50"-1.50" of rain to the region, along with some locally higher figures. Rainfall amounts included: Bridgeport: 0.89" Islip: 1.31" New Haven: 0.74" New York City-Central Park: 1.39" New York City-JFK Airport: 1.49" New York City-LaGuardia Airport: 1.45" Newark: 1.64" Philadelphia: 0.51" White Plains: 1.07" Tomorrow through Wednesday will be somewhat warmer with highs reaching the lower and middle 60s. However, another shot of rain followed by cooler temperatures will arrive during the middle of the week. A general 0.50"-1.00" rainfall appears likely for Wednesday into Thursday. May could also open with cooler than normal conditions. The ENSO Region 1+2 anomaly was +1.8°C and the Region 3.4 anomaly was +0.5°C for the week centered around April 15. For the past six weeks, the ENSO Region 1+2 anomaly has averaged +1.43°C and the ENSO Region 3.4 anomaly has averaged +0.15°C. El Niño conditions will likely develop during late spring or early summer. The SOI was -28.05 today. The preliminary Arctic Oscillation (AO) was -0.960 today. Based on sensitivity analysis applied to the latest guidance, there is an implied near 98% probability that New York City will have a warmer than normal April (1991-2020 normal). April will likely finish with a mean temperature near 55.2° (1.5° above normal). Supplemental Information: The projected mean would be 2.2° above the 1981-2010 normal monthly value.
-
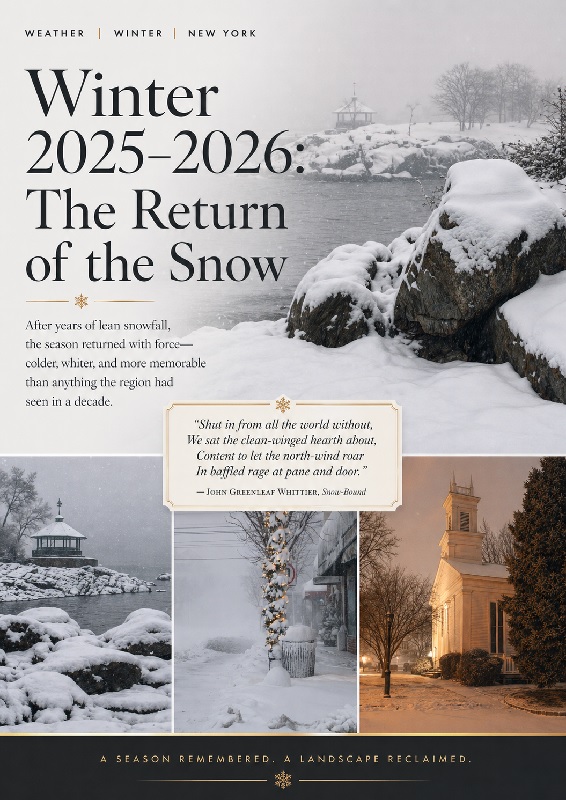
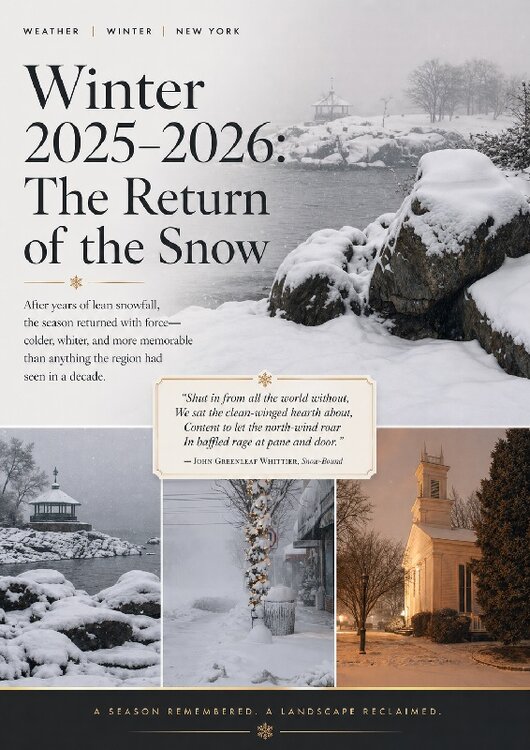
With OpenAI releasing Images 2.0, I decided to test it to make a poster depicting Winter 2025-2026. I used four of my photos and provided some content. I then prompted it to create a poster based on the images and textual content. Here's what it came up with: I also did the same with five photos I took at the New York Botanical Garden and The Cloisters. I asked for a highly creative arrangement where the tulip photos would comprise a tulip. All said, Image 2.0 is far more advanced than the preceding version.

-
Additional rain and showers are likely tonight and tomorrow. A storm total 0.50"-1.50" rainfall with some locally higher amounts remains on track. It will also remain unseasonably cool with temperatures topping out in the middle 50s to end the weekend. Monday and Tuesday will be somewhat warmer with highs reaching the lower and middle 60s. However, another shot of rain and cooler temperatures will arrive during the middle of the week. May could also open with cooler than normal conditions. The ENSO Region 1+2 anomaly was +1.8°C and the Region 3.4 anomaly was +0.5°C for the week centered around April 15. For the past six weeks, the ENSO Region 1+2 anomaly has averaged +1.43°C and the ENSO Region 3.4 anomaly has averaged +0.15°C. El Niño conditions will likely develop during late spring or early summer. The SOI was -28.48 today. The preliminary Arctic Oscillation (AO) was -0.884 today. Based on sensitivity analysis applied to the latest guidance, there is an implied near 96% probability that New York City will have a warmer than normal April (1991-2020 normal). April will likely finish with a mean temperature near 55.2° (1.5° above normal). Supplemental Information: The projected mean would be 2.2° above the 1981-2010 normal monthly value.
- 970 replies
-
- 2
-
-
- april showers bring may..
- rain
- (and 2 more)
-
Yes, things have trended cooler. The onset of late-season blocking has played an important role.
- 970 replies
-
- 2
-
-
- april showers bring may..
- rain
- (and 2 more)