frd
-
Posts
7,133 -
Joined
-
Last visited
Content Type
Profiles
Blogs
Forums
American Weather
Media Demo
Store
Gallery
Everything posted by frd
-
Thinking our area benefits from the percieved boundary interacting with robust WAR and numerous tropical systems, either directly or indirectly. Record dews again this past summer.
-
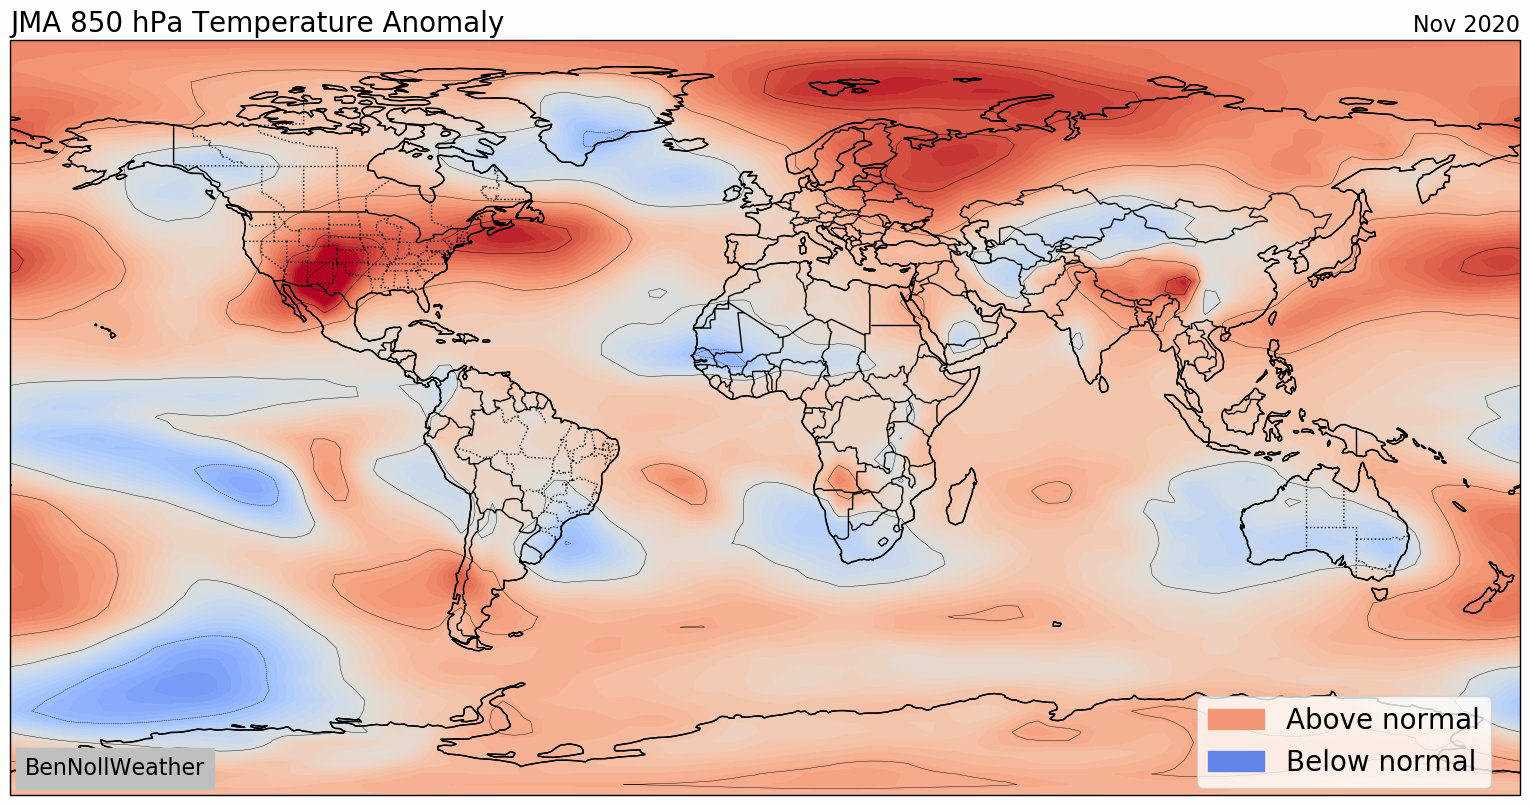
Looking ahead to November the JMA is a bit warmish.

-
Impressive. Rain not making it across the C&D Canal presently. Chilly out though. Huge leaf drop yesterday in my area.
-
WPC very bullish with high rainfall amounts over large areas.
-
Never stated the winter will be awesome for cold and snow. I would at least entertain the possibility of a cold period in December, as well as some significant temp swings. I still feel that things are progressing for some cold in November as well. The Ural High looks to set up and may stay for a while. Contrasting forecasts regarding the pv from the GEFS and the CFSv2 continue. Also, the Nina is changing up a bit in terms of expanse. That is important to consider for a seasonal forecast despite what the models are showing in the high latitudes with a lack of blocking presently. .
-
Disgusting out . Feels tropical and gross! Where did Fall go ?
-
I believe signs point to a normal December in the Northeast temp wise. . Expecting a change although temporary to a more blocking pattern. Advantages in regards to the SAI I feel contribute to a cold(er) December period. Of course speculation. NH and especially North Amercia snow cover still look to rapidly expand next 5 to 8 days.
-
Looks to increase significantly over the next 7 days.
-
@psuhoffman knows more about this then me but I believe there may be a connection according to some mets that certain phases of the MJO correlate with a + AO and some with a - AO. It is much more complicated then what I listed here tending to do with winds, circulations and the PV. I believe TIP mentioned phases 2 to 6 equate to a more pronounced + AO , while the other phases are more so opposite. I find it interesting that we are now in phase 5 with a +AO and a pv that is getting stronger. Ventrice mentioned yesterday we may make progress to MJO phases 8 and 1 in November. If so, could that promote a weakening pv and a transitioning AO to a negative state? Mid November looks interesting to me. Don't forget too the development of the Ural High as well.
-
SAI and the Ural High are two different things as you know. I certainly put more faith and value on the Ural High connection then tracking weekly snowfall above 60 degrees North.
-
With the amount of busted winter forecasts the last 2 to 3 years I wouldn't jump to any conclusion. Solar minimum might be included in the current grouping of crazy indices such as the QBO, MJO wamer phase, and others.
-
Maybe the GFS wasn't so crazy with the phase potential. As mentioned a couple days ago, we may get a wave breaking event .
-
Everything is out of whack with the indices such as the QBO for example and I am simply mentioning something I read from Tip over in the NE winter forum. I thought what he mentioned supported some of the forecasts last winter regarding the solar min and a winter - AO . Later I read that there is a delayed factor, and actually the effect of a solar min may have more to do with its impact on the North Atlantic currents, ( and the - NAO ) . The ocean outcome on the NAO domain may take some time. HM mentioned the Greenland summer ice melts since 2013, and how this is messing up what you might expect. Or, as HM stated, it throws a monkey wrench into the possible correlation of the spring SST tripole and the ensuing winter's NAO phase. As for TIP he stated this in regards to the -AO and solar minimums : (please note - this is only a portion of his post - see the bolded part ) < I personally believe the recent observations wrt to the HC also play a role in enhancing the +AO, because: .. intuitively, the 2-6 phases of the MJO are probably getting a large/super synoptic scale constructive interference pattern by the current +HC ... which offers an early clue as to +AO winter ... experimental. Which is interesting, because the solar minimum going back hundreds of years of reanalysis ..certainly correlates reasonably well if not fantastically so, with the -AO ...again...we're stuck with diametric signals here. >
-
Last couple years we had good gains and I believe record North America snow cover in early December . Then, after December 20th it starts to shrink due to Pac air and a warmer NA pattern. Last year, and the year before were very abrupt turn around. However, my speculation is that we at least may get an impact from this moving into mid to later November, in terms of colder air . The SAI and extent regarding a connection to the winters dominant ensuing AO phase has basically be proven false. However, we do need a healthy cryosphere to support significant cold in our region. We may get some a few -EPO intervals this winter.
-
Look at the winter thread I covered it there.
-
For those who follow the PDO , this is an eye opener. As bluewave noted, you do not typically see this in a Nina. Oh, and as you can see from the image below unless you are talking real time cause and effect, don't get excited just yet. Just look at last December 1 st and then the following Jan 15 th time period. We went from + PDO to negative PDO in a matter of weeks, with a two point deviation decline. < The PDO isn’t following the La Niña playbook this fall. This was one of the biggest PDO increases during a La Niña in October. But as we have seen since the record North Pacific warming in 2013, these monthly values can really jump around a lot. Last winter we went from positive in December to negative during January and February. It all comes down to how the North Pacific ridge behaves. >
-
Beach chase coming up !
-
Interesting https://www.osti.gov/biblio/1613223 Ural Blocking as a Driver of Early-Winter Stratospheric Warmings Abstract This study explores the early-winter atmospheric response to Ural blocking anomalies in November, using a nudging technique to constrain the temperature and dynamics in a high-top atmospheric model. Persistent Ural blocking anomalies in November are associated with a warm Arctic/cold Siberia pattern and increased upward planetary waves entering the stratosphere, leading to a warming of the polar vortex. This stratospheric response then propagates in the troposphere, leading to increased occurrence of the negative North Atlantic Oscillation in December and January. In contrast, simulations with perturbed Barents-Kara sea ice and Siberian snow in November do not reproduce a significant atmospheric response. In simulations including a slab ocean, the Ural blocking induces Barents-Kara sea ice and Siberia snow anomalies that resemble composite analyses from observations. These results highlight Ural blocking variability in November as a robust driver of early-winter stratospheric warming while questioning causality between sea ice/snow and Ural blocking anomalies.
-
A look at the latest CFSv2 and the GEFS 35 day forecasts we see overall the early season vortex still close to the seasonal ERA5 mean. The CFSv2 actually a little below the mean, with the GEFS slightly above the ERA5 mean. While the 35 day GEFS tracks the PV slightly above the seasonal ERA5 mean.
-
Speaking of the Ural High and the Scandi - Greenland pattern, maybe showing up in a more significant fashion for the month of November. Worth following, as the implications are significant, both short-term and long-term.
-
Many of those factors we have heard already, especially the possibility regarding the poleward Aleutian ridge. Wondering the effect of less sea ice, however, my thoughts focus on rapid snow cover up North along with a November enhanced - EPO / +PNA later November. Snow is indeed expanding now in week 42 up North. How long the SST configuration lasts off the West Coast / North Pac is up to debate. I am not so sure about a + NAO though, feel there may be a couple - episodes. Speculation on the Ural High connection. Keep an eye too on the Scandinavia–Greenland pattern . Although hard to predict beyond week 2. More about that on the link below. https://rmets.onlinelibrary.wiley.com/doi/10.1002/qj.3892
-
So true. Only with climate adjustments and weighting can you even begin to consider older analogs .
-
Speaking of analogs, take from this what you want. Both threads below have very interesting takes on climatology, analogs and SSTs . 1942 did happen during WWII.
-
As Anthony mentions, the weekly value does not define the strength of the Nina. However, it has joined a few others in the strong group, in week 42.
-
Interesting update. Do you feel those analogs you mention are still useful in our present climate regime? You must feel they have have some merit of course, as you stated they are the " best ENSO match by a combo of structure and intensity," but wondering whether you could comment further.