

calculus1
-
Posts
5,076 -
Joined
-
Last visited
Content Type
Profiles
Blogs
Forums
American Weather
Media Demo
Store
Gallery
Posts posted by calculus1
-
-
10 minutes ago, BooneWX said:
3 inches of snow, prob an inch of sleet followed by a 1/4” of ice. Ice rink.
Now that's a traditional foothills special from days of growing up in the 1980s and 1990s. Bring it on! Amazing sledding conditions.
-
 7
7
-
-
Had a nice glaze over everything this morning. I was surprised.
-
1
-
-
31.7/29 as I head to bed. No precipitation at the moment.
.-
2
-
-
32.0/28 with drizzle. That precipitation has dragged the temperature down quickly, but we'll see how long it lasts at freezing or lower. I don't notice any glaze, as of yet, even on the elevated surfaces.
-
2
-
-
WWAs just got extended to Catawba, Iredell, and Rowan counties until 7 AM...
...for a light glaze.
-
2
-
-
2 hours ago, WinstonSalemArlington said:
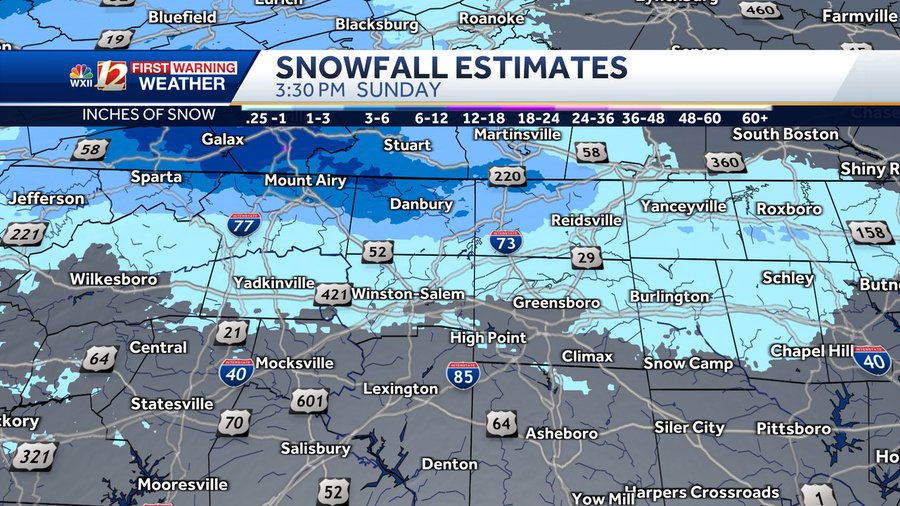
That is crazy! 6+ inches of surprise snowfall in Galax and surrounding areas?!?!
-
1
-
-
33.2/26 with drizzle
-
1
-
-
33.7/26 now
-
1
-
-
34.3/25 here. Think I am a bit too east for any ZR tonight, but I could be wrong.
.-
1
-
-
Moderate sleetfest outside. 35.2/19 here.
.-
1
-
-
…featuring the good ol’ leeside minimum FTW!

Edit: I know, I know. Way too early to sweat such details. But, we’ve been burned by the Apps so many times, too.
-
2
-
-
Mountain cams are pretty impressive right now on Resort Cams. Black Mountain actually has quite the snow showers right now. More than Boone, Blowing Rock, or Beech Mt, in terms of rate of snowfall. (Those other places have more on the ground, though.)
-
2
-
-
Year 2024 final stats from my backyard Davis Vantage Vue:
- Hi Temp: 100.4 F
- Hi DP: 82 F
- Hi Pressure: 1043.8 mb
- Lo Temp: 11.8 F
- Lo DP: 3 F
- Lo Pressure: 991.0 mb
- Total Rainfall: 69.71 inches
This year's rainfall total increased my 10-year mean annual rainfall by ~2.5 inches to 63.17 inches and increased my 10-year median annual rainfall by ~3.5 inches to 60.48 inches.
-
53 minutes ago, wncsnow said:
We used to get a lot of snow to sleet to ZR storms.
And, they made for excellent sledding conditions. I remember several of those types of storms growing up in the 80s and 90s in Lenoir. 4-6 inches of snow, followed by a half inch of sleet, and then a glaze of ice makes for fantastic sledding, as I recall.
-
Almost 1/3 odds now for Hickory to net more than 6 inches. We are going to riot soon [mention=4420]calculus1[/mention]
I know! I am afraid to mention anything to anyone about our chances. Don’t wanna jinx it. I’m thankful the weather has been seasonal, at least, this winter. And now, it’s looking like some true winter cold is on the way. Just got to time the precipitation right.
On a related note, I feel the pain, @wncsnow , but I’m not quite to the doom-posting level that you have reached. I suppose I had the benefit of watching snow fall for an hour or so back in early December. That was such a nice treat, even though it only amounted to a minor dusting.
.-
 2
2
-
-
Bring it on! I am cautiously optimistic for January, while still telling all my friends and family that it can no longer snow in Hickory: It’s climatologically impossible.

-
1
-
-
Merry Christmas, foothills gang! I asked Santa for no downsloping and a true Miller A.
-
7
-
-
Don't have my final tally here at work, but it was still raining when I left home. We were at over 4 inches of rainfall yesterday and today combined when I left. Crazy. That's almost four feet of potential snow...
-
2
-
-
Google promising incredibly accurate AI-generated 15-day forecasts. I'll believe it when I see it...
https://www.barrons.com/news/google-says-ai-weather-model-masters-15-day-forecast-cdc5793d
-
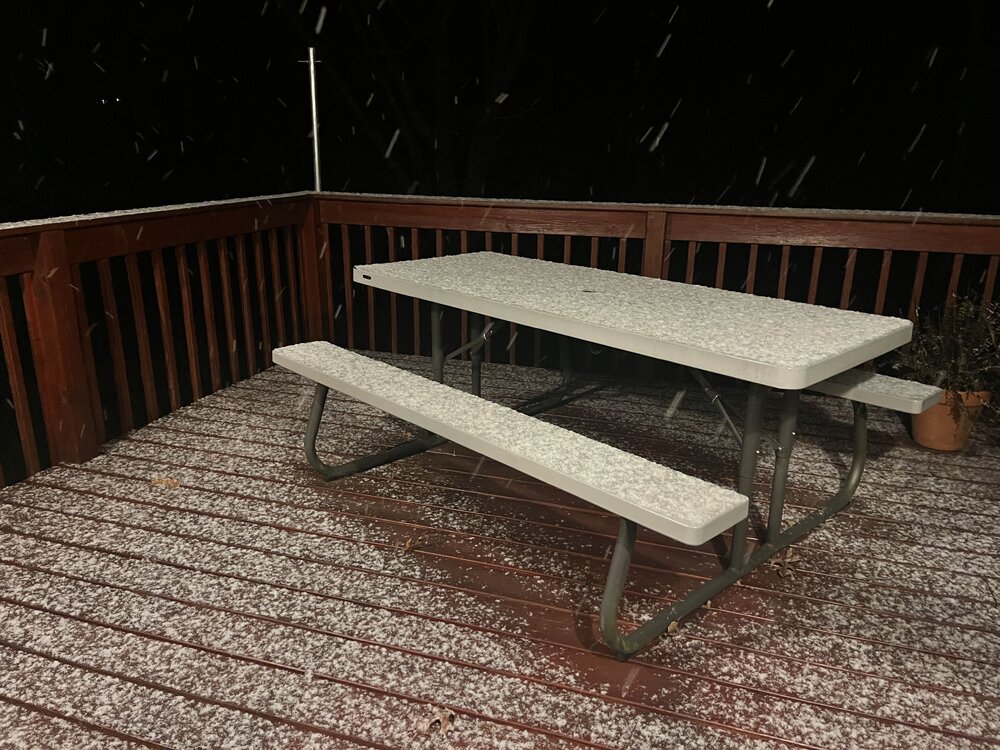
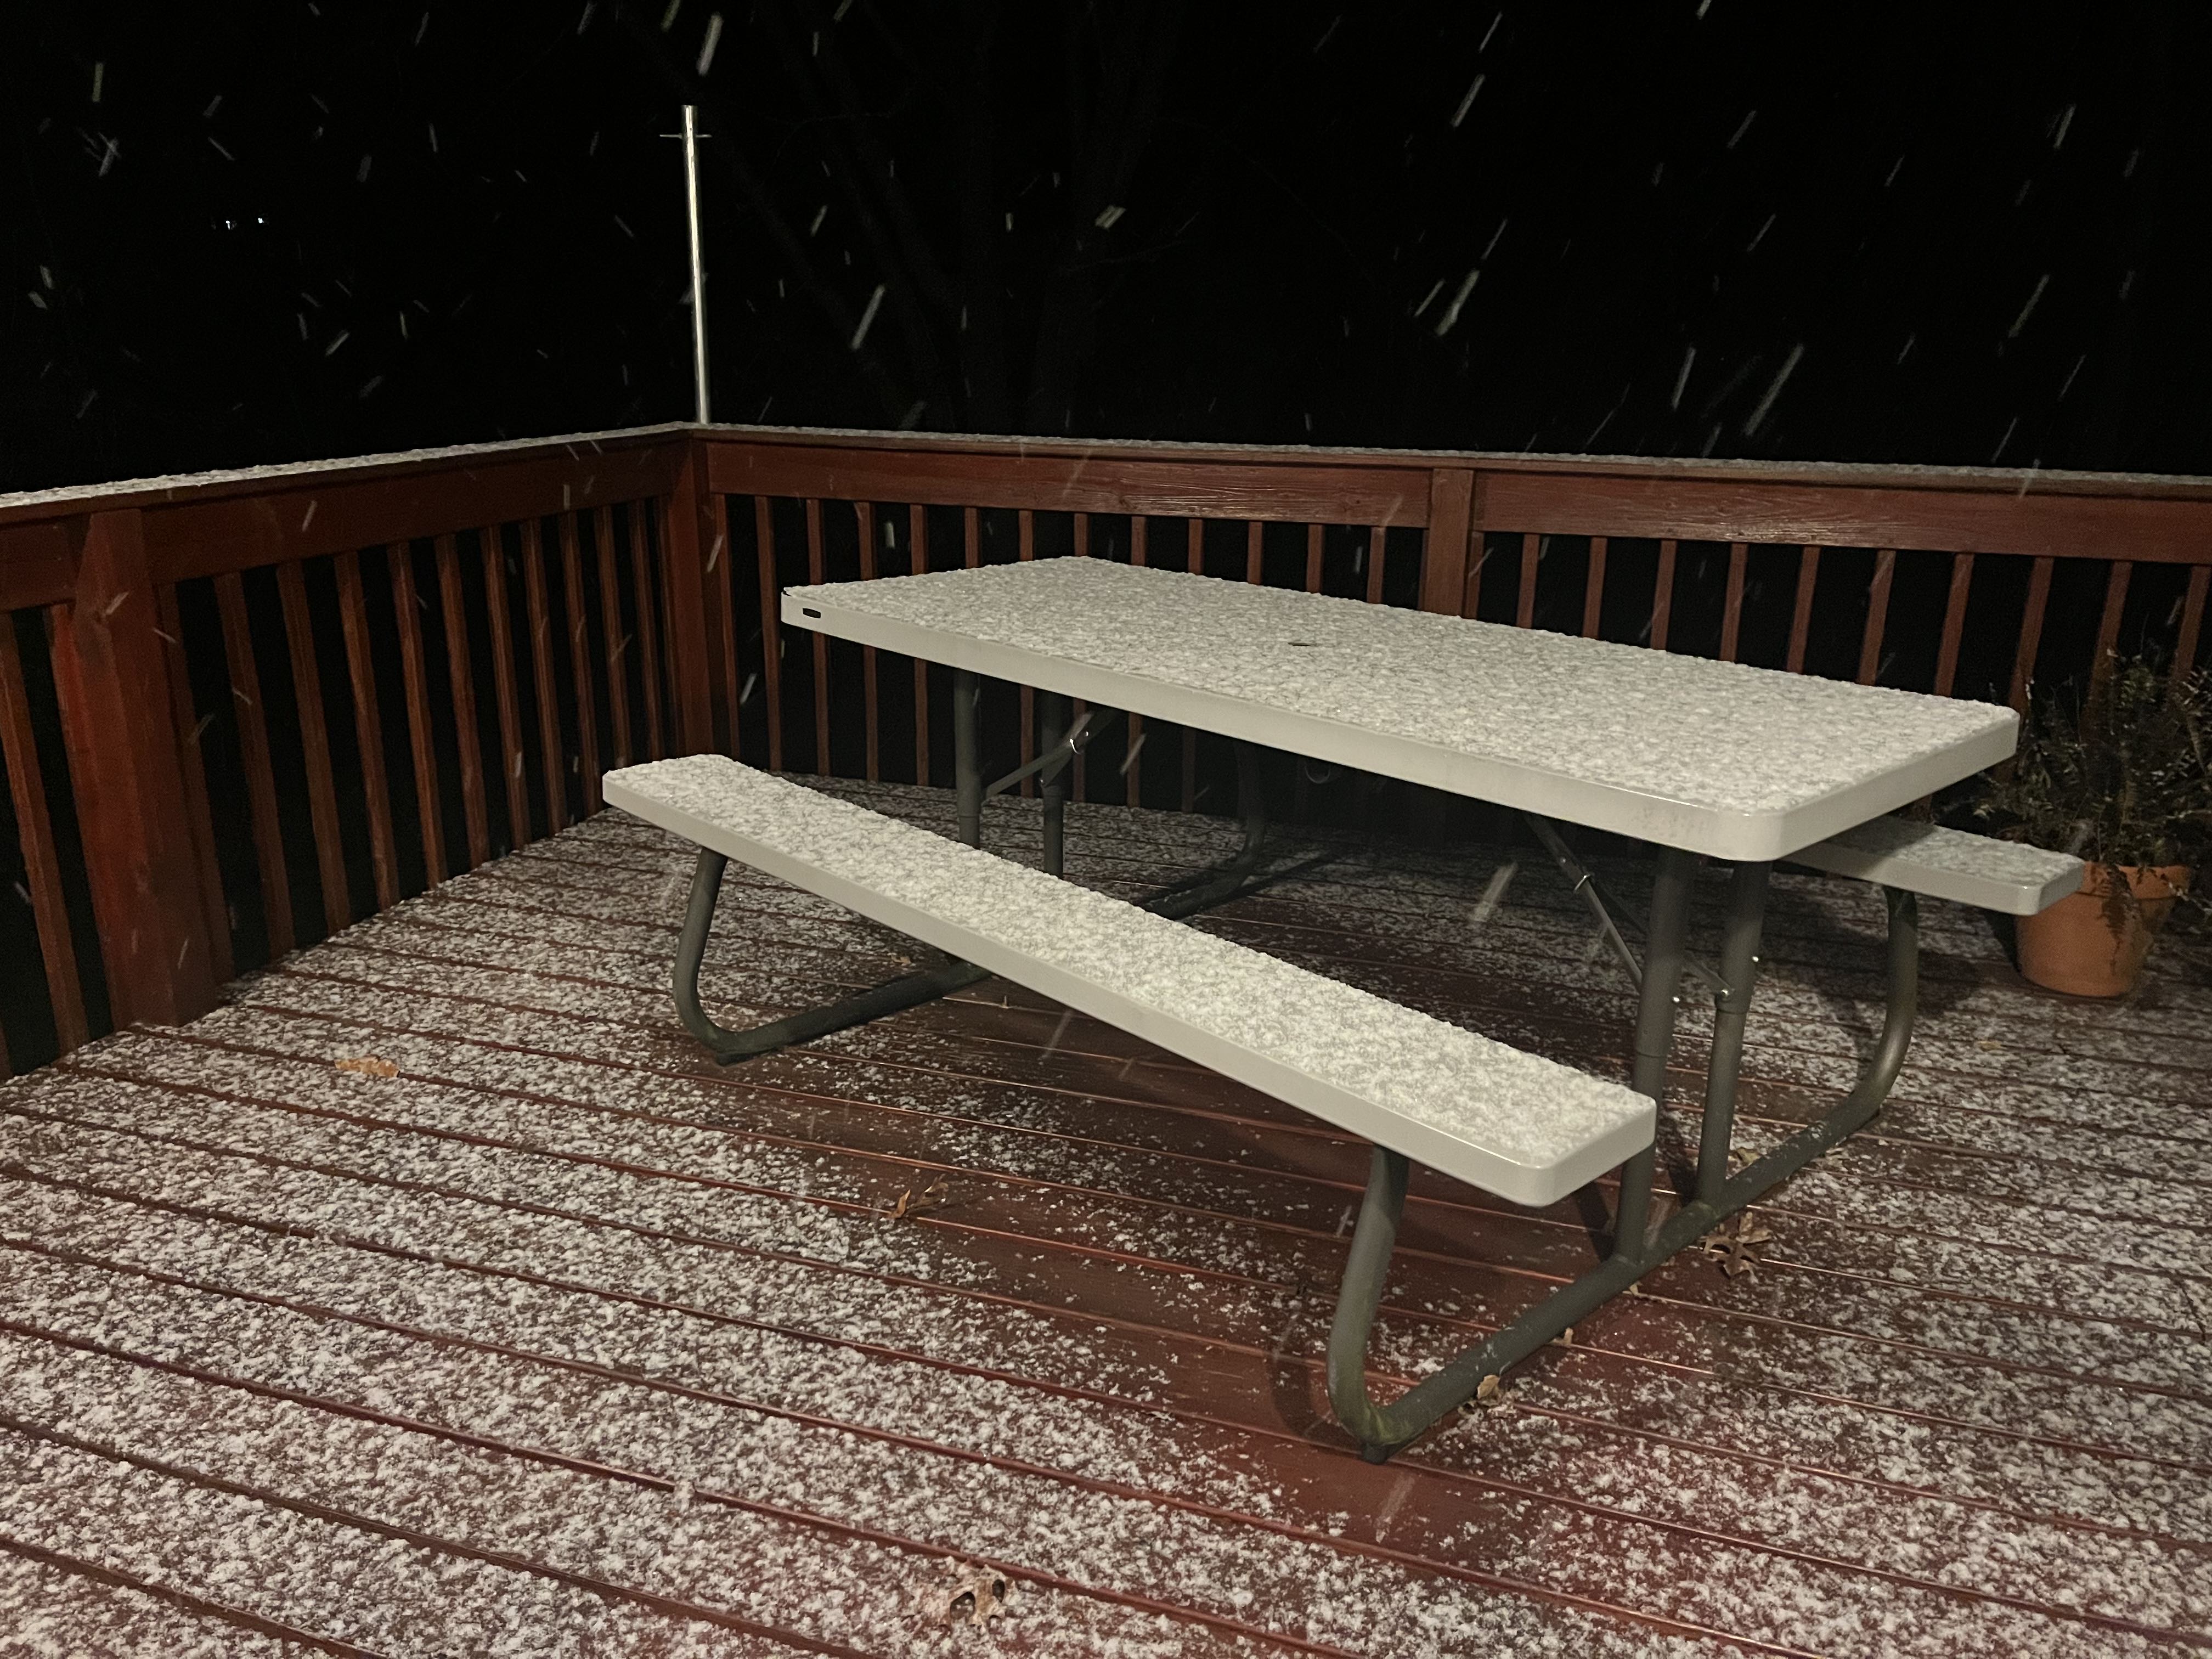
Still light snow, but I’ve got to get some sleep…
Hard to tell what to measure this as. More than a trace. Not a half inch. I’ll call it 0.1 or 0.2, I suppose. We’ll see if it increases as the night wears on.
.-
3
-
 1
1
-
-
Winding down here, I think. Huge over-performer! So amazing to see snow fall from the sky in my backyard once again. It had been far too long…
.
-
3
-
 1
1
-
-
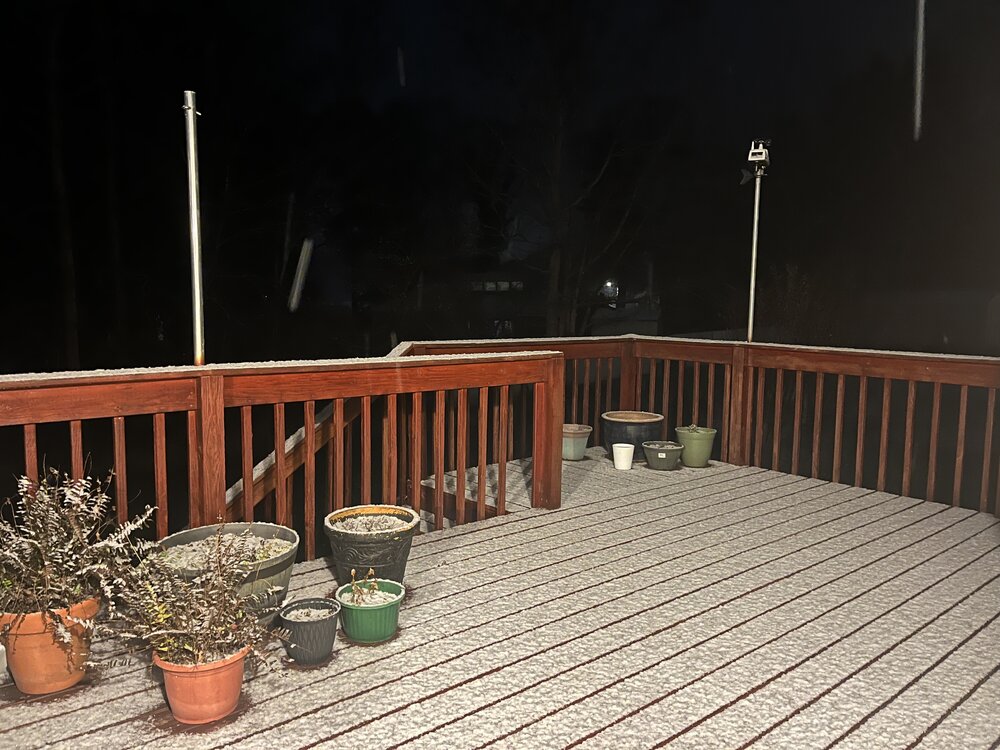
Legit deck covering with continued light snowfall. This is almost an early-season @Buckethead photo here!

.
-
1
-
2
-
-
Flurries in NE Hickory!
Edit: Let’s update that post to light snow!
-
1
-
-
52 minutes ago, avianman said:
The Catawba River is very warm for this time of the year. I think that's keeping it a little warmer the closer to it you are to it. Yesterday morning it was 10 degrees warmer at Riverbend Park (near Oxford Dam) than at my house in the St Stephens area of Hickory only 8 miles away.
I think it’s even warmer than normal here in St Stephens than it normally is. I hadn’t thought about the Catawba River as the reason, but that seems spot on. I’m probably only half a mile, as the crow flies, from the river. Great hypothesis!
-
1
-

Banter Thread
in Southeastern States
Posted
You do not exhibit an attitude in your online persona that appears to want to learn. You have made strong statements against what many others are posting. You are defiant when called out about it. You called out one of the most respected mets in the SE subforum, @msuwx. This is why many are upset at you in the main forum. Exhibit a bit more humility, and I imagine the response would be different.
Also, I see no evidence that this site is dying, and I continue to enjoy posting and learning here. I am grateful for this online weather community, as many others are too.