

calculus1
-
Posts
5,076 -
Joined
-
Last visited
Content Type
Profiles
Blogs
Forums
American Weather
Media Demo
Store
Gallery
Posts posted by calculus1
-
-
I am in the camp of having seen less than five flakes so far. =)
-
6 minutes ago, avianman said:
I am under that right now and I have yet to see the first flake.
Me too. Not a single flake so far.
-
Nothing here yet. Though radar seems to depict a heavier blob on my doorstep. This is sad.
-
 1
1
-
-
It’s going to be an amazing virtual school day at home with nothing falling from the sky. Just. Wow. At the recent NAM.
-
 1
1
-
 1
1
-
-
I've never been so excited about the 15Z SREF...
It's rolling!
-
1
-
 1
1
-
-
36 minutes ago, BooneWX said:
I think the big thing tomorrow is that some stretch of western NC is likely to get completely blanked. It’s the nature of these systems moving west to east. The big question is where.
Yeah, that's my fear, at this point, too. Catawba County Schools are going remote learning tomorrow. It will be so sad if students just have to stare at brown earth all day.
-
1
-
-
Here's the image from the 09Z SREF for KHKY. Two inches of snow would feel like a really big win at this point.
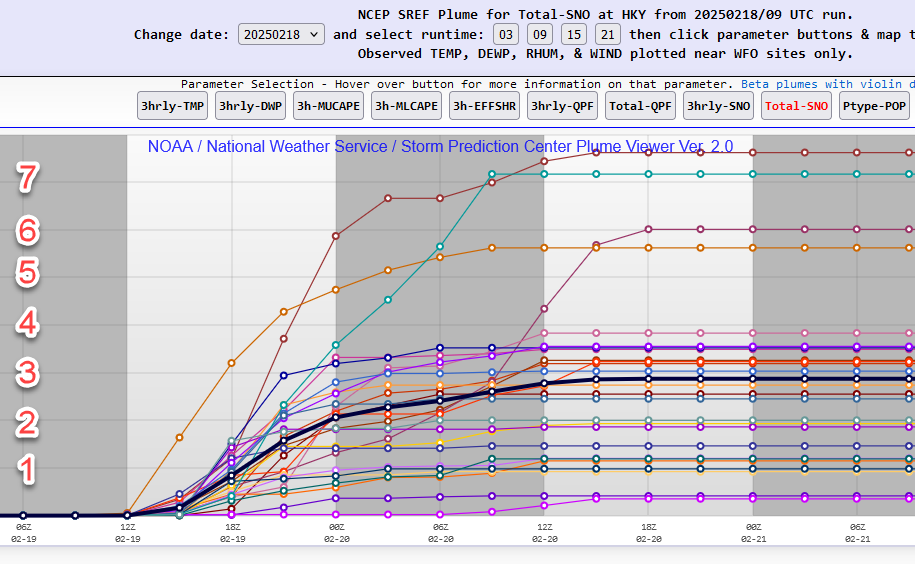
-
3
-
-
27 minutes ago, StantonParkHoya said:
Why the discrepancy in the two image outputs above?
One is the SREF mean, while another is a single member that someone plucked out.
-
There will be clear skies overhead of Wolf Laurel and somehow @Buckethead will still snow. I am so jealous. What a fantastic location you have! Snow capital of the SE.
-
1
-
-
25 minutes ago, BooneWX said:
About 51 when I was out there with 40 mph gusts. Felt a lot colder than the actual temp. We had a weird isolated shower hours after the main line and we were well on our way to warmth but that set midday heating way back locally.
Yeah, we had that same secondary downpour around noon. Wasn’t expecting that one at all, after the main line went through around 7 AM.
-
1
-
-
52 minutes ago, BooneWX said:

I’d be curious to hear the chatter in the room when making this because not a single ounce of guidance supports this west of 77.I think we have to be careful about saying “Not a single ounce of guidance supports this”. Our NWS GSP Mets are pretty good at their jobs, and they have them for a reason. Just because we don’t see the guidance that supports such a map, doesn’t mean that they don’t see things differently. Granted, this map will continue to be updated, and it could go down or up in the days to come.
25 minutes ago, BooneWX said:I think the track is pretty baked in at this point imo. We need to root for earlier phasing or just an undermodeled precip shield.
I tend to agree with you here, and this is what I think the NWS GSP mets may be betting on (for some reason). They must feel the chances for a phase or a more extensive precip shield are higher than what we see from direct model output.
-
1
-
 1
1
-
-
Call me crazy, but I’m still not that worried about the leeside minimum that was just depicted on the ECMWF. I think the climatology of a system taking this track will lead to the system filling in the precipitation to the NW up against the Apps. Of course, I’m not a trained met, so my thoughts are solely based on inference from previous iterations of similar storms, and I could be really wrong by not understanding all the interactions of the atmospheric conditions.
-
The 12Z GFS actually looks pretty decent for WNC. I think the CMC and ICON depictions are just underdoing the precipitation on the NW side. I don’t think we would see the lee side minimum in this setup.
.-
1
-
-
Guys, there’s no need to bittercast on the RDU peeps. I want the snow badly here in WNC, too, but I am sure they want it in RDU just as badly.
I still think we are in a favorable position, three days out. We’re not likely to see a foot of snow, but a couple of inches or so, seems fairly realistic. And, it could trend more as the field of precipitation blossoms more to the NW like it usually does.
. -
It’s a true “MILLAH A”!!
Imagine David Tennant saying it:
-
2
-
 1
1
-
-
@jburns, would you please pin this thread? Thanks!
-
Some brutal cutoffs showing up in our backyards [mention=18057]WXNewton[/mention] [mention=4420]calculus1[/mention].
like 2 inches for us and a foot for Lenoir
That’s a good start on the reverse jinx. I like it!
.-
1
-
-
I remain cautiously optimistic, but that’s also my SOP.

Let’s get a big dog next week! The potential is so great.
-
2
-
-
Somebody please explain to me why we are referencing Barney with the potential upcoming storm. What am I missing?
-
2
-
-
WWA canceled for us.
-
Well, the temp actually rose as the clouds rolled in. Back up to 37/35.
.-
1
-
-
I’m five miles from KHKY airport, but I am way colder. Airport is reporting 44, while I have 36.4/34.
Not expecting much in the ZR category here, despite the WWA, but I have never seen such a large discrepancy in my temperature versus that of the airport. Also, I wasn’t projected to hit 36 until 8 AM tomorrow morning in the hour-by-hour from NWS GSP, so I am running way under projected.
.-
4
-
-
Yeah, I was surprised to get the WWA down here in Hickory. We shall see...
-
1
-
-
Those of you wanting to go back to the days of surprise snowstorms may be in luck, if the White House cuts funding for NOAA and restricts cooperation with other countries. This would have rather horrible impacts, I fear. What are we doing?
https://www.msn.com/en-us/news/world/it-s-a-circus-trump-unleashes-chaos-at-key-us-science-agency/ar-AA1yEkcq
.
2025 foothills Thread
in Southeastern States
Posted
COD Radar shows a heavy slug of moisture on our doorstep moving SW to NE. Maybe this will finally break through.