RU848789
-
Posts
4,002 -
Joined
-
Last visited
Content Type
Profiles
Blogs
Forums
American Weather
Media Demo
Store
Gallery
Everything posted by RU848789
-
The difference between the 0Z NAM and the 0Z GFS is astonishing, especially for NNJ/NEPA. I have a very hard time believing in the GFS here.
-
Definitely some snow potential for the Poconos, NWNJ, Catskills, etc. Potential for a few to several inches and today's 12Z models are even showing up to an inch of snow down to I-80 (W of 287). And we're now within 3-4 days, so not quite fantasy land anymore. More importantly, we need the rain.
-
NHC now calling for Sara to dissipate in the next 4-5 days near the end of its journey across the Yucatan Peninsula. This has to be great news for Florida, although clearly all of the models don't show dissipation. Environmental conditions are conducive for some strengthening during the next couple of days, but the main inhibiting factor is the sprawling structure of the cyclone and its close proximity to land. Given that the system is forecast to pass very close to the northern coast of Honduras, only modest strengthening is suggested by most of the guidance. The NHC intensity forecast calls for some strengthening during the next couple of days, follow by little change in intensity until the system moves over the Yucatan peninsula. It should be noted that a more northern track, could result in additional strengthening, but the global models and most of the intensity guidance does not favor that scenario. The global models indicate that the system will weakening quickly while it moves over the Yucatan peninsula and that the circulation is not likely to survive the passage over the peninsula. Therefore, the new forecast now calls for dissipation by day 5.
-
At 4 am EST, the NHC upgraded the system to a Tropical Depression... Tropical Depression Nineteen Discussion Number 3 NWS National Hurricane Center Miami FL AL192024 400 AM EST Thu Nov 14 2024 The satellite presentation of the system has gradually been improving. The latest subjective intensity estimates from TAFB and SAB are both T-2.0/30 kt. Based on the subjective Dvorak estimates and the improvement in the convective structure noted on satellite imagery, the system is upgraded to a tropical depression. This is supported by data from the Indian Oceansat scatterometer, which shows a well-defined circulation. The intensity is set to 30 kt based on the Dvorak estimates.
-
Yep, looks like a Cat 1 if one believes a 7-day op run...GFS shows nada and CMC has a weak low near LA by then. Very hard to glean much from this suite.
-
About 0.1" here. A little worried about flash flooding, lol. And with regard to the about to end rainless streaks, below is the NWS-Philly update on the latest counts of consecutive days without measurable precipitation at the major climate locations as of Saturday (last time there was measurable precipitation and the amount are in parentheses); the streaks should end for these stations tonight (or early Monday). By the way, the NJDEP is holding a hearing on Tuesday to discuss potential water use restrictions. Allentown 16 days (0.01" on October 24) - tied for 44th longest Atlantic City Airport 38 days (0.02" on October 2) - record longest Mount Pocono 26 days (0.05" on October 14) - tied for 2nd longest Philadelphia 42 days (0.11" on September 28) - record longest Reading 16 days (0.01" on October 24) - tied for 73rd longest Trenton 42 days (0.23" on September 28) - record longest Wilmington 42 days (0.04" on September 28) - record longest Georgetown 43 days (0.13" on September 27) - record longest One note on this, drought is a much longer term weather phenomena than most of the hazardous weather we talk about, so one rain event (especially one with as little as this), generally isn't enough to make any significant dent in the deficit and drought conditions. Therefore, please continue to heed any burn bans or water conservation efforts your localities may have in place! For the rest of the week, there is a small (emphasis on small) chance for rain on Thursday. Otherwise, it appears we'll have mostly dry conditions.
-
We now have potential tropical cyclone #18 in the Caribbean, which will likely become TS Rafael soon and the NHC forecast track takes it into the Gulf of Mexico strengthening into a weak hurricane near Cuba, but then weakening as it heads further north due to anticipated shear, but as per the NHC discussion, the error bars are pretty high on this one. FORECAST POSITIONS AND MAX WINDS INIT 03/2100Z 13.0N 77.1W 30 KT 35 MPH...POTENTIAL TROP CYCLONE 12H 04/0600Z 14.3N 77.1W 35 KT 40 MPH...TROPICAL CYCLONE 24H 04/1800Z 16.0N 77.7W 40 KT 45 MPH 36H 05/0600Z 17.7N 78.6W 50 KT 60 MPH 48H 05/1800Z 19.6N 80.4W 60 KT 70 MPH 60H 06/0600Z 21.5N 82.6W 70 KT 80 MPH 72H 06/1800Z 23.3N 84.5W 65 KT 75 MPH 96H 07/1800Z 25.4N 86.6W 60 KT 70 MPH 120H 08/1800Z 26.9N 88.6W 50 KT 60 MPH
-
The sun appears to have been obscured by dark grey objects in the sky and I observed some small water droplets falling to the earth, apparently from these grey objects. Can anyone explain these strange observations?
-
2024 Atlantic Hurricane Season
RU848789 replied to Stormchaserchuck1's topic in Tropical Headquarters
And we all know what happened at the end of October 2012, when Sandy slammed into NJ on 10/29/12. Not saying something like that is going to happen, but a pattern like that makes it more likely a tropical system could impact the east coast. -
I know you're just sharing info, which is fine, but from my perspective, I find most "daily" records to be much less useful than event records. For example, having 10" on 2 consecutive days for 20" event total is far more relevant/useful than having 13" all in one day. IMO.
-
Update on the tornado from yesterday in Fort Pierce: it has been confirmed that 4 people died in the Spanish Lakes Country Club Village development in the Lakeland Park area of northern Ft. Pierce (only a mile or so from Vero Beach, so this kind of scared my dad and my brother/SO and my sister/SO, who all live in Vero in separate locations) from that EF3 (estimated) tornado that ripped through the area. Tornadoes are certainly common with hurricanes, but strong tornadoes are pretty unusual and the number of tornadoes was also unusual, with 125 tornado warnings issued and 38 actual tornadoes touching down (based on observations, not 100% confirmed yet). The video of the damage on TWC is heartbreaking with houses literally like they exploded. https://www.wpbf.com/.../officials-multiple.../62561027
-
Milton about to exit the FL east coast ~10 miles north of Cape Canaveral as an 85 mph Cat 1 hurricane still, which is pretty close to the forecast from the past few days. We'll begin to really see the extent of the damage at the coast and inland across the peninsula with sunrise soon. Hurricane Milton Tropical Cyclone Update NWS National Hurricane Center Miami FL AL142024 400 AM EDT Thu Oct 10 2024 ...STRONG WINDS SPREAD ALONG THE EAST COAST OF FLORIDA AS THE CENTER OF MILTON NEARS CAPE CANAVERAL... ...400 AM EDT POSITION UPDATE... A sustained wind of 83 mph (134 km/h) and a gust to 92 mph (148 km/h) was recently reported at a Weatherstem station in Marineland. A sustained wind of 67 mph (108 km/h) and a gust to 73 mph (117 km/h) was recently reported at a Weatherstem station on South Hutchinson Island. A sustained wind of 54 mph (87 km/h) and a gust of 83 mph (133 km/h) was recently reported at buoy 41069 near Ponce de Leon Inlet. A sustained wind of 54 mph (87 km/h) and a gust of 84 mph (135 km/h) was recently reported at Daytona Beach International Airport. This will be the final hourly position update for Milton since the center of the hurricane is moving offshore of the east coast of Florida. The next full forecast advisory for Milton will be at 500 AM EDT (0900 UTC). SUMMARY OF 400 AM EDT...0800 UTC...INFORMATION ----------------------------------------------- LOCATION...28.5N 80.7W ABOUT 10 MI...20 KM NW OF CAPE CANAVERAL FLORIDA ABOUT 35 MI...55 KM E OF ORLANDO FLORIDA MAXIMUM SUSTAINED WINDS...85 MPH...135 KM/H PRESENT MOVEMENT...NE OR 55 DEGREES AT 18 MPH...30 KM/H MINIMUM CENTRAL PRESSURE...977 MB...28.85 INCHES
-
There's friction at the water's surface - it's just a lot less than the friction over land, due to surface roughness/terrain. The boundary layer from the surface (water or land) goes from zero velocity right at the surface (the no slip condition, where molecules in contact with the stationary surface have no velocity) to a steady state velocity some height above the surface and that velocity is significantly lower at ~10m above the surface (where winds are measured) of land vs. water. It always surprises me that people don't understand that hurricane winds over land are almost never as strong as those over water, due to friction effects, mostly. Having said all that, I've always wondered how a hurricane's speed is measured when it's over land they report 10m surface winds, but I doubt Milton has 105 mph sustained winds at 10 m above the surface where wind speeds are typically measured. I believe there's still enough of a frictional effect at 10m to have the measured winds be lower over land than what the algorithms are spitting out for the hurricane (but I have no "proof" of that).
-
Another Flash Flood Emergency issued by the NWS for potentially catastrophic flooding for the I-4 corridor NE of Tampa into the center of the state from 8-12", so far, and more on the way. Flash Flood Warning National Weather Service Tampa Bay Ruskin FL 1011 PM EDT Wed Oct 9 2024 ...FLASH FLOOD EMERGENCY FOR LAKELAND, WINTER HAVEN, WESLEY CHAPEL... The National Weather Service in Tampa Bay Ruskin has extended the * Flash Flood Warning for... Northwestern Polk County in central Florida... Southeastern Sumter County in central Florida... Southwestern Hernando County in west central Florida... Northern Hillsborough County in west central Florida... Pasco County in west central Florida... Pinellas County in west central Florida... * Until 400 AM EDT. * At 1011 PM EDT, Doppler radar indicated thunderstorms producing heavy rain across the warned area. Between 8 and 12 inches of rain have fallen. Flash flooding is ongoing or expected to begin shortly. This is a FLASH FLOOD EMERGENCY for Lakeland, Winter Haven, Wesley Chapel. This is a PARTICULARLY DANGEROUS SITUATION. SEEK HIGHER GROUND NOW! HAZARD...Life threatening flash flooding. Thunderstorms producing flash flooding. SOURCE...Radar. IMPACT...This is a PARTICULARLY DANGEROUS SITUATION. SEEK HIGHER GROUND NOW! Life threatening flash flooding of low water crossings, small creeks and streams, urban areas, highways, streets and underpasses. * Some locations that will experience flash flooding include... Tampa, Spring Hill, Lakeland, Plant City, Winter Haven, Haines City, Bartow, New Port Richey, Lake Wales, Auburndale, Zephyrhills, Dade City, Brandon, Lutz, Fish Hawk, Hudson, Holiday, St. Leo, Zephyrhills South and Zephyrhills North. PRECAUTIONARY/PREPAREDNESS ACTIONS... Move to higher ground now! This is an extremely dangerous and life-threatening situation. Do not attempt to travel unless you are fleeing an area subject to flooding or under an evacuation order. Be especially cautious at night when it is harder to recognize the dangers of flooding. Stay away or be swept away. River banks and culverts can become unstable and unsafe.
-
The amount of rain (10-14" reported and probably more has fallen in some places with more to come) is just nuts. SIAP, but the NWS in Tampa just issued a Flash Flood Emergency for most of the Tampa/St. Pete area, which is rarely used - it's what was issued in our area when Ida's remnants unleashed that deadly deluge on CNJ/NNJ/NYC a few years ago. BULLETIN - EAS ACTIVATION REQUESTED Flash Flood Warning National Weather Service Tampa Bay Ruskin FL 926 PM EDT Wed Oct 9 2024 ...FLASH FLOOD EMERGENCY FOR ST. PETERSBURG, TAMPA, RIVERVIEW, AND PALMETTO... The National Weather Service in Tampa Bay Ruskin has extended the * Flash Flood Warning for... Central Hillsborough County in west central Florida... Northern Manatee County in west central Florida... Southeastern Pinellas County in west central Florida... * Until 230 AM EDT. * At 926 PM EDT, Doppler radar indicated thunderstorms producing heavy rain across the warned area. Between 10 and 14 inches of rain have fallen. Flash flooding is already occurring. This is a FLASH FLOOD EMERGENCY for St. Petersburg, Tampa, Riverview, and Palmetto. This is a PARTICULARLY DANGEROUS SITUATION. SEEK HIGHER GROUND NOW! HAZARD...Life threatening flash flooding. Thunderstorms producing flash flooding. SOURCE...Radar. IMPACT...This is a PARTICULARLY DANGEROUS SITUATION. SEEK HIGHER GROUND NOW! Life threatening flash flooding of low water crossings, small creeks and streams, urban areas, highways, streets and underpasses. * Some locations that will experience flash flooding include... Tampa, Clearwater, Largo, Bradenton, Pinellas Park, Temple Terrace, Seminole, Palmetto, Downtown Saint Petersburg, Saint Petersburg, Fort Desoto Park, Brandon, St. Petersburg, St. Pete Beach, Anna Maria, Gandy, Macdill Air Force Base, West And East Lealman, Feather Sound and Tampa International Airport. PRECAUTIONARY/PREPAREDNESS ACTIONS... Move to higher ground now! This is an extremely dangerous and life-threatening situation. Do not attempt to travel unless you are fleeing an area subject to flooding or under an evacuation order. Be especially cautious at night when it is harder to recognize the dangers of flooding. Stay away or be swept away. River banks and culverts can become unstable and unsafe.
-
So, assuming Milton passes 10-20 miles south of the mouth of Tampa Bay, I would assume this means much less surge in Tampa Bay than the 8-12' still forecast (and maybe reverse surge with winds from the east-ish). Is there a model showing the surge before and after landfall for that scenario (and will there eventually be some surge on the backside, with maybe NW winds?
-
Well the NHC did back off a bit on surge from Tampa, northward, to 9-13' from the Anclote River to Egmont Key (was 10-15'), but kept the Tampa Bay at 10-15' (not sure why- maybe the angle of approach allows enough of a southerly wind component to push water into the Bay); they also expanded the 10-15' surge forecast south about 15 miles from Englewood to Boca Grande.
-
11 pm advisory: 160 mph/915 mbar and no real track change from 5 pm. Edit - map up now... The official track forecast is very similar to the previous one, and is generally a little north of the model trackers, but follows the actual model predicted cyclone center locations. This is close to a blend of the latest GFS and ECMWF model solutions. FORECAST POSITIONS AND MAX WINDS INIT 09/0300Z 23.4N 86.5W 140 KT 160 MPH 12H 09/1200Z 24.7N 85.3W 135 KT 155 MPH 24H 10/0000Z 26.5N 83.6W 115 KT 130 MPH 36H 10/1200Z 27.9N 81.4W 75 KT 85 MPH...INLAND 48H 11/0000Z 28.5N 78.8W 70 KT 80 MPH...OVER WATER 60H 11/1200Z 29.0N 75.5W 65 KT 75 MPH 72H 12/0000Z 29.4N 72.0W 55 KT 65 MPH...POST-TROP/EXTRATROP 96H 13/0000Z 30.4N 65.0W 45 KT 50 MPH...POST-TROP/EXTRATROP 120H 14/0000Z 31.5N 57.9W 40 KT 45 MPH...POST-TROP/EXTRATROP
-
I'm assuming the NHC won't lower the storm surge forecasts for the Tampa area until and unless the forecast confidence in a track at least 10-20 miles south of Tampa Bay is very high; probably not until 12-18 hours before landfall, maybe tomorrow at 11 am. Evacuating "unnecessarily" for a 10-15' storm surge is far less of an issue than dropping the surge forecast now and then having many people not evacuate (or even have some return) and then having the track actually head into TB with 10-15' of surge, causing far more loss of life. Having spent many years doing risk analysis in the chemical industry, one usually doesn't discount a catastrophic risk impact (high severity) until the probability of that risk being realized becomes quite low and we're not there yet. And there are still quite a few 18Z models (GFS, NAM, ICON, RDPS, HWRF, HMON and the HAFs) showing landfall either in Tampa Bay or within 5-10 miles of it, so the probability of a Tampa Bay landfall is still too high to lower the surge forecast, IMO.
-
And if that convection in those cells makes it on shore in SW FL - and especially if we get some training - the WPC rainfall forecast is going to be way underdone for SW FL...
-
155 mph at 5 am EDT with forecast track nudged very slightly north vs. 11 pm; Tampa area still under the gun if center of forecast track verifies, but the track cone is a bit wider than the typical error at 48 hrs (~65 miles), so landfall location is obviously still a bit of a guess. FORECAST POSITIONS AND MAX WINDS INIT 08/0900Z 22.3N 88.9W 135 KT 155 MPH 12H 08/1800Z 22.9N 87.5W 140 KT 160 MPH 24H 09/0600Z 24.2N 85.8W 135 KT 155 MPH 36H 09/1800Z 26.0N 84.2W 125 KT 145 MPH 48H 10/0600Z 27.6N 82.6W 110 KT 125 MPH...NEAR THE COAST 60H 10/1800Z 28.8N 79.9W 70 KT 80 MPH...OVER WATER 72H 11/0600Z 29.7N 76.5W 60 KT 70 MPH...POST-TROP/EXTRATROP 96H 12/0600Z 30.4N 69.9W 45 KT 50 MPH...POST-TROP/EXTRATROP 120H 13/0600Z 31.5N 63.8W 35 KT 40 MPH...POST-TROP/EXTRATROP
-
I generally understand the nuances of numerical modeling and forecasting and spent many years doing emergency response planning (including for weather) for Merck's Rahway, NJ site, so I get not wanting to possibly confuse the public, but that doesn't change the fact that I'd simply like to know what the NHC knows about landfall in their forecasts. Maybe they could use the model they use for their surge inundation product where the reader has to acknowledge the limitations and caveats associated with use of the tool and provide the landfall data, but only after the reader read a disclaimer on how that point is, at best a guess, and should not be used for planning purposes, per se, given the uncertainties of hurricane track/intensity forecasting or something like that. I don't think providing that is going to significantly affect how the public uses the info, but perhaps I'm wrong about that. Anyway, thanks for the perspective.
-
Thanks, although I would have no idea how to find that if I didn't know it existed, lol. Bookmarked it...
-
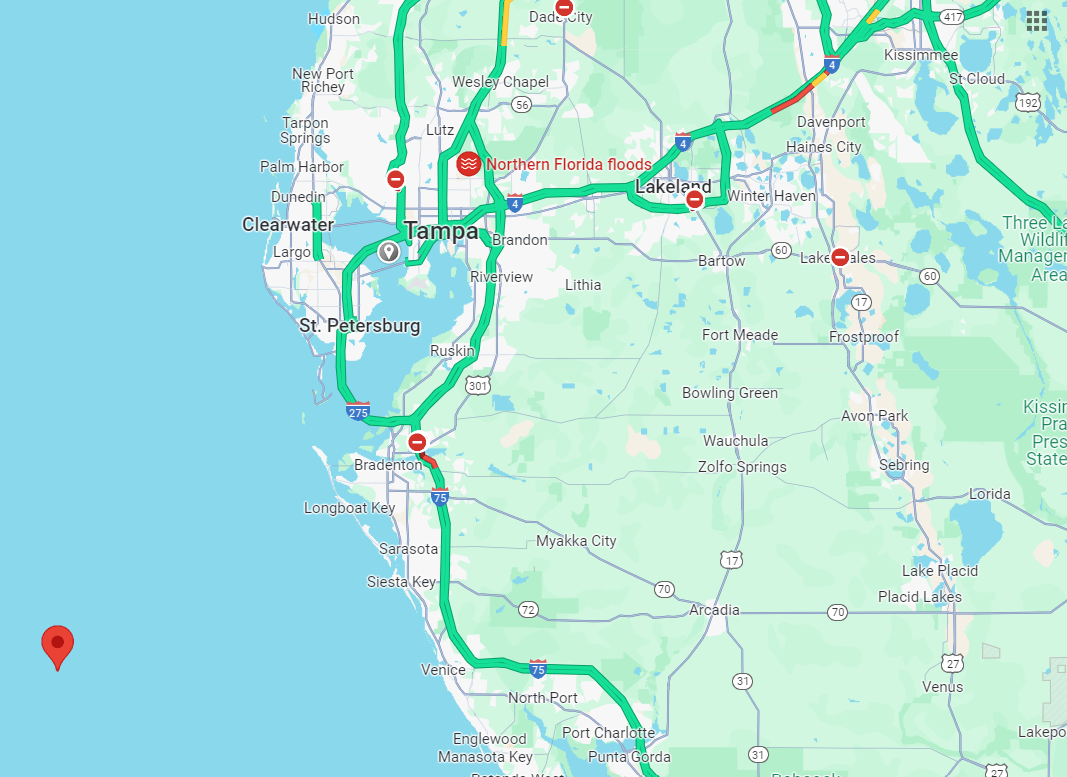
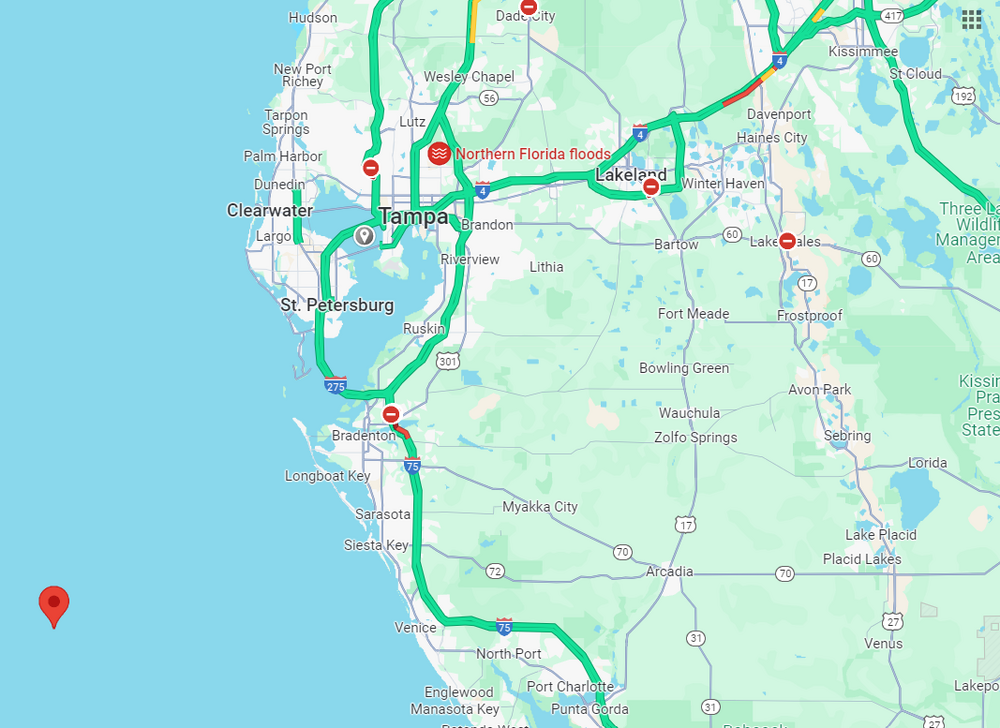
As I mentioned earlier in the thread, one of my pet peeves with the NHC is them not always providing a location/windspeed/pressure of the landfall point for the center of their track. I know they like to highlight that "users are reminded to not focus on the details of the forecast as there remains significant uncertainty in the eventual track and intensity of Milton" but I still think they should share at least the landfall forecast, as people want to know and without that info, people end up doing their own estimations of landfall location and strength, which is worse, IMO. For example, the 11 pm advisory contains the point off the coast in the map below (27.1N 83.3W), but guessing exactly where exactly landfall will be has some uncertainty as one has to look at the track and eyeball it. It's certainly a bit south of the 5 pm track (the little grey dropped pin was the point NHC gave at 5 pm, i.e., 27.9N 82.6W), which is why I would guess Anna Maria Island, due west of Bradenton, which would mean the storm would still kind of go NE into Tampa Bay, but barely; the 11 pm track represents about a 15 mile shift SE from the track at 5pm (by my eyeball and I'd rather not be relying on my eyeballs, lol) and and another 10-20 mile shift might be enough to spare Tampa the worst surge. The NHC "knows" the landfall point - I just wish they'd share it. As an aside, is there some service out there that actually calculates it?
-
This may be banter, but I saw this AccuWeather graphic which shows Milton as a Cat 2 hurricane before exiting the east coast of FL. As far as I know, the NHC has not said whether Milton will be Cat 2 or Cat 1 as it exits the east coast of FL. They simply show it being a Cat 3 just after landfall and it being a Cat 1 (85 mph) when it's about 85 miles off the coast. One can guesstimate that it could be Cat 2 (>95 mph) as it reaches the east coast, but that's not the official NHC forecast. I've wished for years that the NHC would explicitly provide the windspeed and pressure data for landfall and exit point from a landmass, but they don't (or if they do I've never seen it). Anyone?