ORH_wxman
-
Posts
93,095 -
Joined
-
Last visited
Content Type
Profiles
Blogs
Forums
American Weather
Media Demo
Store
Gallery
Everything posted by ORH_wxman
-
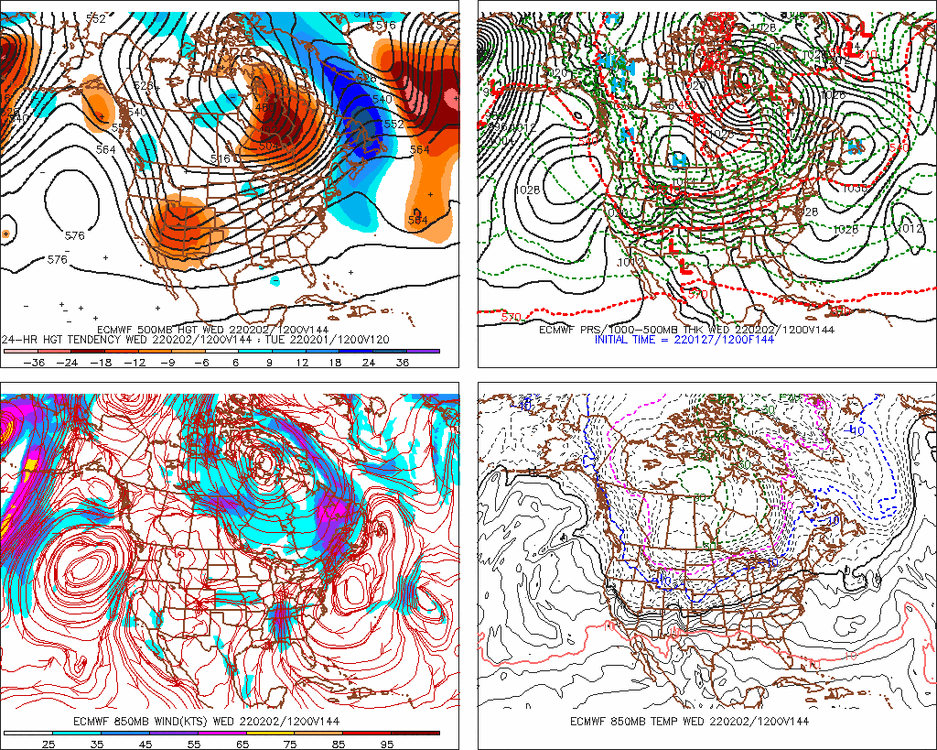
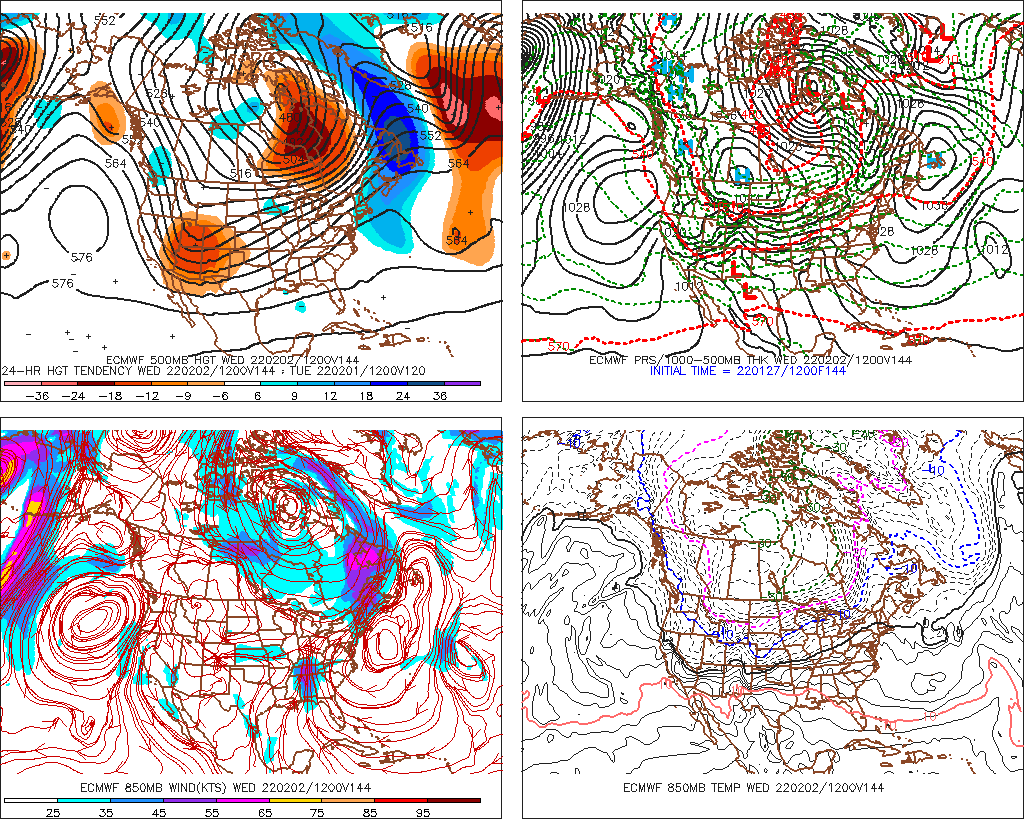
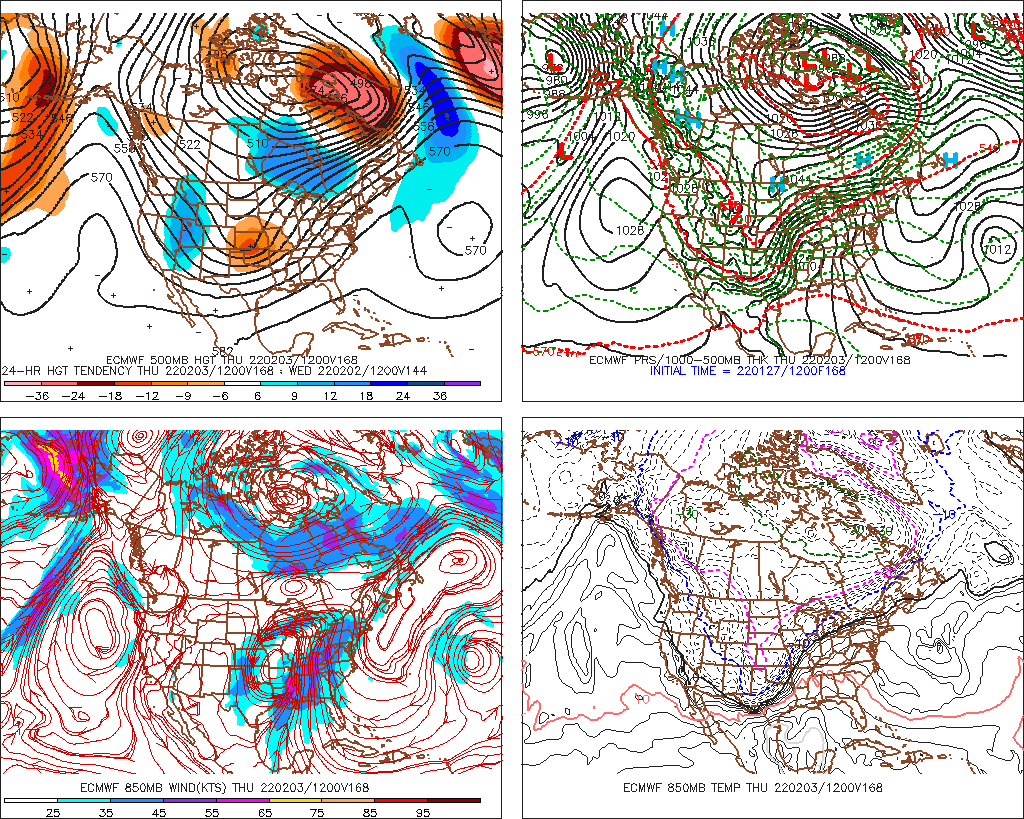
Euro has been pretty gung ho most of the way…it’s had a few runs where it tried to slide a little east but it never went where so many other models went. It often was all alone too….so I think assuming we’re getting close to a final solution here, the Euro is going to take home a much needed W. NAM may have been the first model to show some of the most ridiculous solutions though. But we can’t ignore that 18z whiff yesterday.
-
Reminds me of some of the Feb 2013 output. When it verified in real time, it was like 1-2” per hour over a huge area with embedded bands of 3-5” per hour. You were “getting screwed” at 1-2” per hour. It’s just a wall of precip.
-
Yeah now that we’re all honking, this would be a classic time for the Euro drop a turd in the punchbowl with one of those strung out convective lows.
-
Back when the servers were more iffy, threads that had over 50 or 100 pages started to strain them so we would close them and start new ones. I recall some events having 4 or 5 threads leading into it.
-
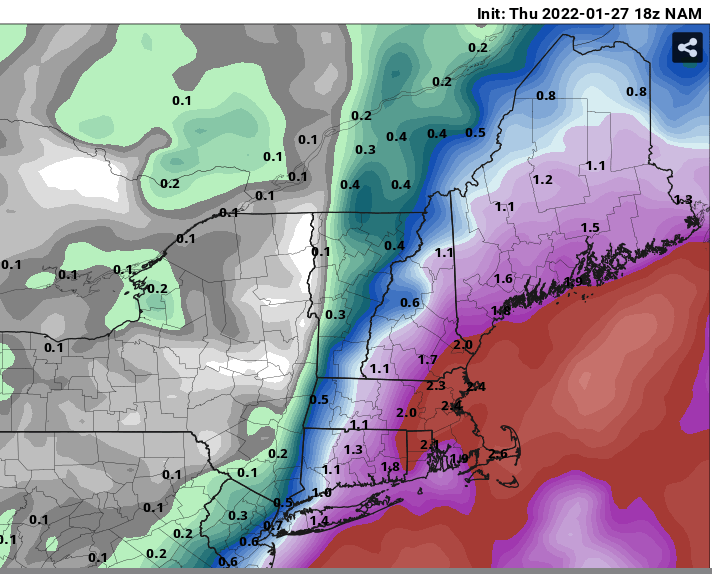
Blue Hill actually has the highest for a first order station in SNE with 38.7 in the Feb 1969 storm. 34.5” at ORH in Jan 2015 is the 2nd highest for a first order station. I think their 33.0” in Apr 1997 is 3rd.
-
It wouldn’t be a big dog if the GFS wasn’t rapidly caving inside 48h.
-
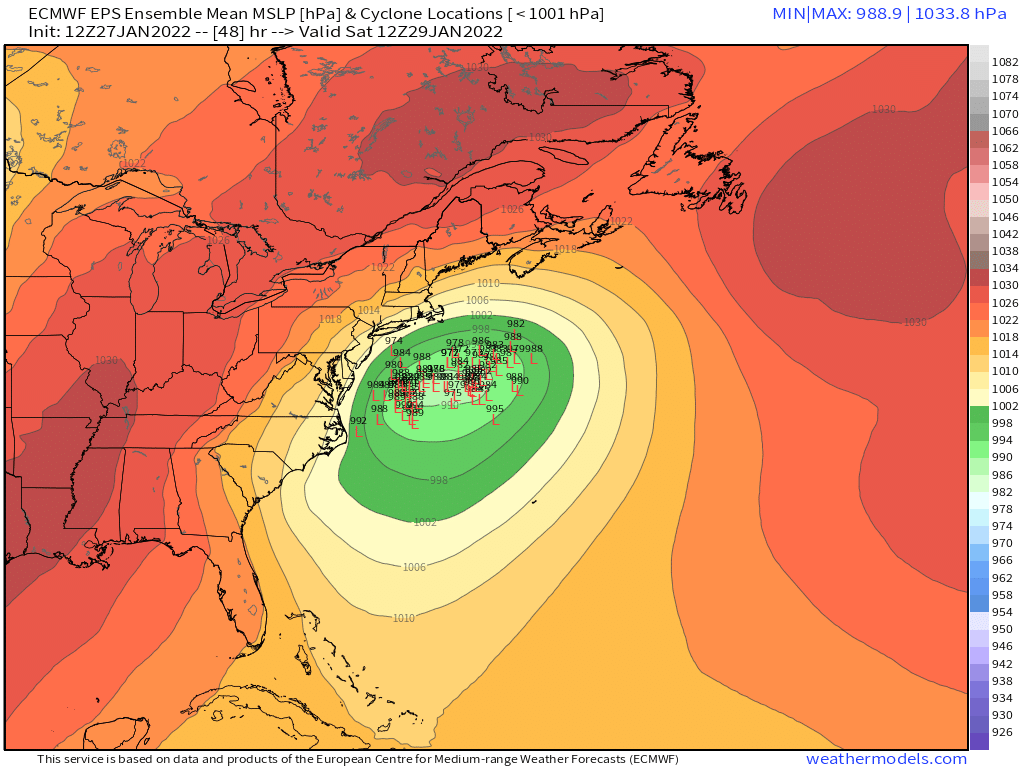
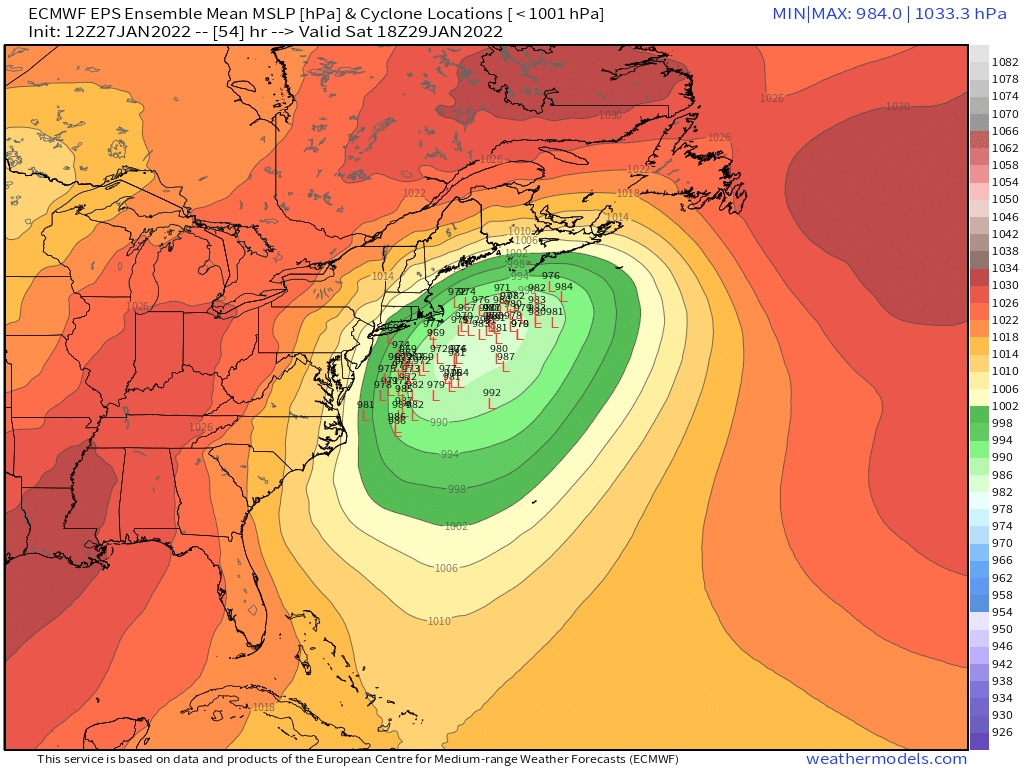
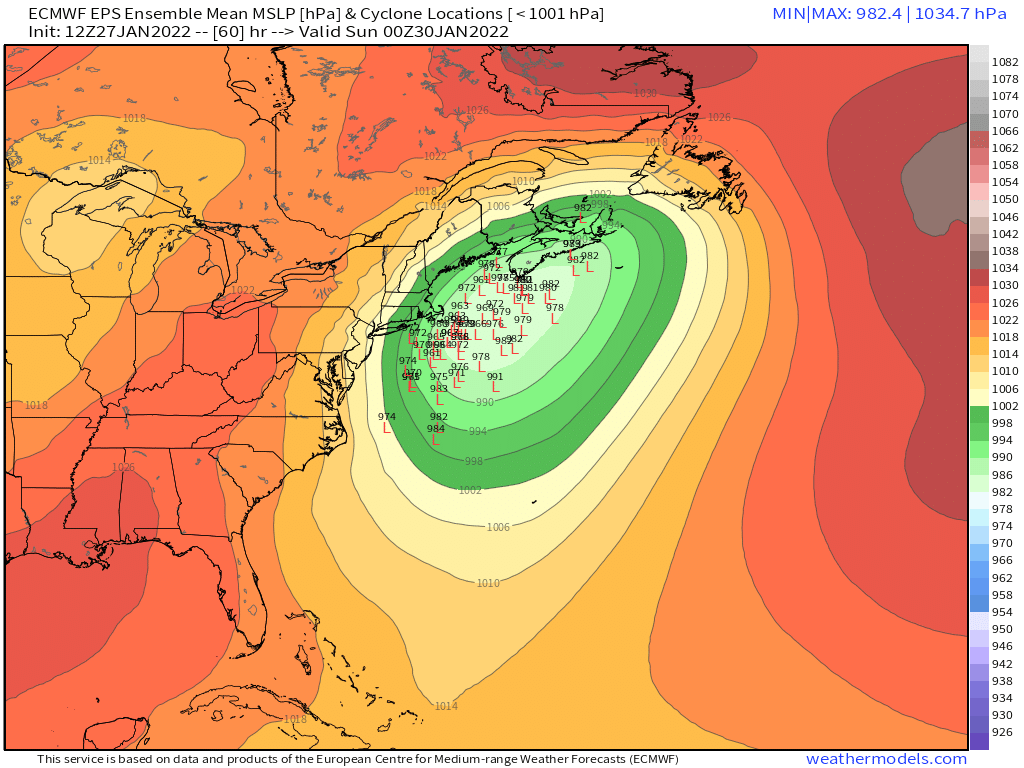
Yeah I mean, if the upside wasn’t so high, I’d prob take 8” and run but when we have 24-30 as realistic upside, I’m gonna gamble.
-
I’d prob roll the dice at this point inside of 495 instead of signing on the dotted line for 8-9 inches.
-
Easy forecast for the south shore and Cape at least.
-
Not the NMB, lol http://www.meteo.psu.edu/fxg1/ETAEAST_18z/etaloop.html
-
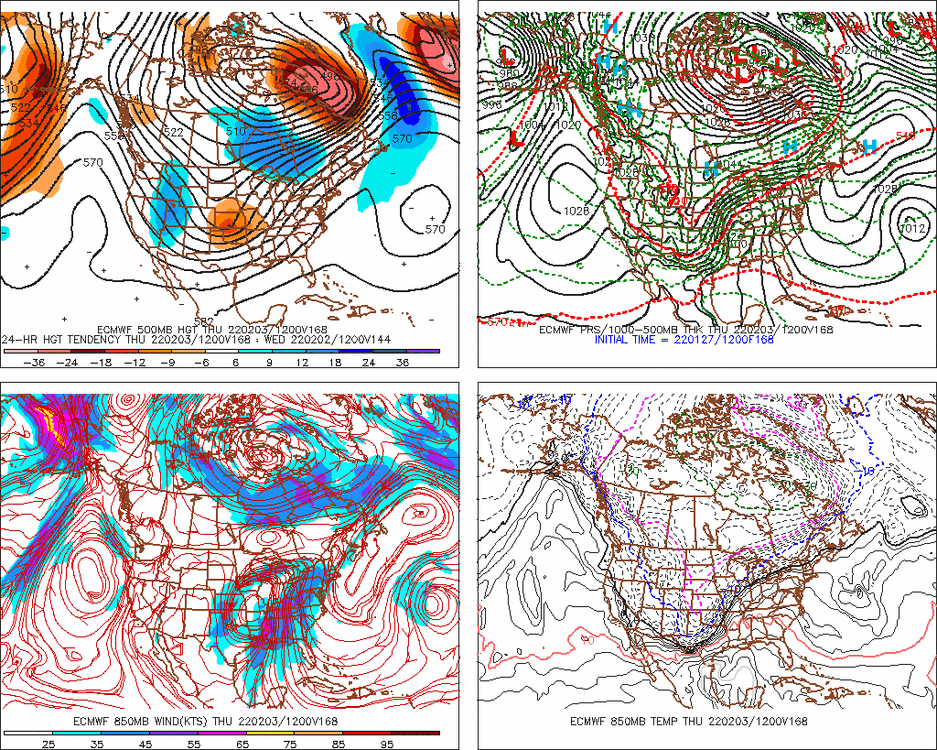
The key was that curling that started to happen around 42h and it got rid of the dual low that 12z had....if you recall, 12z looked like it was going to be more insane than 06z at first, but then ended up a little less because of the dual low. This run shed that idea pretty quickly. These small nuances are going to wreak havoc on the final sensible wx outcomes....
-
This is still going to be really impressive...H5 is actually curling to the west a little more than 12z despite some of the confluence up north probably make this turn a little wider.
-
He wants Sierra Nevada amounts. It's like Jamie Dimon complaining he's not as rich as Jeff Bezos.
-
The main trough is actually a little deeper than 12z so far, but the lack of downstream ridging compared to 12z is obvious.
-
It prevents downstream ridging....and you want more downstream ridging to pull the storm west.
-
I'll be surprised if the NAM isn't east of 12z. Still looking less amped with more Quebec confluence at 24 hours.
-
Or like others said, the south shore would be good too...anywhere between Plymouth and Scituate.
-
BVY will be pretty good for winds. Even better place would be Cape Ann just to the east because they are exposed to the north by water....Gloucester or Rockport. Those two towns are just E of BVY and they will have much better winds.
-
Def more confluence up in Quebec on 18z NAM through 18h....
-
Yeah that is def showing the dual low structure...the bad members probably just run with the lead low eventually or consolidate it much later while the snowier members do what the NAM and the OP Euro did....capture the whole thing and tug it back near the Islands and stall/slow it.
-
Euro tries to stretch it out before it eventually cuts, but that is a trend that if it continues, it will turn the cutter into a winter wx event at least for NNE...still possible for SNE too but lesser probability.