Holston_River_Rambler
-
Posts
6,212 -
Joined
-
Last visited
Content Type
Profiles
Blogs
Forums
American Weather
Media Demo
Store
Gallery
Everything posted by Holston_River_Rambler
-
Yes, I have summoned you! But in all honesty, would it be any worse than Flora or Heath or Jimbly-bob, or whatever the Weather Channel goes with? Maybe Old Gregg?
-
#Grumpycat
-
Have a buddy in Wetumpka, AL. Tornado hit 3 blocks from his house.
-
 Finally found the site that has all the neat stratosphere prog maps I've been seeing in different places. https://stratobserve.com/tht_pvstr_maps
 -
A collection of realtime charts, some hard to find like AAM and GWO: http://atlas.niu.edu/ I'm not sure how to read some of this yet, but thought some might find it useful.
-
Found a new toy for past MJO( some of you may already have this) : http://www.bom.gov.au/climate/mjo/graphics/rmm.74toRealtime.txt
-
Found a nice website for N. Hemisphere info: https://yannickpeings.wixsite.com/nhatmosphere/copy-of-october-november-1
-
So... is the Modoki off the table @jaxjagman? Basin-wide moderate, or are things still in flux? Source of my question: Does Modoki vs. normal El Nino make that much difference for TN valley in the long run in terms of Winter pattern? Just heard so much about Modoki over the past years (not necessarily on here) and had my hopes up for something unusual this winter.
-
Found an interesting site from the University of Wisconsin with some non operation GOES 17 imagery: http://realearth.ssec.wisc.edu/?products=G17-ABI-FD-BAND01 Also, thanks to all for the good conversation lately (esp. Fall-Winter spec.), have been wanting to participate more, but swamped with work at this time. Although just catching up it looks like boring heat is the optimal word for now.
-
Looks like it's all trying to consolidate into a line now over the upper Cumberland plateau. Hopefully that puts and end to most of the tornado threat for those folks. No disrespect meant to any chasers in any way.
-
Cell in Monroe county, KY looks to be developing a hook. https://imgur.com/jomk03r
-
I saw Michael Ventrice on twitter say he thought this was going to be the biggest outbreak so far this year, but I suppose he could have been hyping to get followers. I just don't know enough about looking at severe parameters to tell how significant this looks. Also since I'm on the other side of the plateau and all this looks to be moving W - E, usual that means everything has consolidated and weakened by the time it gets to the eastern valley. I was surprised by the T-storms this morning and maybe that indicates the atmosphere is a little more prepped that it may seem at first glance? At work in Harriman right now and there are a lot of clouds here and that usually (but not always) spells stability, at least for my neck of the woods. But looks like the deck is starting to break up on GOES 16.
-
Found this nice website that has some limited, but nice ECMWF data for the N. Hemisphere. I think it is all past data, but still useful http://www.pa.op.dlr.de/arctic/ecmwf.php
-
Found this nice write up on 300 -250mb level while trying to learn more about what was causing the lift over SW VA this evening. https://www.weather.gov/source/zhu/ZHU_Training_Page/winds/JetStream_Stuff/300_200_chart.htm
-
Interesting find from a meteorologist in the MA forum regarding how the WPC generates their snowfall and other winter precip types probability forecasts: http://www.wpc.ncep.noaa.gov/pwpf/about_pwpf_products.shtml
-
Historic Tennessee Valley Cold, Snow, and Ice Events
Holston_River_Rambler replied to Carvers Gap's topic in Tennessee Valley
Seeing the link Carvers Gap posted in the speculation thread, made me remember a storm I was always curious about. I was in Kingsport at DB at the time and remember a what was probably a weird upper low that just spun over East TN. I remember the radar showing snow everywhere but Kingsport and the analogue of 3/26/99 seems to fit that bill. I wasn't into weather as much at the time, but enough to notice the weirdness of it. Any one have any memories of that one? -
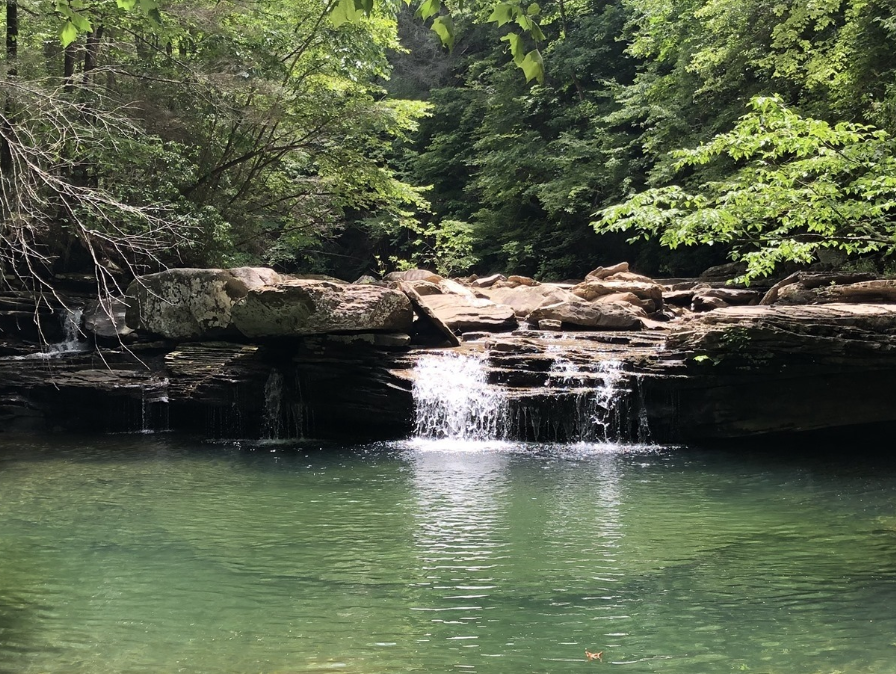
And I thought my waterfalls coming out of Cumberland county were full before: Sorry should have included the scale, 4.80 inches is the white
-
Historic Tennessee Valley Cold, Snow, and Ice Events
Holston_River_Rambler replied to Carvers Gap's topic in Tennessee Valley
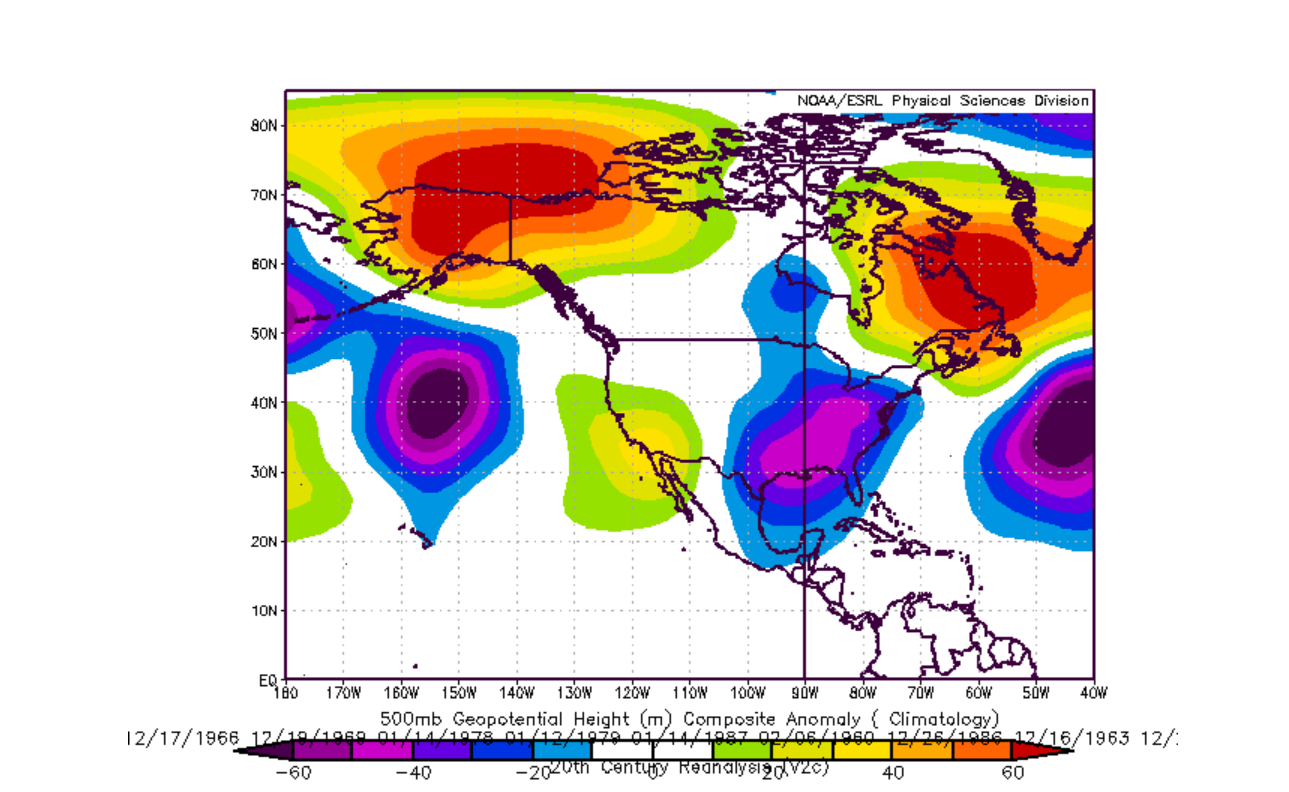
Dates used for the above composite: 2-9-58 1-1-96 3-5-93 1-22-66 12-17-66 12-19-69 1-14-78 1-12-79 1-14-87 2-06-60 12-26-86 12-16-63 12-25-70 1-1-88 1-25-96 12-10-73 1-6-78 -
Historic Tennessee Valley Cold, Snow, and Ice Events
Holston_River_Rambler replied to Carvers Gap's topic in Tennessee Valley
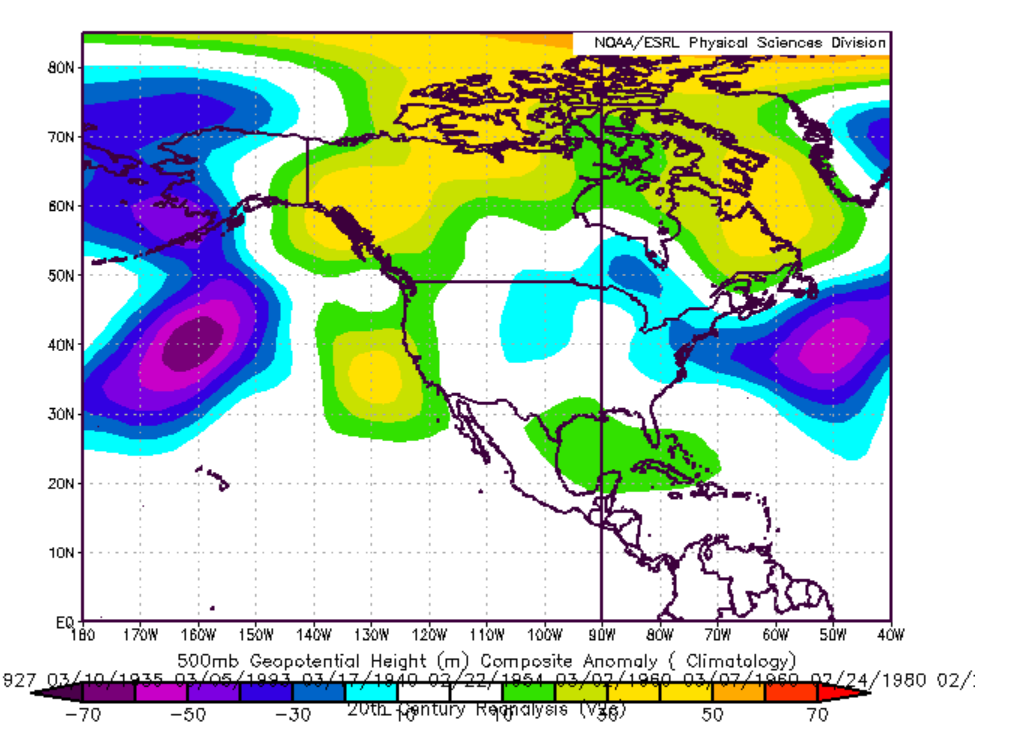
One last hurrah on this for a bit, unless asked for more.. I will be happy to do it for any all future months (with John's awesome help of course)! Disclaimer out of the way, I went through the KU book at just put in dates for one week before every storm from the 20th century that looked like it had a great track, or produced a lot of snow for most of the forum area. I mostly aimed for Miller As, since, for me anyway in Knoxville (1996 was good in Kingsport when I lived there though), Miller Bs have been awful. (Jan. 2016 was rough for me in Knoxville, though I watched it with y'all). There was one year that had a storm with an awesome track that their book showed as rain, but I left it in since the track was great and may have produced a different result given different boundary layer conditions. I also put in Jan. 1996, since it was epic for some of us. I couldn't add in anything after 2012, because of the data restrictions on the site, so I couldn't add my two favorite Knoxville storm years, Feb. 2014 and 2015. Without further ado, 500 mb anomalies in North America one week before some of our best storms:
-
Historic Tennessee Valley Cold, Snow, and Ice Events
Holston_River_Rambler replied to Carvers Gap's topic in Tennessee Valley
I'll also add this. As disheartening as it is, after looking at the NAO data today and having just looked at dates for big storms over the past few days, I think we want more mediocre NAO values. Some of the big dates had -NAOs, but most were under -1.0. But I think we've all agreed that it is as the big block decays that we get our chance(s). On the other hand there were no -NAOs below 3.0 in the winter in the period of record and I think only two on record at all, for any month. If this one goes that low who's to say what the outcome is. I also don't like the look of the little ridge poking up on that first image. Looks familiar to what is being modeled with this persistent mid continent ridge that connects to that NAO. -
Historic Tennessee Valley Cold, Snow, and Ice Events
Holston_River_Rambler replied to Carvers Gap's topic in Tennessee Valley
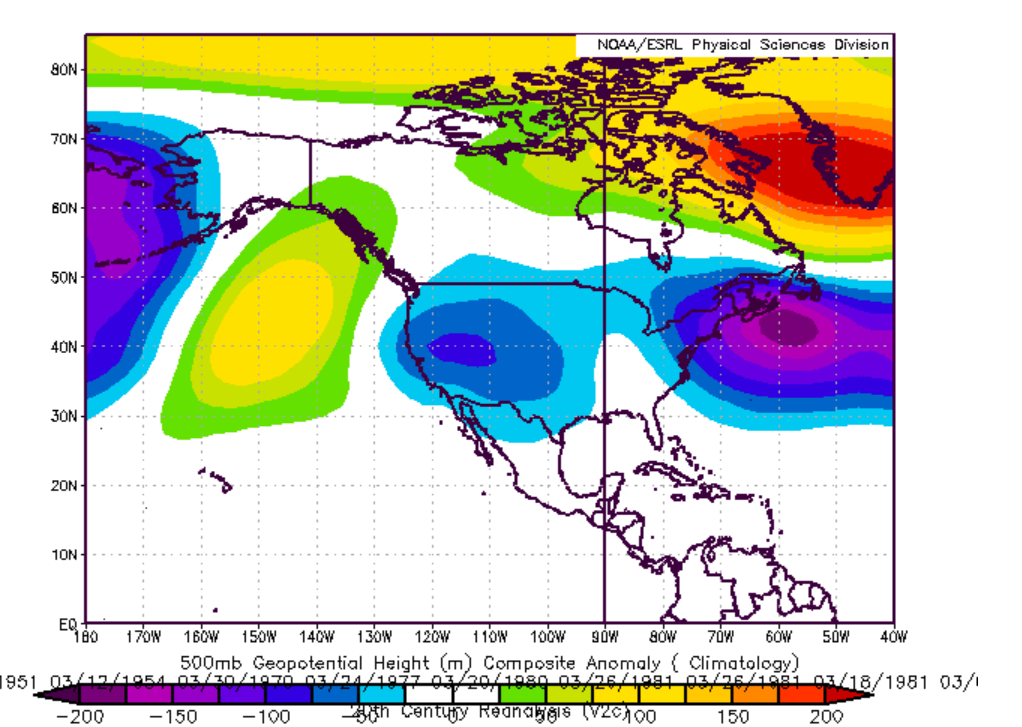
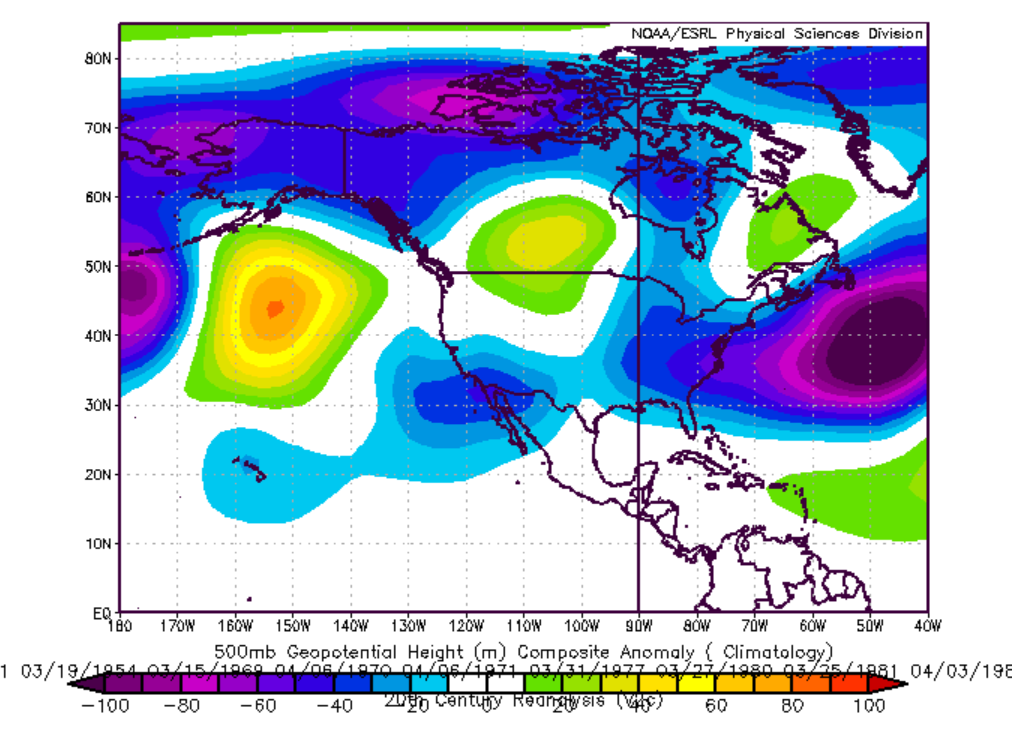
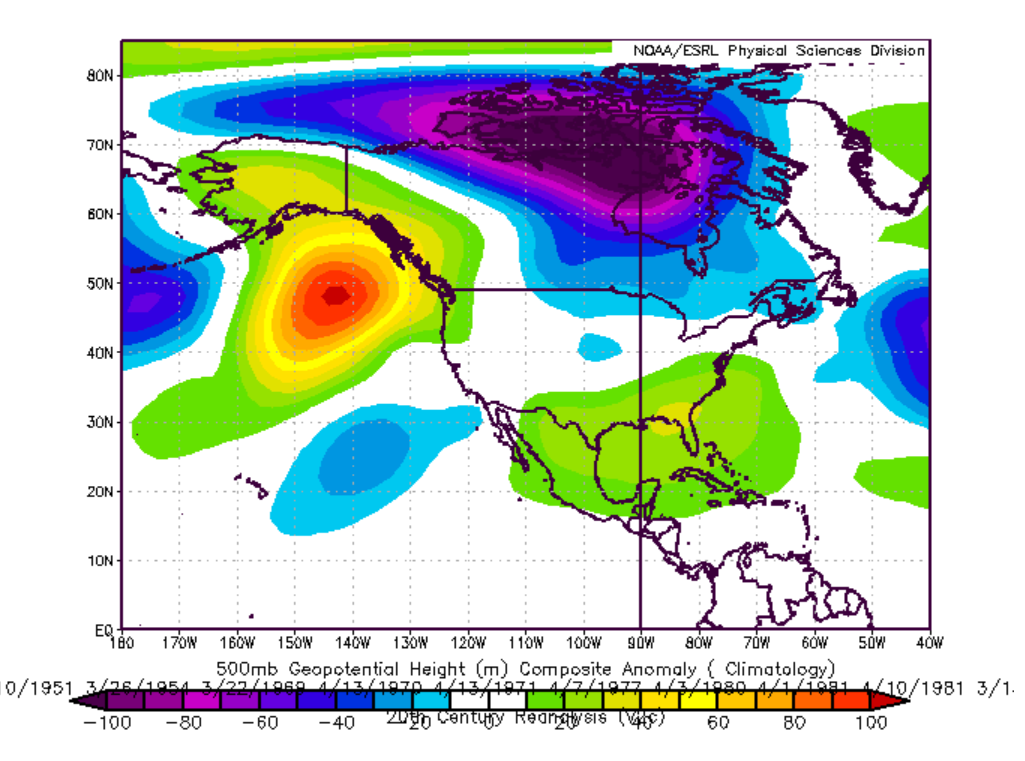
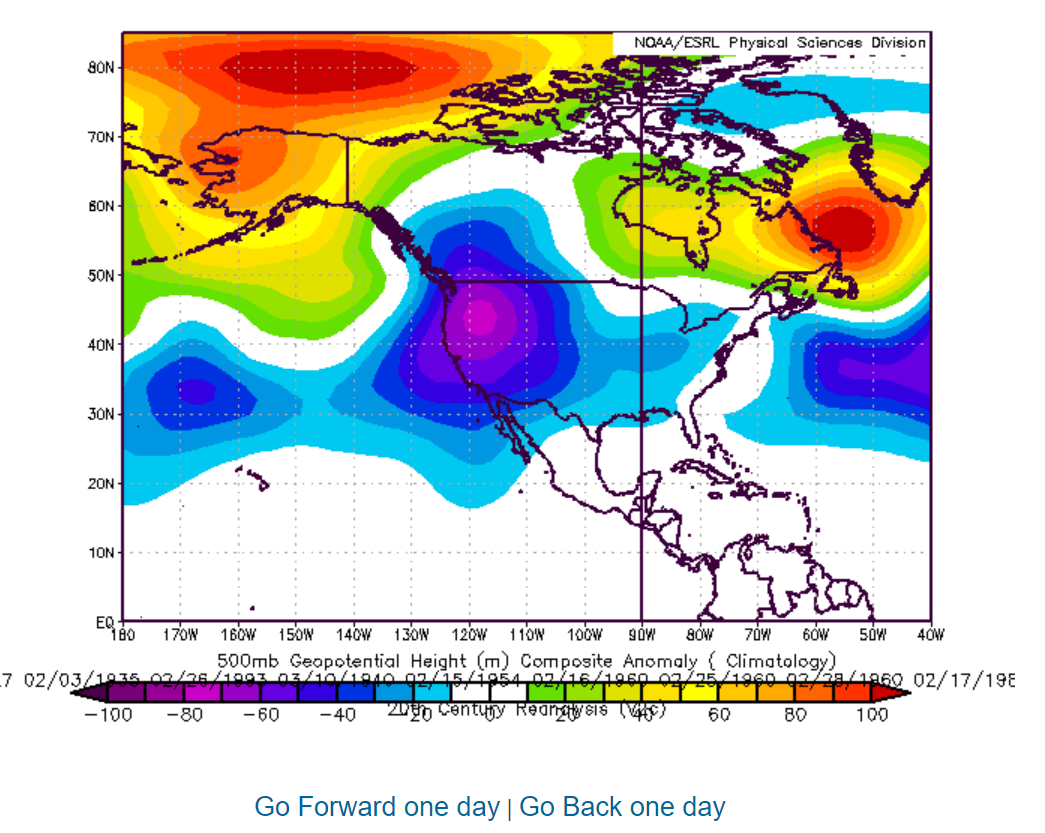
Alright, I chose dates that seemed to me to have the worst outcome (rain, no snow, warm) and I threw in a few others on John's list that I found to have also happened after a recorded SSW. For the ones that happened after a SSW I have added ENSO state and QBO since it was included in the SSW information and I thought, why not, and so then went back and added ENSO state and QBO for the others. I will also go back and edit my posts for the big snows to include ENSO state and QBO data so they match these. Here are my dates: 3-28-51: ENSO neutral; E QBO 3-12-54: had been El Nino, but in the FMA timeframe, dropped off quickly to 0.0; E QBO 3-6-69: SSW event on 13 March; El Nino; E QBO 3-30-70: ENSO Neutral; E QBO 3-30-71: SSW event 20 March; La Nina; E QBO 3-24-77: El Nino transitioning to Neutral; E QBO 3-20-80: El Nino transitioning to Neutral; E QBO 3-18-81: SSW event 4 March; ENSO Neutral; W QBO 3-26-81: ENSO Neutral; W QBO 3-1-2001: SSW event Feb 11; La Nina; E QBO To be honest it doesn't seem like any of those dates could have been big time snow producers for valley locations (could be wrong) and I will also add that many of the "worst" outcomes that I picked were at the end of March, so climo. may have played a part in those outcomes. I have attached images of composites of 500mb geopotential height anomalies for the time the -1.0 NAO began (top image), then the progression by one week (middle), and then by two weeks (last image).


-
Historic Tennessee Valley Cold, Snow, and Ice Events
Holston_River_Rambler replied to Carvers Gap's topic in Tennessee Valley
So, to be fair, I thought it might also be useful to look at big -NAOs (-1.0 or higher) that failed to produce anything in March. I went through the NAO data on ftp://ftp.cpc.ncep.noaa.gov/cwlinks/norm.daily.nao.index.b500101.current.ascii and searched for values or -1.0 or higher. Below are my results: -1 or higher 3-10-51 3-28-51 3-27-52 3-12-54 3-6-58/ 3-21-58 3-1-62 (almost the whole month lower than -1.0) 3-6-69 3-30-70 3-30-71 3-28-75 3-24-77 3-18-79 3-20-80 3-18-81 3-26-81 3-1-2001 3-11-2005 3-1-06 3-10-2010 3-24-2011 3-21-2013 -2 or higher 2-13-78 (only one that was close to the dates we're looking for; there were some April ones, but that'e getting pretty late in the season) -3 or higher None in the winter If John is willing, I thought it might be useful to look at his family records for a couple weeks after these dates to see if there were storms. If no storm, then I would like to build a composite for those dates as well so we can see what sort of pattern with a -NAO might not produce winter weather. -
Historic Tennessee Valley Cold, Snow, and Ice Events
Holston_River_Rambler replied to Carvers Gap's topic in Tennessee Valley
So this AM I thought it might be fun to add to the above image by looking at how we got to those dates. We often see analogues for the date of a particular storm, but not the weeks before and if many storms come at the end of major blocking, it might be a good idea to check out how things looked before. Below are the images for one week (top) and then two weeks (bottom) before the events above. It seems to me the NAO snaps and holds the ball while the Pacific finally kicks it.

-
I know I had two other links, but THIS is the correct link for the daily reanalysis page: https://www.esrl.noaa.gov/psd/cgi-bin/data/composites/plot20thc.day.v2.pl
-
Historic Tennessee Valley Cold, Snow, and Ice Events
Holston_River_Rambler replied to Carvers Gap's topic in Tennessee Valley
Alright, I have the first one. Below are the dates I picked. I started with the biggest ones on John's list and added ones I found in the KU book this AM. I have figured out how to work the system better and found the correct link (in the links thread) to the daily 20th century reanalysis data, so am happy to plug any combination in y'all want! 3-2-1942: No ENSO data; No QBO data 3-1-27: same as above 3-17-35 same as above 3-12-93: ENSO Neutral; W QBO 3-24-40: No data for either ENSO or QBO 3-1-54: EL Nino transitioning to Neutral; E QBO 3-2-60: ENSO Neutral; W transitioning to East based QBO 3-9-60: same as above 3-14-60: same as above 3-3-80: El Nino transitioning to neutral; E QBO 3-7-96: La Nina; E QBO 3-6-1992: El Nino; E QBO