Newman
-
Posts
2,500 -
Joined
-
Last visited
Content Type
Profiles
Blogs
Forums
American Weather
Media Demo
Store
Gallery
Everything posted by Newman
-

Central PA Winter 2022/2023
Newman replied to Blizzard of 93's topic in Upstate New York/Pennsylvania
Seeing the wind chill advisories issued for South Florida is hilarious... "Very cold wind chills of 30 to 35F". Kidding aside, that's pretty cold for that region. Still 42 here -
Central PA Winter 2022/2023
Newman replied to Blizzard of 93's topic in Upstate New York/Pennsylvania
My top 3 schools are University of Alaska Fairbanks, Wyoming, and Utah. So places that get real snow and winter! lol Check out the loop here, you can see some sort of wave riding up along the front making it's way north. That's what the HRRR and NAM are showing as our changeover to snow. https://weather.cod.edu/satrad/?parms=subregional-Mid_Atlantic-comp_radar-24-1-100-1&checked=map&colorbar=undefined -
Central PA Winter 2022/2023
Newman replied to Blizzard of 93's topic in Upstate New York/Pennsylvania
I'm a met student! Can't help it. Will have my red tag in a few short months when I graduate Except I won't be around the area anymore heading to grad school, but will still try to engage in the subforum when I can -
Central PA Winter 2022/2023
Newman replied to Blizzard of 93's topic in Upstate New York/Pennsylvania
No you're all good, it was worth mentioning. I even pulled out my Atmospheric Dynamics notebook and textbook to read up again on fronts quickly and apply it to the current obs/situation. Temp is dropping here, albeit slowly. Now 42 -
Central PA Winter 2022/2023
Newman replied to Blizzard of 93's topic in Upstate New York/Pennsylvania
The 3k NAM also has that similar back building of precip into the area. Regarding the front thing... I checked a HBG wunderground site and the pressure was already rising there. So to be honest I'm confused too because there's mixed signals I'm getting. But also, it doesn't really matter because all we really care about is the snow haha
-
Central PA Winter 2022/2023
Newman replied to Blizzard of 93's topic in Upstate New York/Pennsylvania
That's super interesting. I think those figures (from SPC and WPC) are just rough estimates though because we wouldn't be seeing the band of rainfall moving through if the front was already into New Jersey. Physically speaking from a basic meteorological standpoint, the precipitation is always associated along and AHEAD of the cold front where you get rising motion above the cooler air mass. So it's definitely not your fault, but the WPC map is deceiving because the front is definitely not into Jersey yet -
Central PA Winter 2022/2023
Newman replied to Blizzard of 93's topic in Upstate New York/Pennsylvania
My friend in Leesburg VA is getting some snow now too -
Winter Weather Advisory issued here PAZ054-055-060>062-240315- /O.NEW.KPHI.WW.Y.0020.221223T1409Z-221223T2300Z/ /O.CON.KPHI.WC.Y.0003.221223T2000Z-221224T1800Z/ Carbon-Monroe-Berks-Lehigh-Northampton- Including the cities of Jim Thorpe, Stroudsburg, Reading, Allentown, Bethlehem, and Easton 909 AM EST Fri Dec 23 2022 ...WINTER WEATHER ADVISORY IN EFFECT UNTIL 6 PM EST THIS EVENING... ...WIND CHILL ADVISORY REMAINS IN EFFECT FROM 3 PM THIS AFTERNOON TO 1 PM EST SATURDAY... * WHAT...For the Winter Weather Advisory, a strong cold front moving west to east across the area this morning will bring rain showers changing to a quick burst of snow with rapidly dropping temperatures. Snow accumulation will be limited to a half inch up to an inch and a half but it will fall in a brief period leading to a quick drop in visibility and icy conditions. West winds will also gust up to 55 mph. For the Wind Chill Advisory, very cold wind chills expected. Wind chills as low as 25 below zero. * WHERE...Carbon, Monroe, Berks, Lehigh and Northampton. * WHEN...For the Winter Weather Advisory, until 6 PM EST this evening. For the Wind Chill Advisory, from 3 PM this afternoon to 1 PM EST Saturday. * IMPACTS...Plan on slippery road conditions. The hazardous conditions could impact portions of the morning and evening commute. Gusty winds could bring down tree branches and result in power outages. The cold wind chills could cause frostbite on exposed skin in as little as 30 minutes. * ADDITIONAL DETAILS...The snow will be brief but icy conditions may linger through at least this afternoon.
-
Central PA Winter 2022/2023
Newman replied to Blizzard of 93's topic in Upstate New York/Pennsylvania
This is an incredible surface map. But look at the sagging of the isobars through the LSV, that's where the front is
-
Central PA Winter 2022/2023
Newman replied to Blizzard of 93's topic in Upstate New York/Pennsylvania
Anybody flip to snow yet on the backside of the front? Currently 42, down from a high of 56 at 2:30am. Pouring rain. -
Made it to 56 around 2:30am, now down to 43 and patiently awaiting the front
-
Just about to hit 50° here
-
Winds are picking up here, getting occasional gusts that rattle the house. 43F
-
Your obs for Berks? I'm at 42 up in Fleetwood right now
-
32F and rain here. The meso models have all been coming in more pronounced with precip along the arctic front, specifically rain. That will definitely increase the chance of a flash freeze with rainfall imminently occurring during the freeze process
-
Snow and sleet covered roads here, 30F and a wintry mix currently
-
E PA/NJ/DE Winter 2022-2023 OBS Thread
Newman replied to Ralph Wiggum's topic in Philadelphia Region
Snow/Sleet/Rain mix now, temp dropped back to 31F -
E PA/NJ/DE Winter 2022-2023 OBS Thread
Newman replied to Ralph Wiggum's topic in Philadelphia Region
Still virga even under some brighter radar returns. Not sure I agree with the WWA just for that reason, seems like we may lose a lot of time to virga and dry air. But hoping to see some flakes soon. Temp is already up to and creeping past 32F -
E PA/NJ/DE Winter 2022-2023 OBS Thread
Newman replied to Ralph Wiggum's topic in Philadelphia Region
URGENT - WINTER WEATHER MESSAGE National Weather Service Mount Holly NJ 833 AM EST Thu Dec 22 2022 PAZ054-055-060>062-221800- /O.NEW.KPHI.WW.Y.0019.221222T1333Z-221222T1800Z/ Carbon-Monroe-Berks-Lehigh-Northampton- Including the cities of Jim Thorpe, Stroudsburg, Reading, Allentown, Bethlehem, and Easton 833 AM EST Thu Dec 22 2022 ...WINTER WEATHER ADVISORY IN EFFECT UNTIL 1 PM EST THIS AFTERNOON... * WHAT...Snow mixed with sleet and freezing rain. Snow accumulations of up to one inch with up to a couple hundredths of an inch of ice accretion. * WHERE...Carbon, Monroe, Berks, Lehigh and Northampton. * WHEN...Until 1 PM EST this afternoon. * IMPACTS...Plan on slippery road conditions. The hazardous conditions could impact the morning commute. * ADDITIONAL DETAILS...A brief period of snow mixed with sleet and freezing rain is expected this morning before precipitation changes to all rain from south to north by early this afternoon. Up to an inch of snow could fall in the southern Poconos while farther south any snow accumulation today should be a half inch or less. However most locals within the advisory area could see a very light glaze of freezing rain. -
E PA/NJ/DE Winter 2022-2023 OBS Thread
Newman replied to Ralph Wiggum's topic in Philadelphia Region
Winter Weather Advisory just issued here -
E PA/NJ/DE Winter 2022-2023 OBS Thread
Newman replied to Ralph Wiggum's topic in Philadelphia Region
29F here with the temp rising fast, looks like we have radar returns over us but just virga right now -
Central PA Winter 2022/2023
Newman replied to Blizzard of 93's topic in Upstate New York/Pennsylvania

-
Central PA Winter 2022/2023
Newman replied to Blizzard of 93's topic in Upstate New York/Pennsylvania
We'll see if this cooling trend continues on the HRRR, or even verifies, but it's definitely not a bad thing to see.
-
Central PA Winter 2022/2023
Newman replied to Blizzard of 93's topic in Upstate New York/Pennsylvania
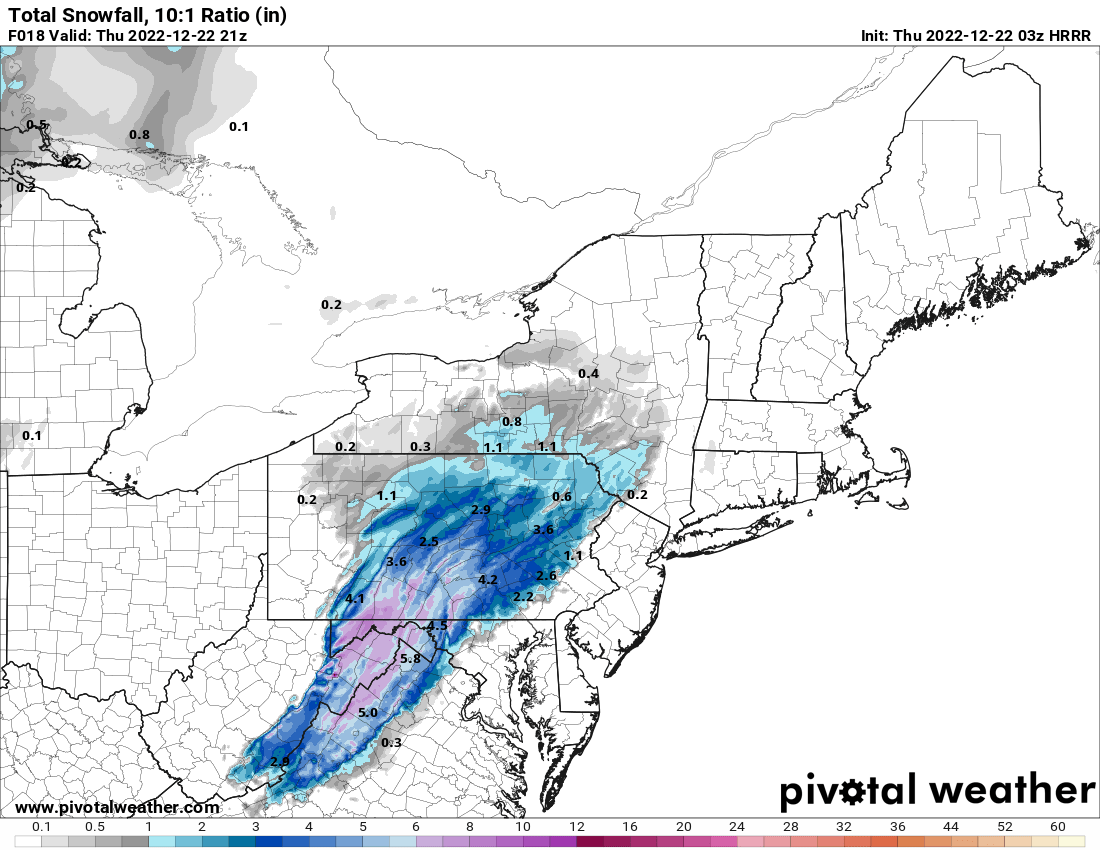
This 3z HRRR run coming in now is gonna be very very solid for the area -
E PA/NJ/DE Winter 2022-2023 OBS Thread
Newman replied to Ralph Wiggum's topic in Philadelphia Region
The HRRR says maybe we start as snow in the morning? I don't think we will, but it'll be worth watching