Newman
-
Posts
2,518 -
Joined
-
Last visited
Content Type
Profiles
Blogs
Forums
American Weather
Media Demo
Store
Gallery
Everything posted by Newman
-
The super ensemble, deep mind ensemble, and every other model ensemble is there on the site. You have to click the storm itself and then it brings up the storm specific information, in which you can toggle to model ensemble data https://polarwx.com/tropical/#al092026/ensembles
-
Tomer's newest tropics site https://polarwx.com/tropical/
-

E PA/NJ/DE Autumn 2026 Obs/Discussion
Newman replied to PhiEaglesfan712's topic in Philadelphia Region
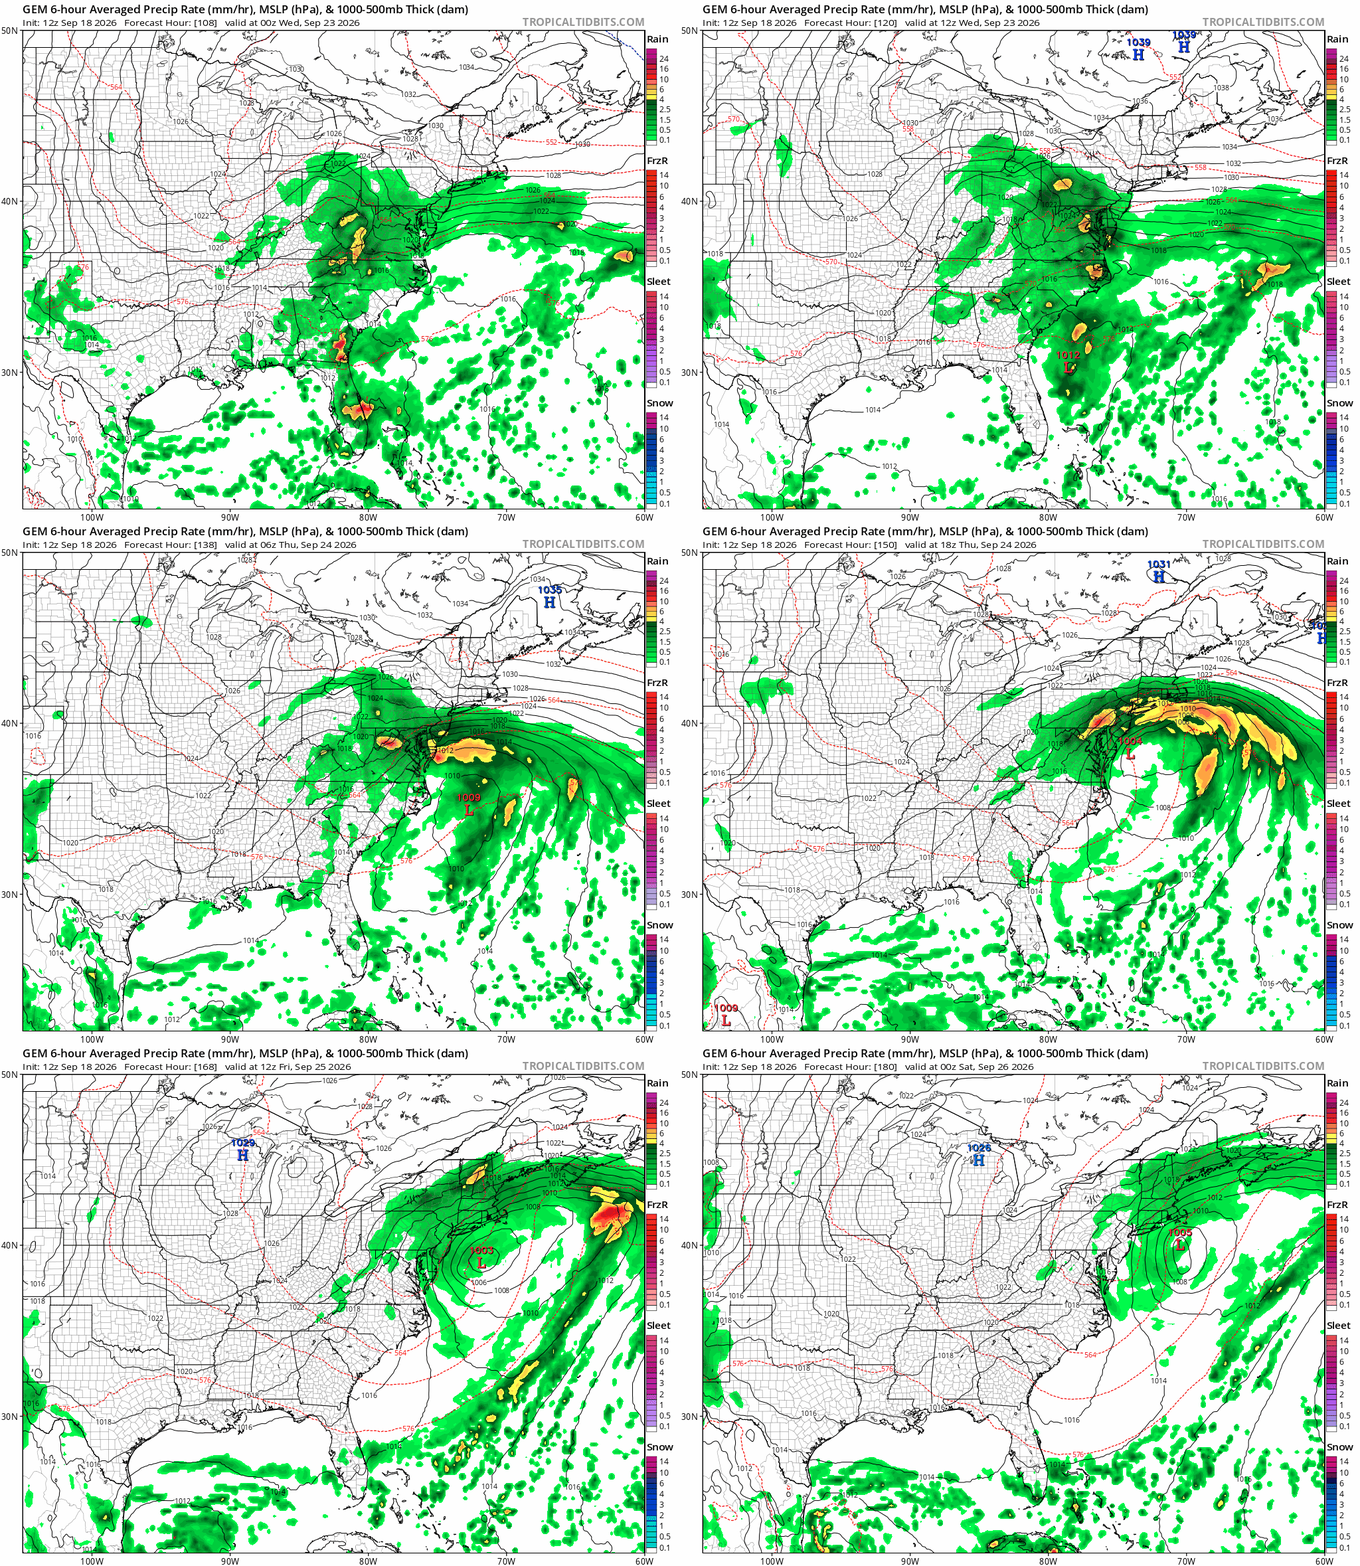
12z Euro looking like it maximizes our weekend nor'easter/hybrid system east of the Delmarva and swings it right into the Jersey coast sub 990mb. Biggest worries are going to be coastal winds/rain/waves. Inland areas are unlikely to see serious impacts beyond gusty winds and outer rain bands, unless this thing trends closer to the coast with a faster dumbbell/slingshot west.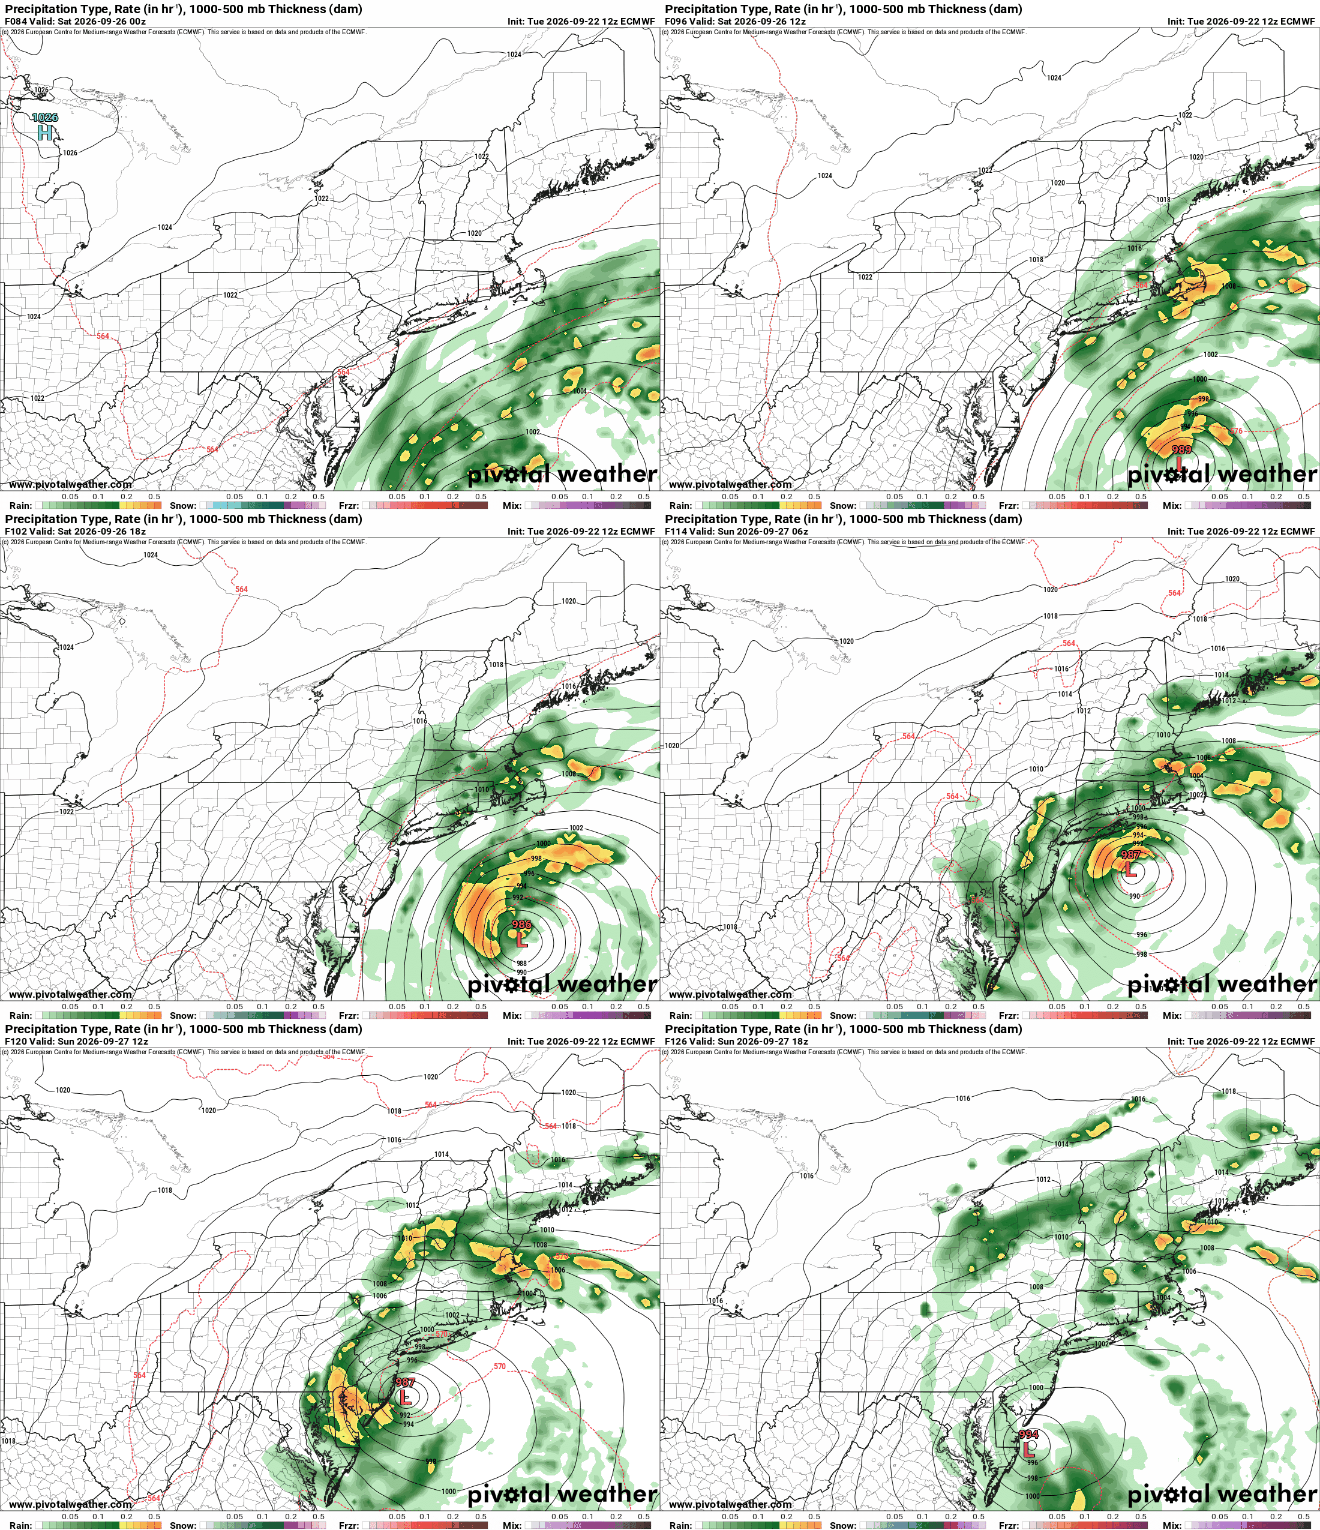
-
E PA/NJ/DE Autumn 2026 Obs/Discussion
Newman replied to PhiEaglesfan712's topic in Philadelphia Region
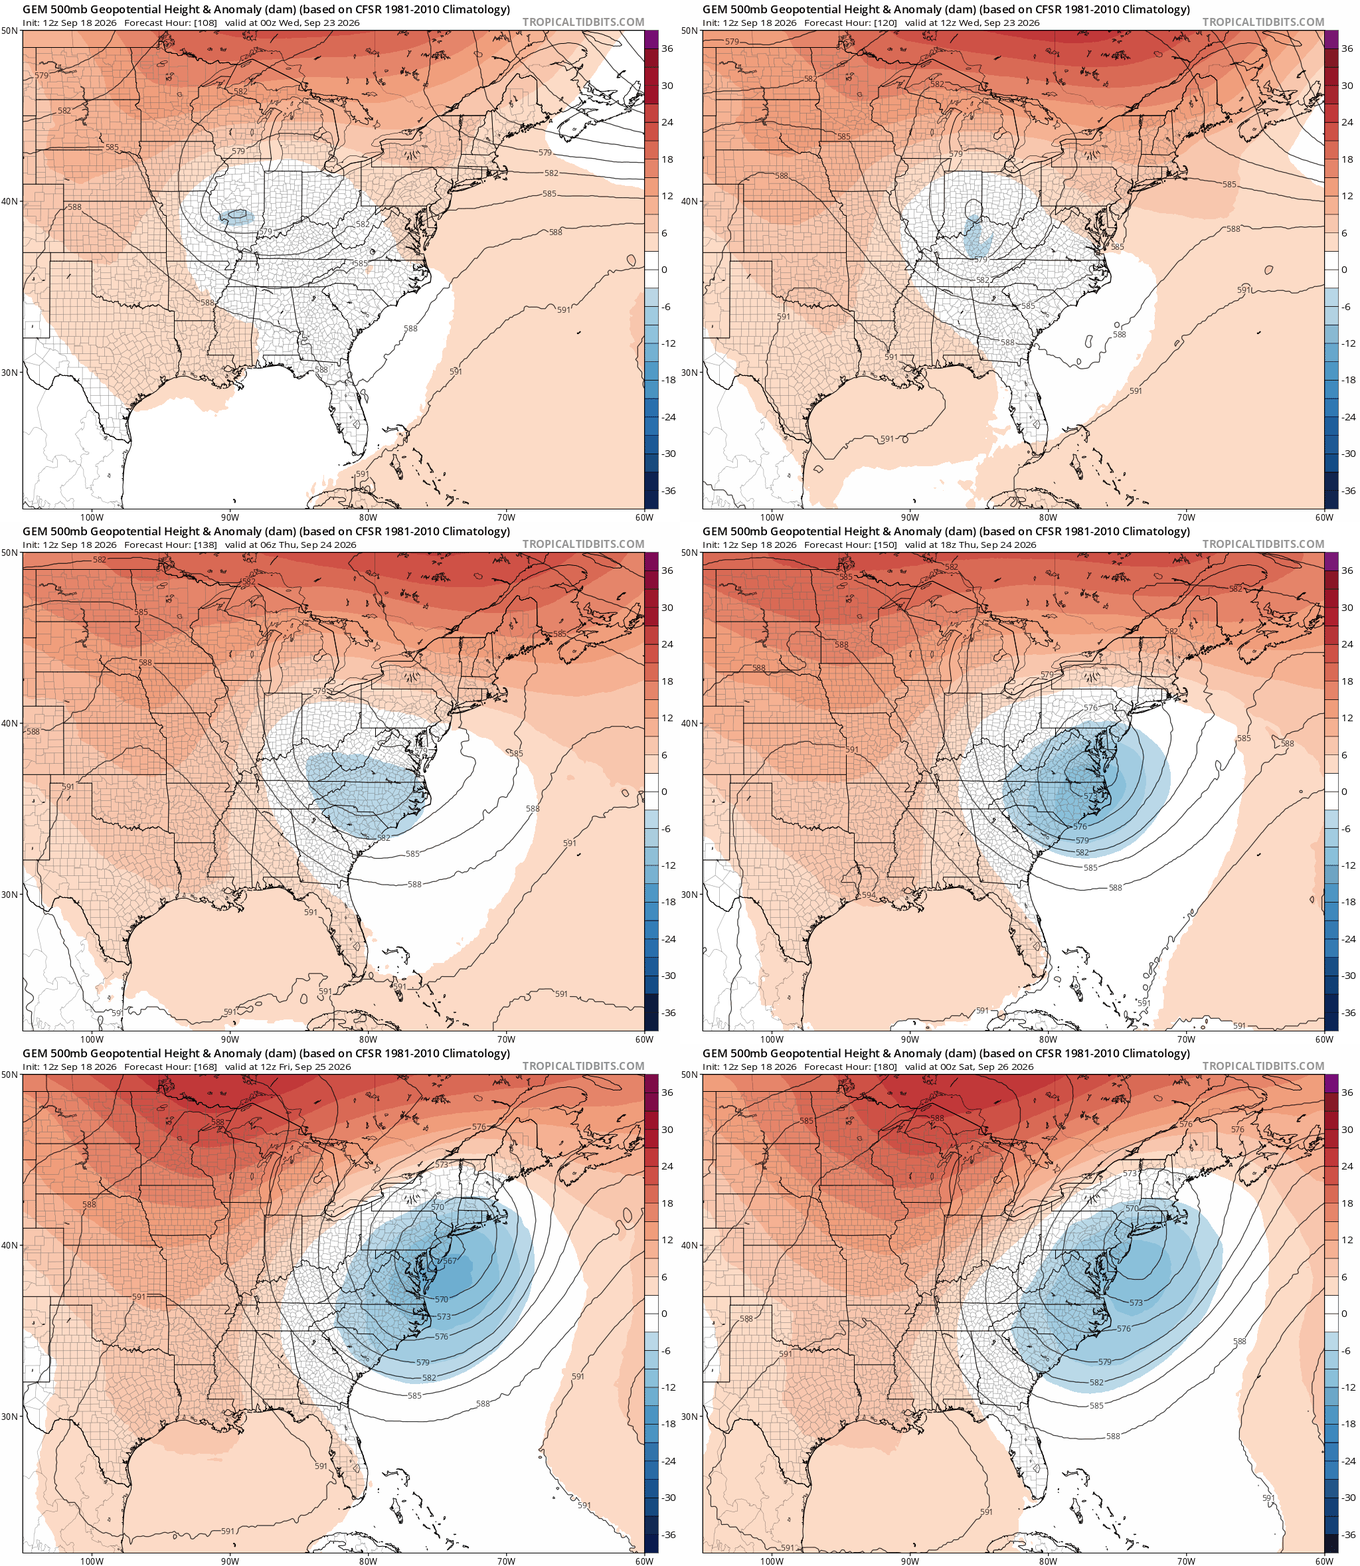
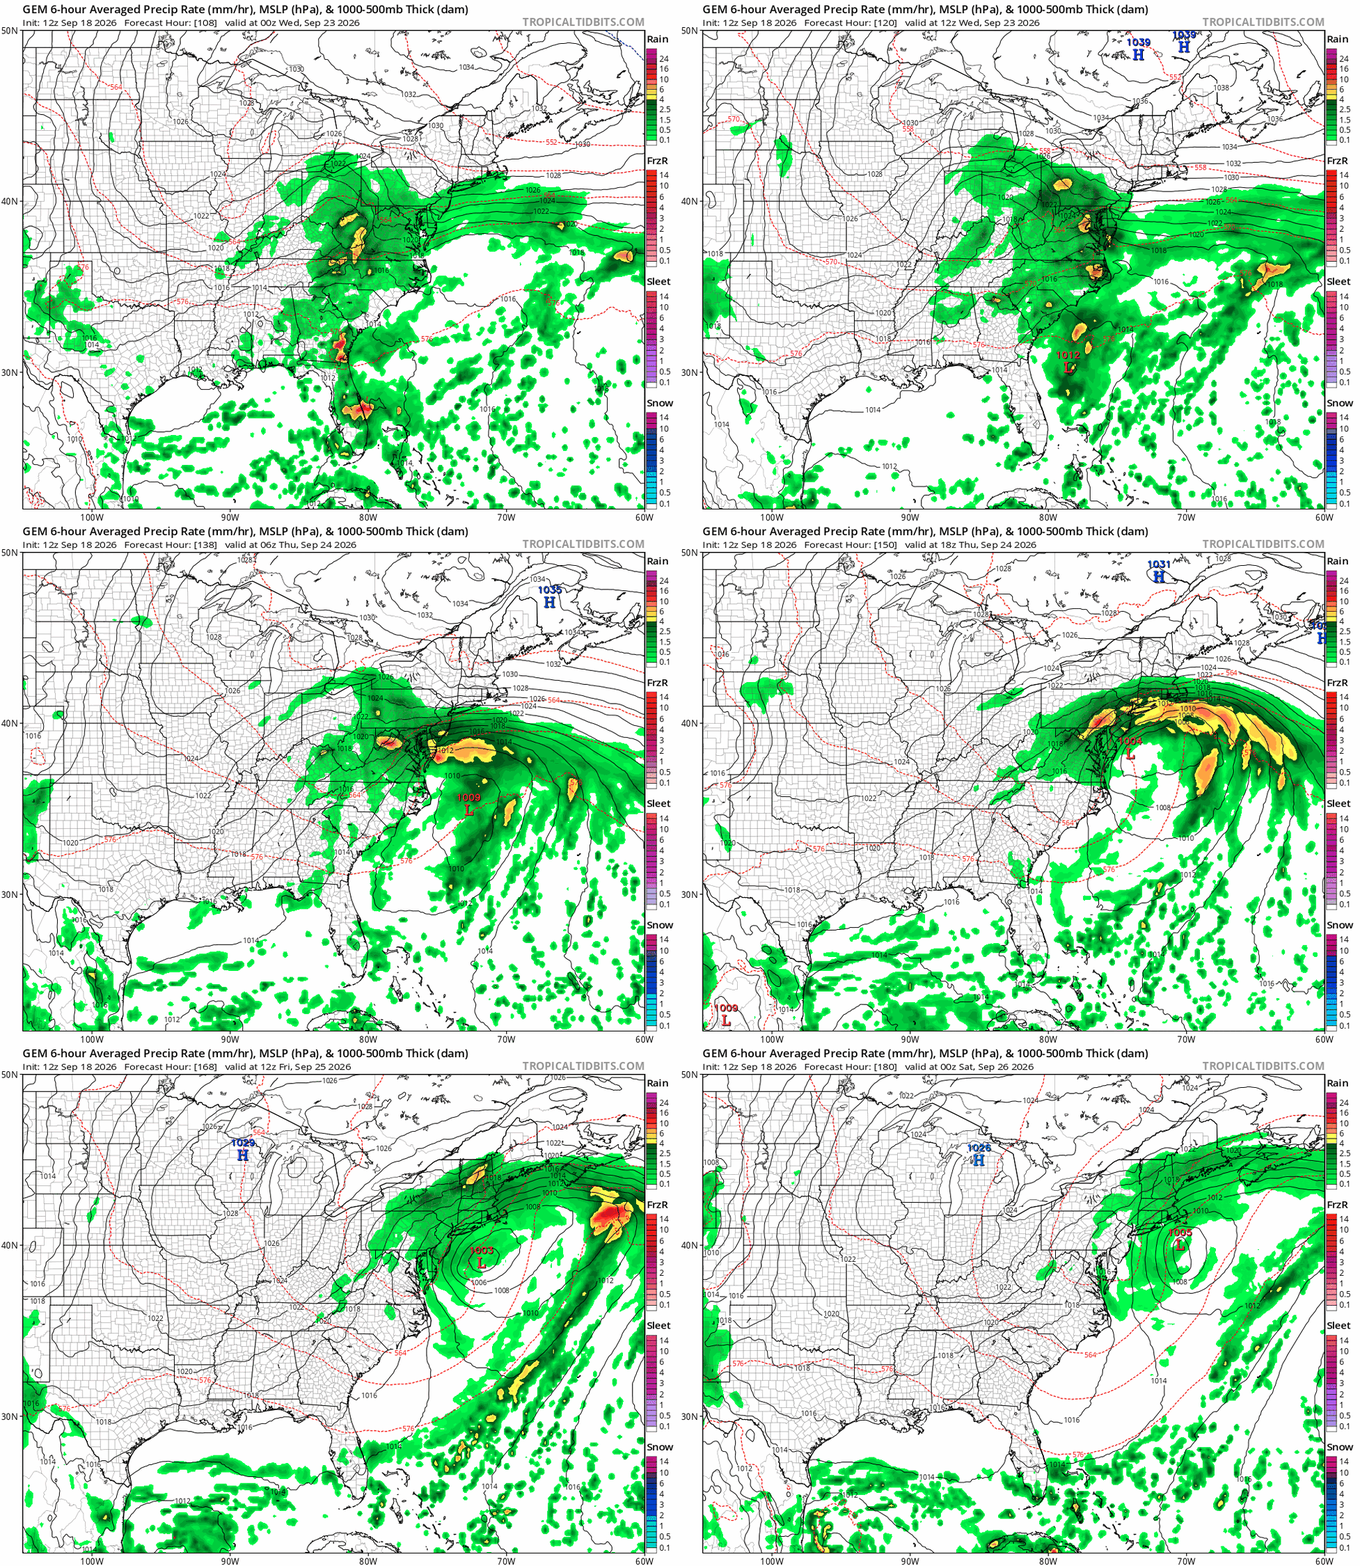
Canadian has a beautiful H5 pass with the progged coastal system next week. Too bad it's not January! Maybe a good sign for the winter, though? By the way, ever since the Canadian suite was upgraded in recent months it's been outperforming the Euro and GFS by quite a bit.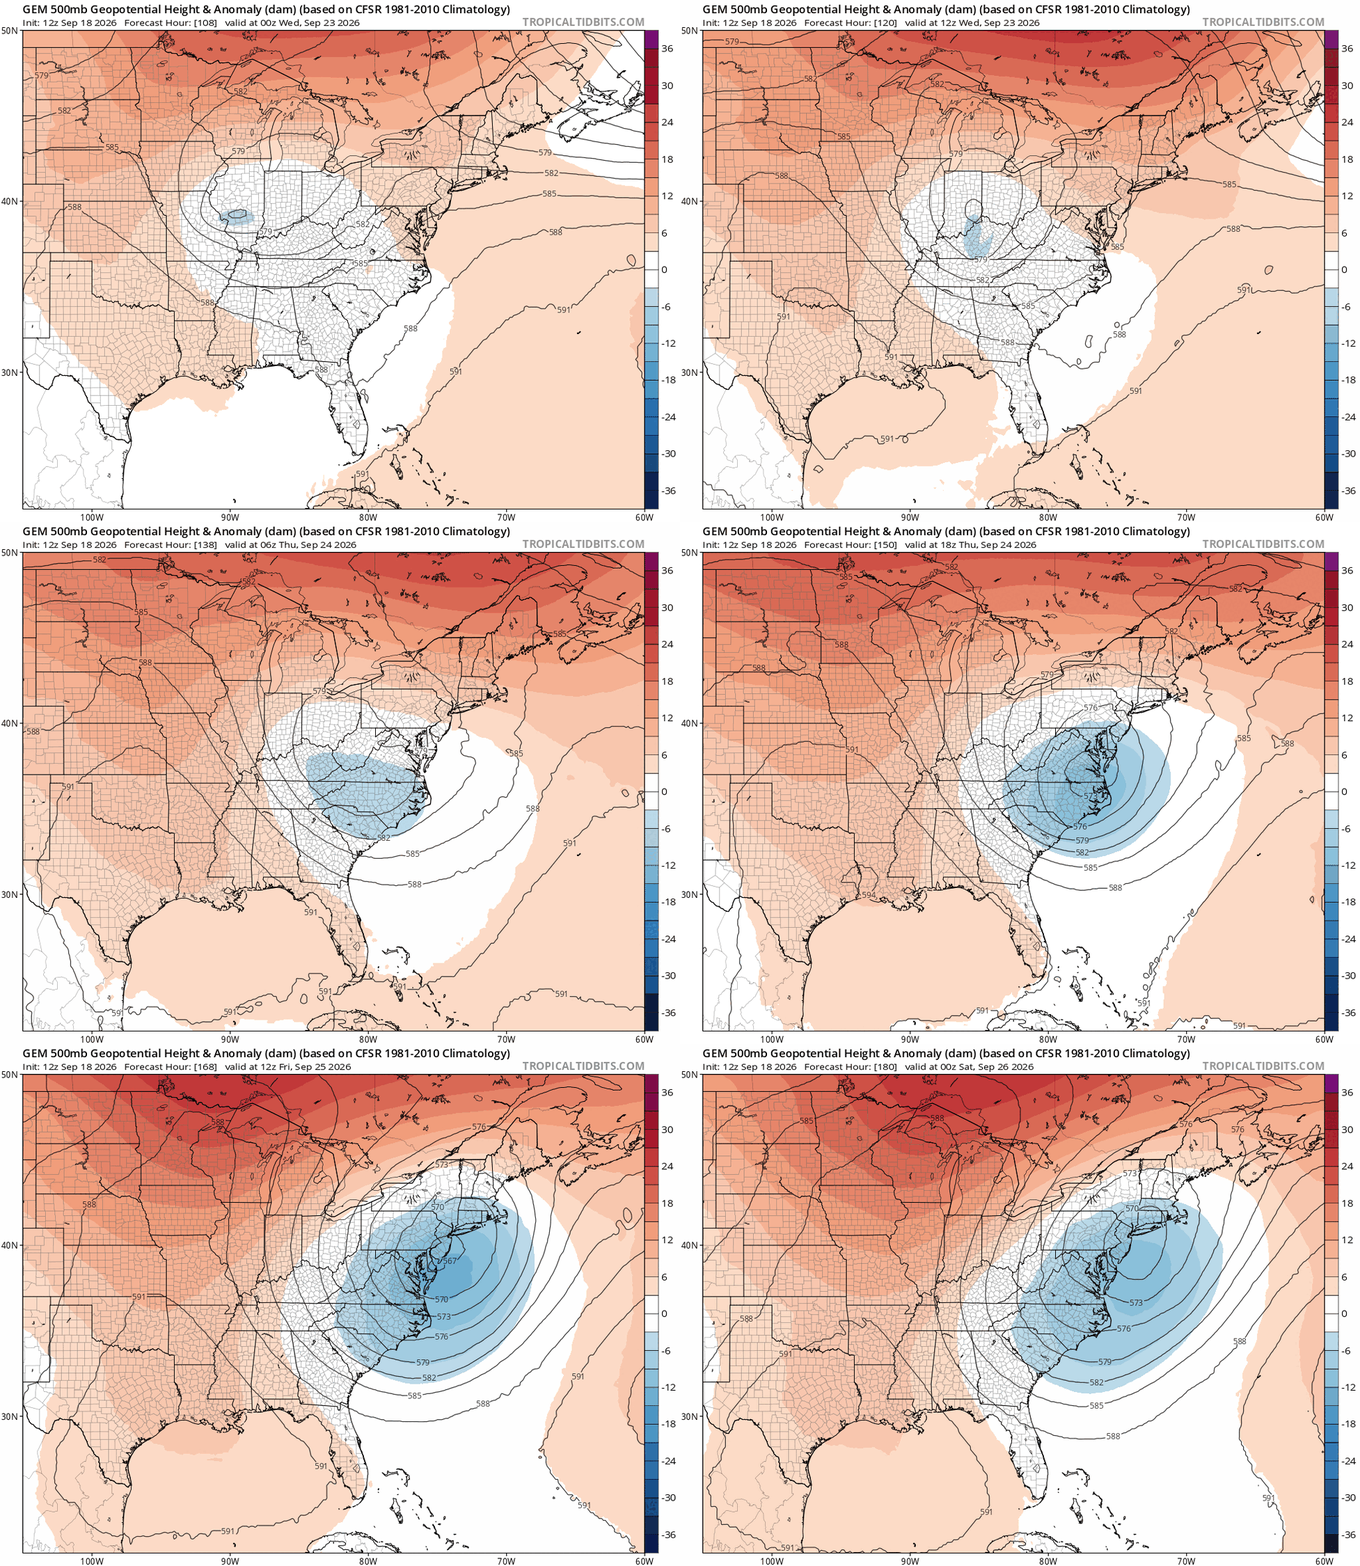
-
GFS has been trending towards some trailing tail-end energy of the cold front passing through the Northeast on Monday cutting off and drifting southwest under the ridge. The Euro and Canadian are both showing it and trending towards it too, albeit weaker. Certainly couldn't rule out a subtropical type system developing should this scenario play out.

-
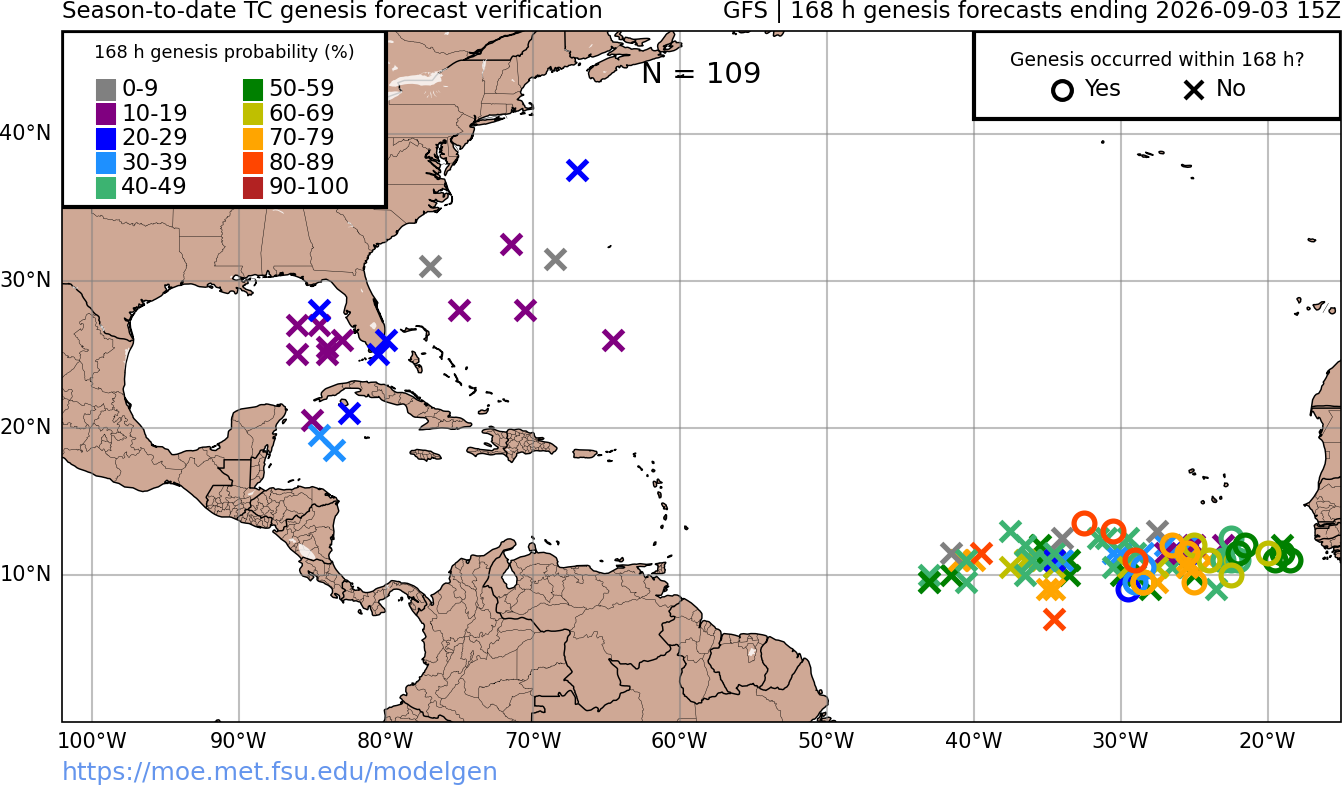
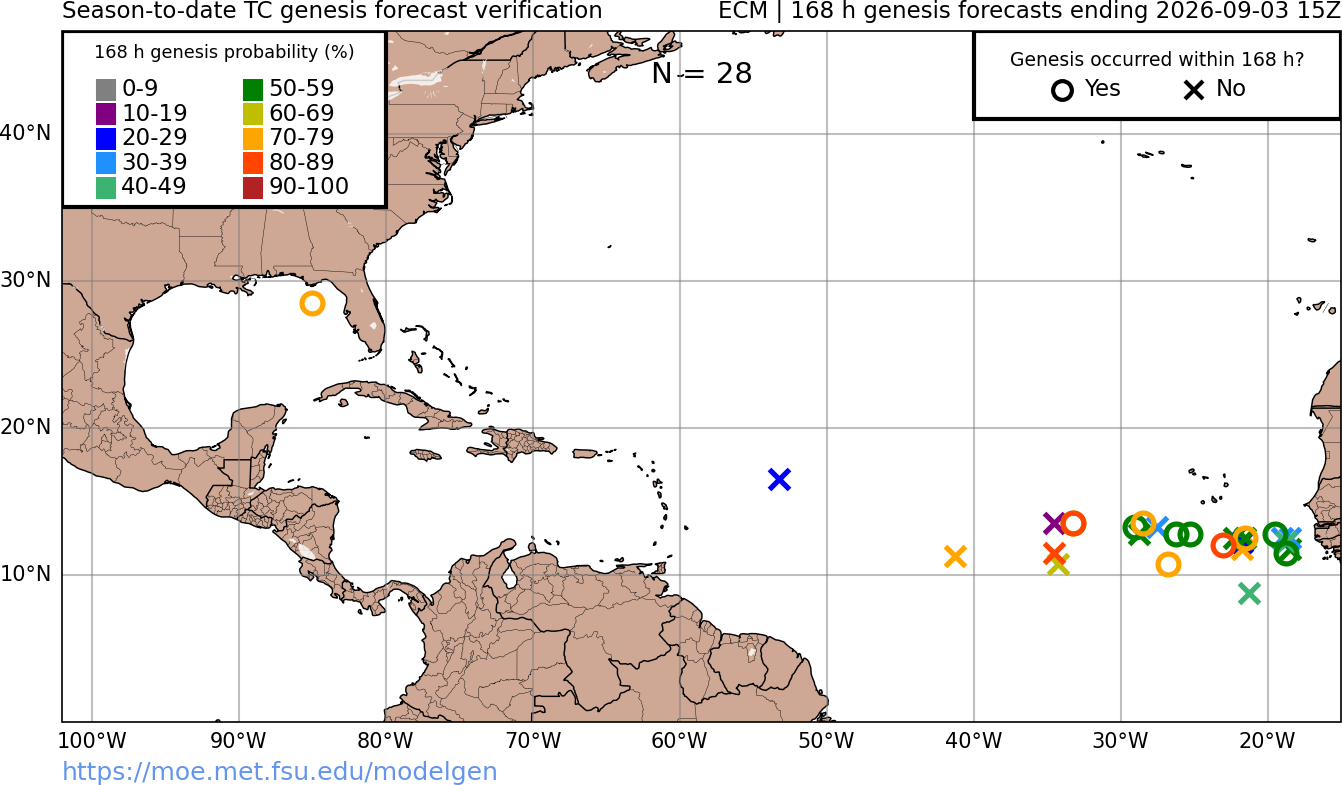
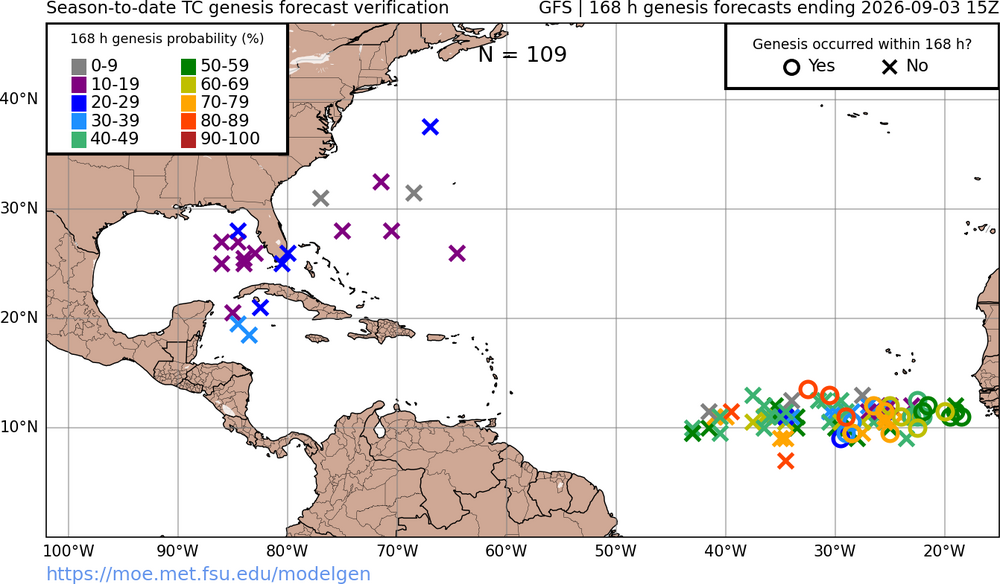
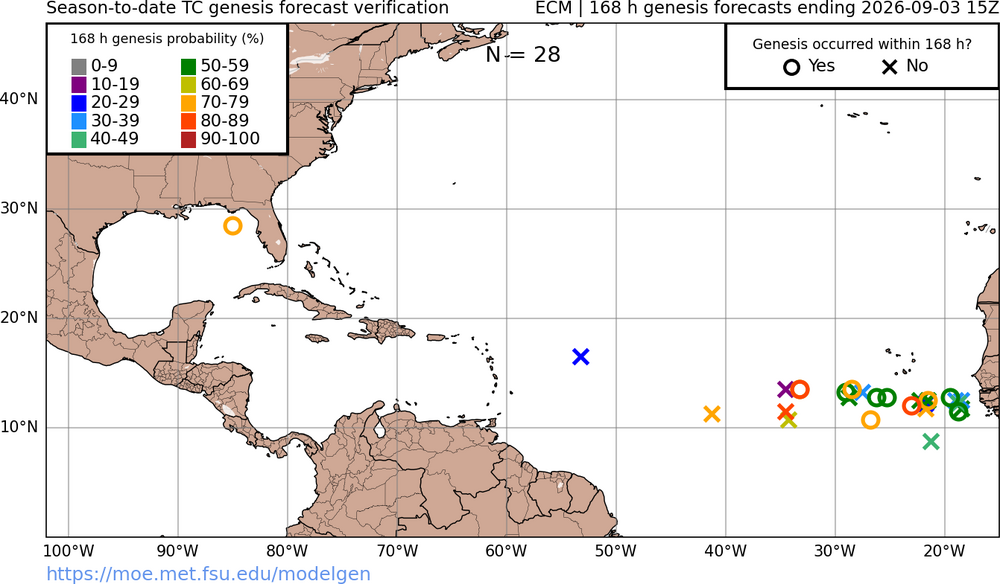
GFS showing a gyre storm developing in the SW Caribbean and blasting north the last few runs wayyy out in fantasy land. But in case you need a reminder in how the GFS has been doing this year: Just for comparison, this is the ECM for this year so far:
-
2026-2027 Record-breaking El Nino
Newman replied to Stormchaserchuck1's topic in Weather Forecasting and Discussion
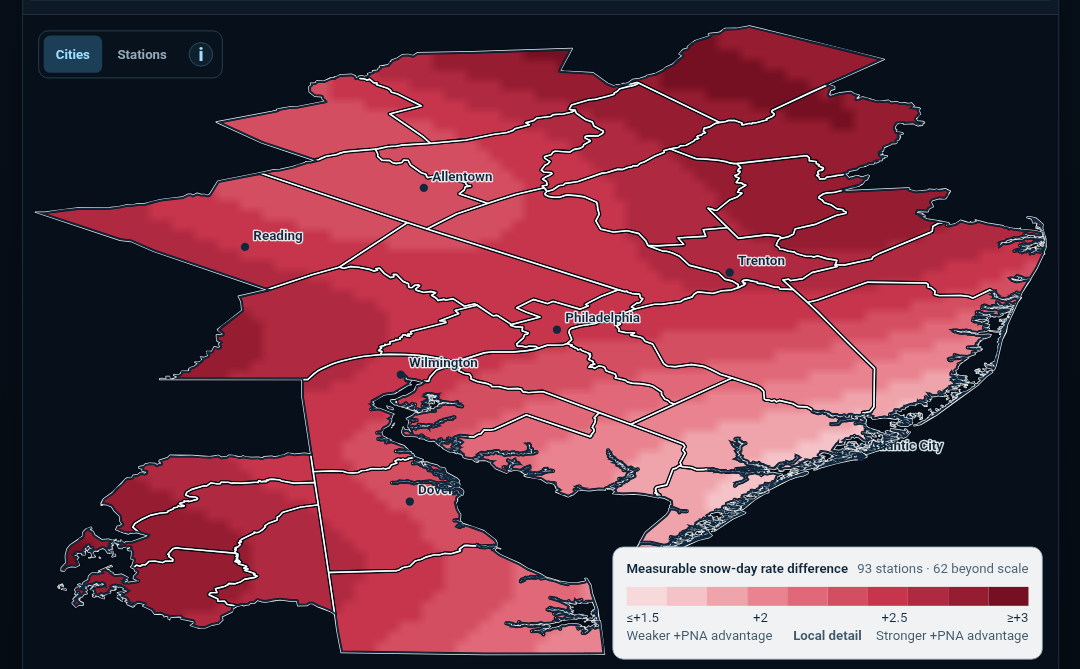
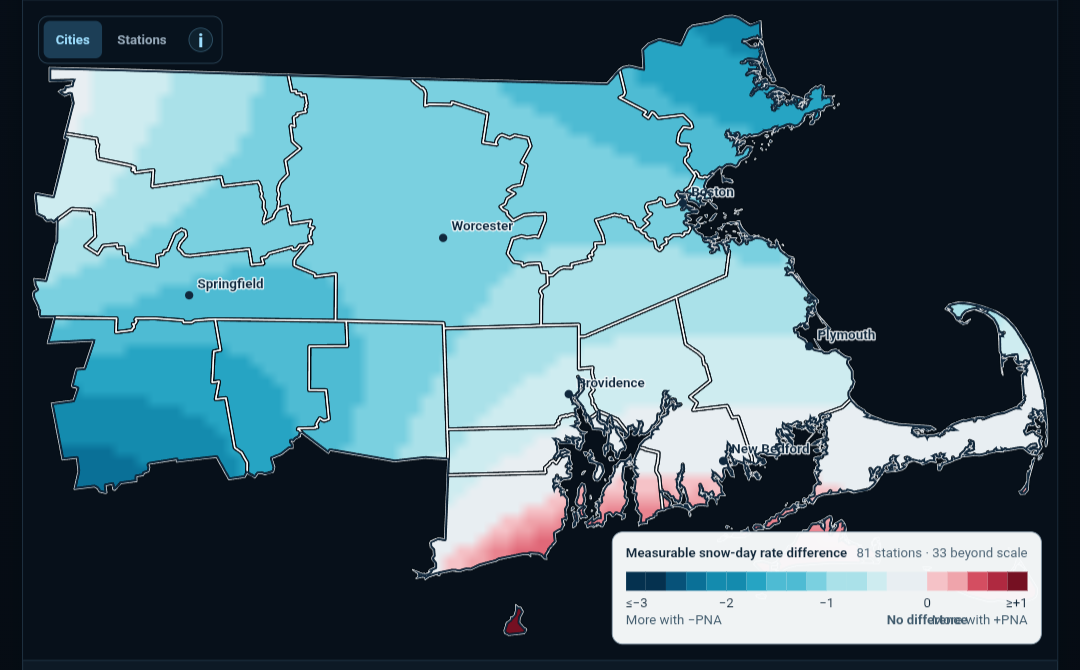
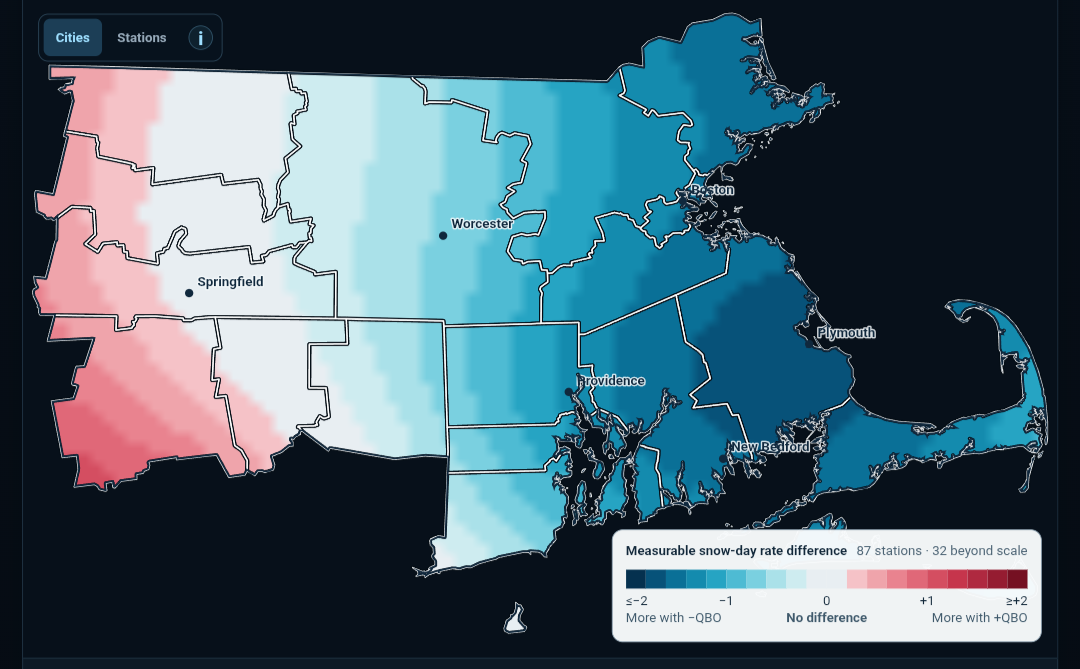
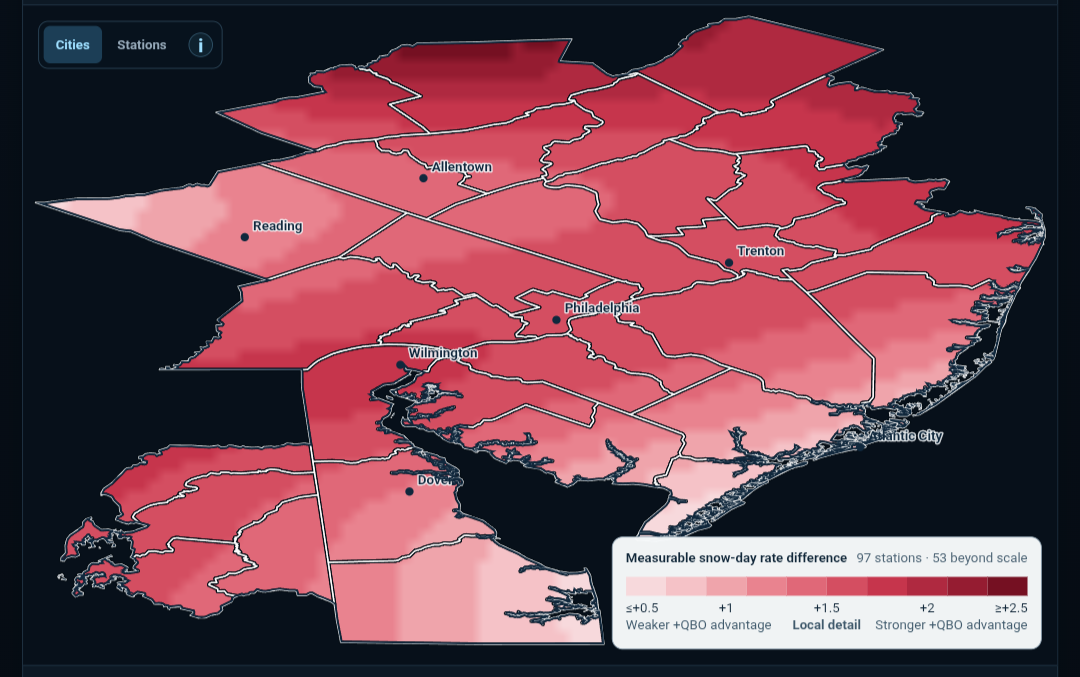
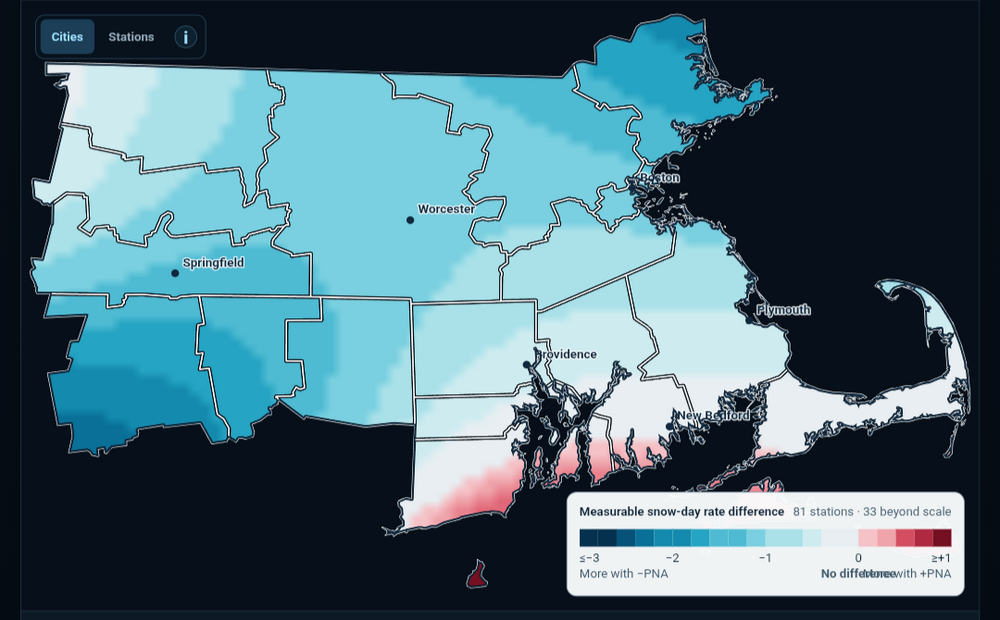
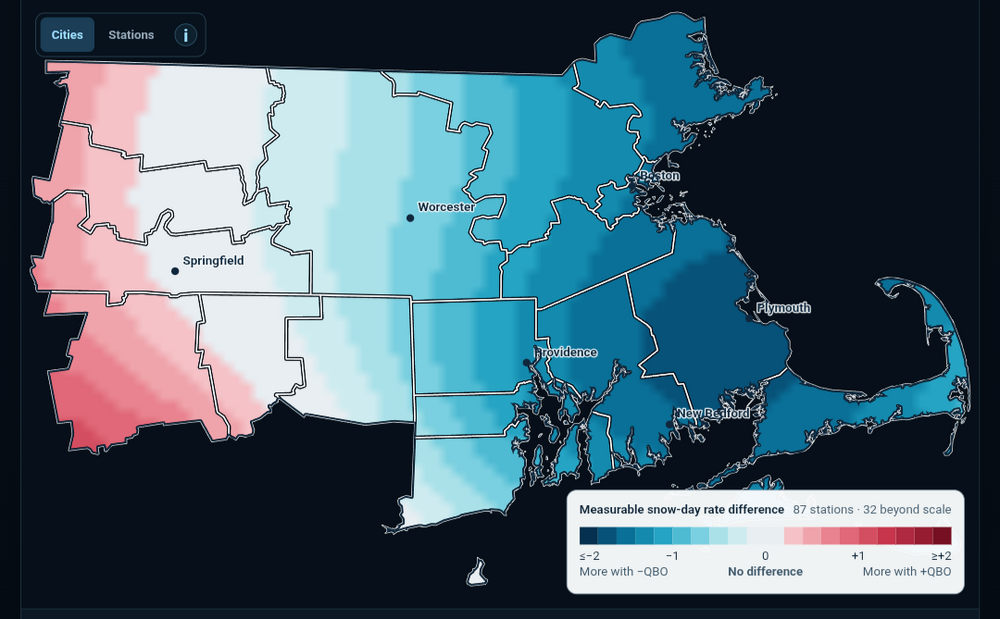
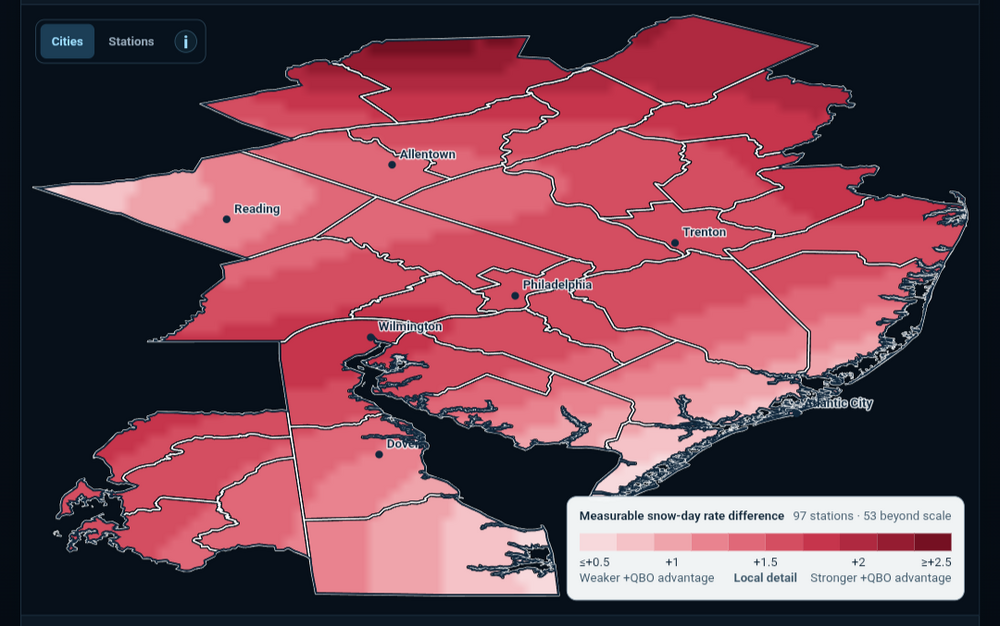
I haven't been active in this thread so apologize if it's already been shared before, but Dr. Jonathan Wall has a great project developed on his website at https://snow.wall.cloud/ You can dive really deep into and compare statistical significance of various teleconnections for a few different snowfall criteria (i.e. trace of snow at 10% or more of stations, 25% of stations measuring 0.1" or more snow, total event coverage or magnitude of snow totals, etc), and all of this broken down by NWS CWAs. But what's neat is you can also break it down further with these various teleconnections during El Nino, neutral, and La Nina. Here is an example between BOX and PHL CWAs in an El Nino winter for the PNA. The PHL CWA leans towards/favors +PNA for number of qualifying days with at least 25% of stations measuring snow. Meanwhile, BOX weakly leans towards/favors -PNA. The numbers on the maps are all absolute differences between percentages. Of course, the caveat is that there are some outliers in both situations and it's not consistent amongst all measurable snowfall days. In fact (and you can find this on the website) the most statistically significant teleconnection is a -EPO across both CWAs (most significant when selecting "all winters" and not just separating out ENSO): Here is another example but with QBO during El Nino just for shits and giggles. PHL actually leans towards +QBO for number of qualifying days with measurable snow at 25% of eligible stations (I'll have to look into the details of the data here, I wonder if there's some bias from big dogs that formed during +QBO/+ENSO seasons) and eastern BOX leans towards -QBO but western BOX leans towards +QBO. Again, very very important to note this is not gospel and there are outliers that prove snowstorms can happen in either phase of QBO. Either way, cool website and wanted to share. All of the details should be there on the site. From the site: "This is a descriptive historical phase comparison: each DJF winter is grouped by its mean index phase. Red favors positive phase, blue negative. The shading estimates the station-rate pattern between qualified stations."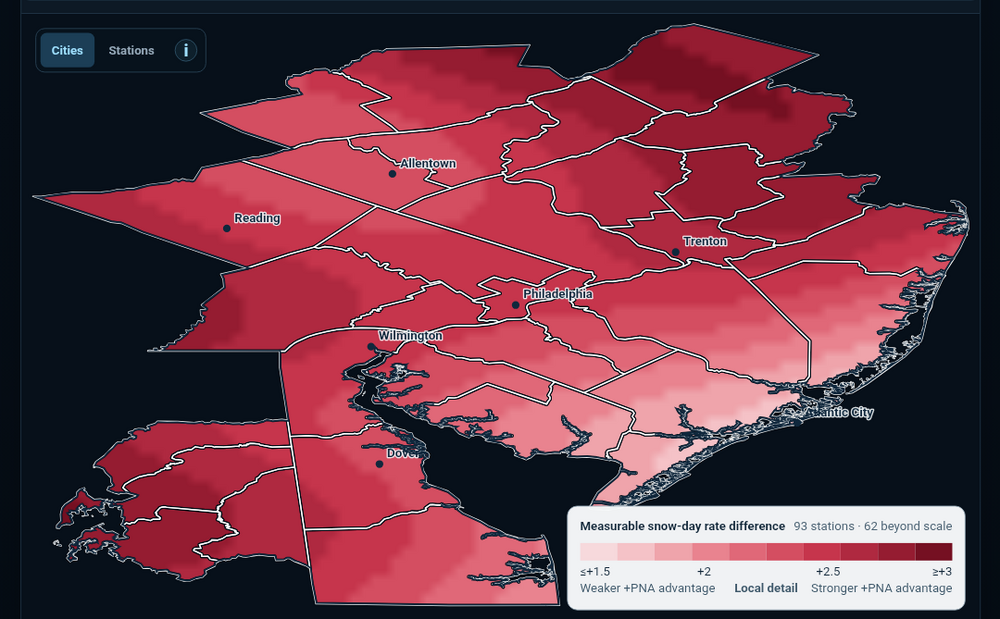
-
E PA/NJ/DE Summer 2026 Obs/Discussion
Newman replied to PhiEaglesfan712's topic in Philadelphia Region
Unfortunately, some of this is completely out of the hands of the amazing team at NWS Mount Holly. New policies are forcing heavy reliance on NBM output, which is basically used "verbatim" in their grids. In other words, the meteorologists with special local knowledge can't exercise said knowledge to "beat the models" unless sufficient justification is provided. At that point, they may be allowed to send requests to the WPC to update/change the forecasts from raw NBM output. Not saying your forecasting skills are bad either LOL, just saying that the NWS doesn't have the freedom to forecast like they once used to. -
E PA/NJ/DE Autumn 2026 Obs/Discussion
Newman replied to PhiEaglesfan712's topic in Philadelphia Region
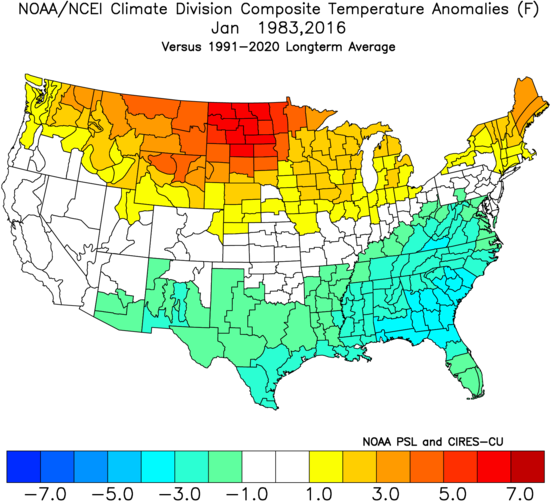
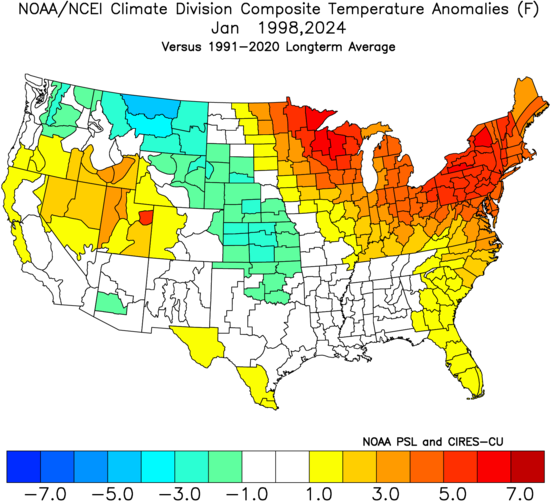
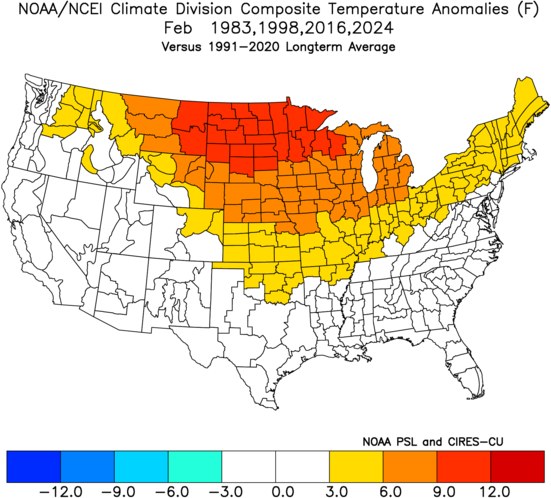
I'm lumping 2023-24 into the group with 1982-83, 1997-98, and 2015-16 given the very strong Nino status (ONI 2.0 in NDJ) and some similarities to the current global pattern (-PDO. Also, given it's the closest year to our newer, warmer trending climate). Here's the temperature anomalies averaged DJF for those 4 winters: It follows a pretty typical Nino look, though I would argue the near to slightly below normal averages in the SE US, and heck even the modest above normal averages in the Mid-Atlantic and Northeast, are skewed by 1982-83, and especially the month of January. Jan 1983 and 2016 were both cold in the Mid-Atlantic and SE US, and like @The Iceman mentioned, we got big dogs both those years: But Jan 1998 and 2024 averaged very warm in the Northeast and Mid-Atlantic: And as far as February goes, most of the strong to super Nino months were warm across the northern tier and cooler in the south. Under the assumption (even if it's unlikely) that the North Pacific doesn't respond to the super Nino (I.e. we have a -PDO into the winter) then 2023-24 would have to be a close analog. Right now, I would lean towards a much warmer January, in the average, similar to 1997-98 or 2023-24. I do not think that the northern Rockies and Central Plains will average cold in January, like those years, but rather will average warm and the Southwest and Southern Plains could be cooler. I'd venture that the warmth extends well up the east coast, unlike 1983 and 2016. Precipitation anomalies are likely to be above to much above normal up the eastern seaboard, with the highest anomalies in the central Appalachians and Southeast US. However, like mentioned in the posts above, there will be a much higher than normal chance for a very big snowstorm. My fear, though, is if the source region for our cold is simply not sufficient enough *when we do get cold northerly flow* for snow down to the coast. It seems like a winter with lots of mix events NW of I-95 and rain more times than not. Should we get a well timed cold blast that's sufficient for snow, then it could be a good one. KPHL snowfall totals for these select years: 1982-83: 37.9 inches (21.3 in the Feb blizzard) 1997-98: 0.8 inches 2015-16: 27.5 inches (22.4 in the Jan blizzard) 2023-24: 11.2 inches KABE snowfall totals for these select years: 1982-83: 45.8 inches (25.2 in the Feb blizzard) 1997-98: 7.7 inches 2015-16: 36.2 inches (31.9 in the Jan blizzard) 2023-24: 25.2 inches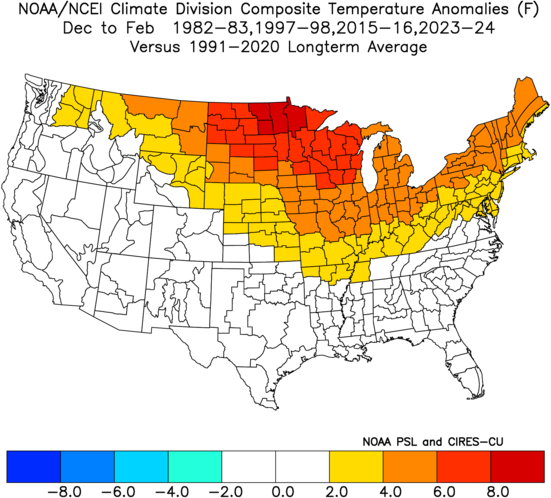
-
E PA/NJ/DE Autumn 2026 Obs/Discussion
Newman replied to PhiEaglesfan712's topic in Philadelphia Region
The big wildcard this winter will certainly be if we can get a few well-timed antecedent cold snaps to align with a big southern stream system! -
E PA/NJ/DE Autumn 2026 Obs/Discussion
Newman replied to PhiEaglesfan712's topic in Philadelphia Region
I think we're on the same page regarding temps and precip and the overall distribution of positive/negative anomalies. I have some reservations regarding some of the climate long range model outputs, at least what they are predicting verbatim right now. The CanSips literally follows a climo Nino winter almost to a T, and I just don't know if I want to throw all my eggs into that basket right now. I guess it's why we don't write winter forecasts in September haha, the atmosphere still has almost 3 months to respond to the current Nino + things will become more clear once wavelengths shorten and the larger Rossby wave train settles into place heading into the late fall. Unfortunately the general public doesn't care if we nail temperature and precip departure forecasts... they care about snow. And that is just so hard, almost impossible, to predict with long lead time accurately without just getting lucky. However, in general, I wouldn't be surprised if the central Appalachians, up through interior portions of the Mid-Atlantic and Northeast, finish above average in snowfall. Coastal plain, NC piedmont, etc could get close to normal once the cold gets more established into late Jan and Feb nearer to the coast. -
E PA/NJ/DE Autumn 2026 Obs/Discussion
Newman replied to PhiEaglesfan712's topic in Philadelphia Region
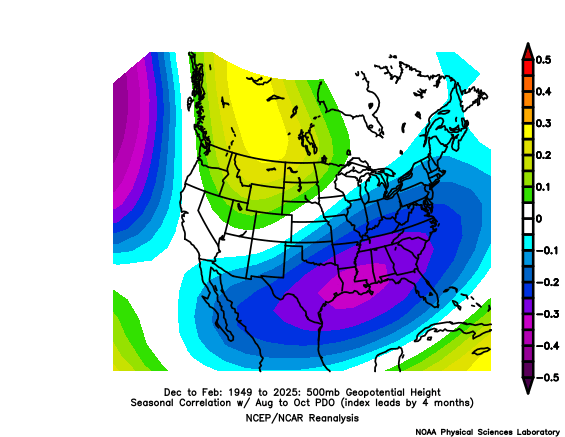
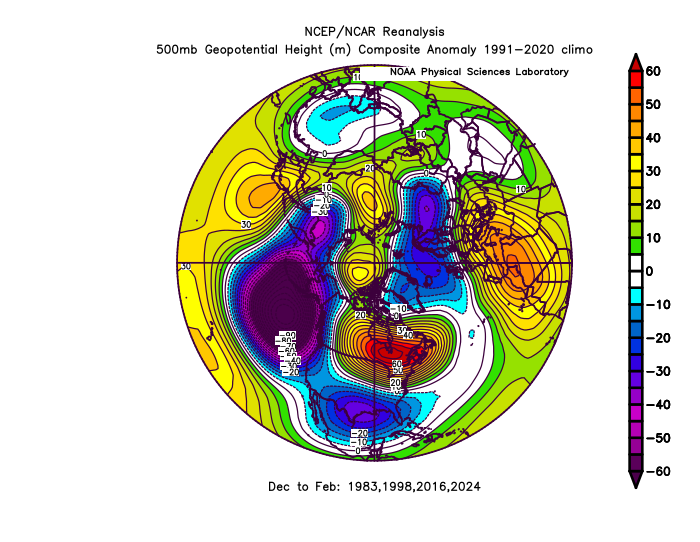
I've honestly not taken much of a long look into the upcoming 2026-27 winter prospects but did take a quick peek at it just now. First of all, as of right now, it seems like the tropical Pacific and North Pacific *appear* to be out of sync and not quite coupled. Obviously we have a super Nino ongoing and expected to peak this fall. We're coming off a very negative SOI in July, I think the lowest since the 1980s. When taking a seasonal correlation of DJF 500mb heights to ASO SOI, you get a pretty canonical look. Positive correlations between SOI and 500mb heights in the SE US, meaning the negative SOI usually correlates to negative heights across the southern US, and then positive heights across the northern tier. However, we may have a competing signal given there is (currently) a lag in response of the PDO to the developing Nino. August PDO is still negative, which is counterintuitive to what you'd expect during a strong Nino. In fact, I simply can't find any year at all that followed a typical ENSO progression to this year (strong to super Nino developing, peaking in the fall, then waning and eventually switching to Nina the following year) and also had a negative PDO. We still have time before winter for the North Pacific to respond, but for posterity, here is the correlation map between ASO PDO and DJF 500mb heights. It's actually a very impressive negative correlation in the SE US, one that is more statistically significant than the SOI signal. The negative PDO usually correlates to positive heights in the SE US (big ridge in the eastern US), and that is opposite to the map above. So that begs the question here... IF the PDO continues to lag into the winter and we have a Nina like North Pacific but Nino tropical Pacific, how will the winter turn out? I'm under the opinion that we will see a North Pacific "coupling" this fall with the tropics, but I'm cautious about it until I see it. We've seen this persistent negative PDO for so long, aided by the marine heat wave off Japan, so idk. Just for further posterity, here is the 500mb height anomalies of 4 super Nino winters we've seen recently, which looks like a pretty canonical Nino pattern in the mean. But with Nina effects lingering, will we see a similar pattern this year? Long winded thoughts, but my idea this winter is a pretty torchy start into December and early January. We might see some brief negative NAO spikes by late Jan and Feb which is when we'll need to time an active STJ storm with an arctic front that's pressed off the coast. Even if not, probably some chances for cold spells. I'm also not a long range forecaster so take everything with a grain of salt LOL @GaWx What are you thinking/seeing for this winter in the East?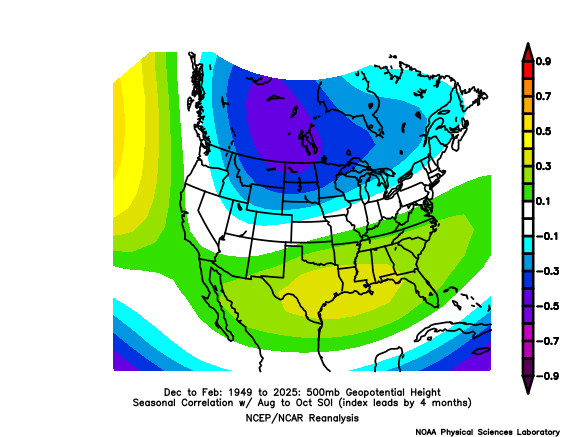
-
Some real bad flash flooding going on in that training band on the south side of Edouard. Radar estimates of up to 8" of rain in just the past 3 hours. Nearly 12-16" of rain total
-
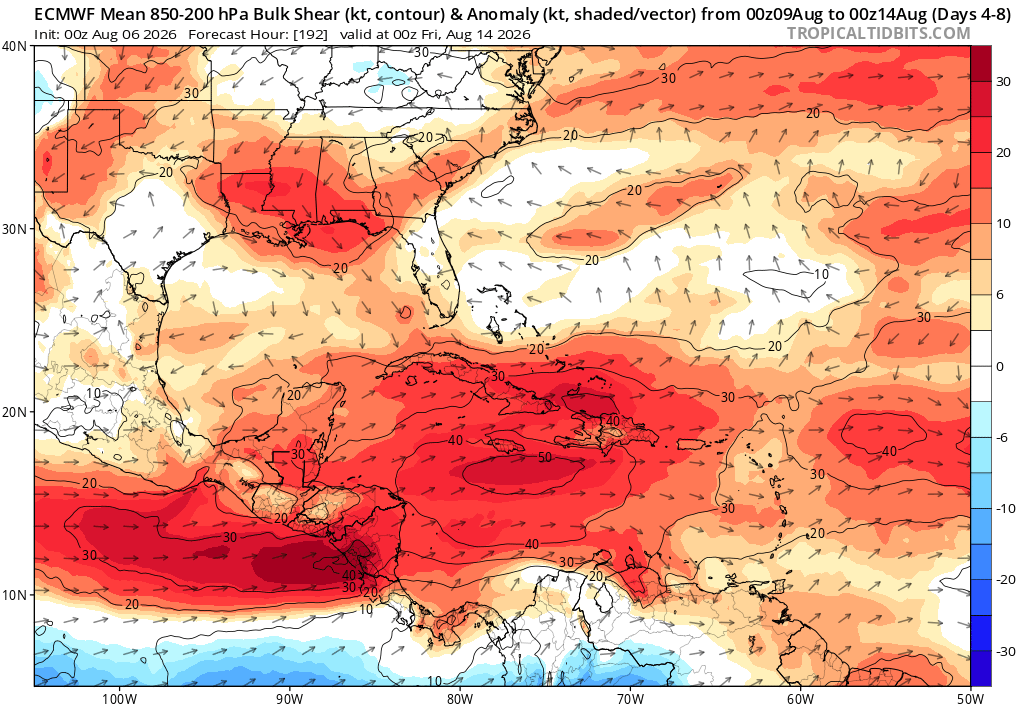
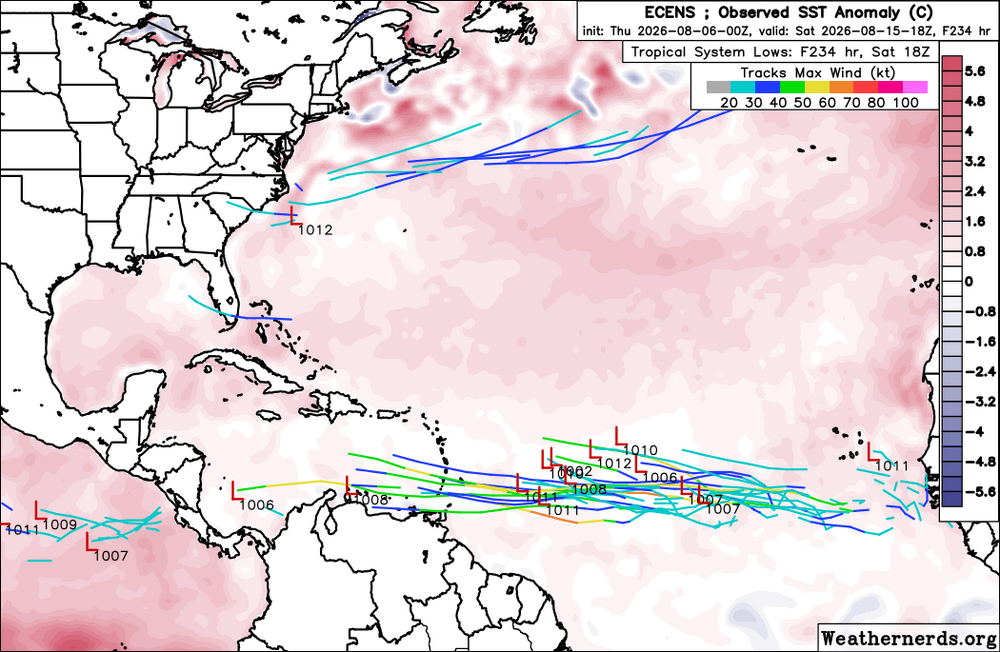
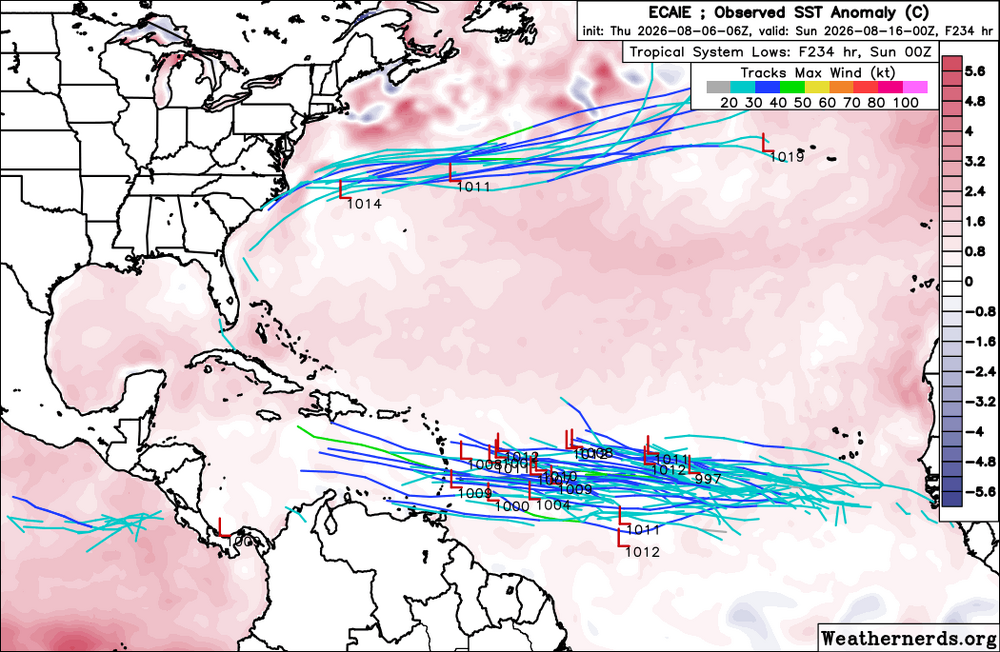
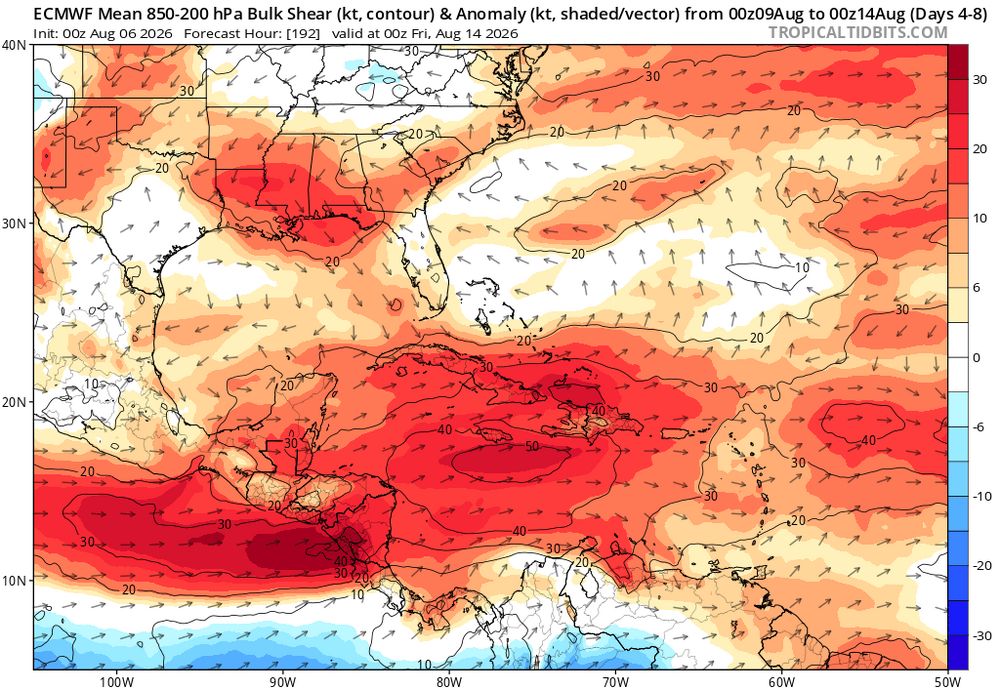
Euro and EuroAI ensembles both hinting at some development towards the end of next week with the next wave moving off Africa. Conditions will be very hostile in the Caribbean, as one would expect in a Nino year. Should a brief TS develop, it won't last past the Lesser Antilles. Not much going for the Atlantic.
-
E PA/NJ/DE Summer 2026 Obs/Discussion
Newman replied to PhiEaglesfan712's topic in Philadelphia Region
You're going to love it out there. Wide open spaces to your east, mountains to your west. I loved my time living just north of Denver in Wyoming, the high plains chasing is unmatched! I am also set to be moving back west in less than 2 months to join the NWS at one of the offices out there. -
E PA/NJ/DE Summer 2026 Obs/Discussion
Newman replied to PhiEaglesfan712's topic in Philadelphia Region
Tornado warnings popping off in NE PA. Supercell trying to develop in Berks right now -
E PA/NJ/DE Summer 2026 Obs/Discussion
Newman replied to PhiEaglesfan712's topic in Philadelphia Region
"The leading edge of a 50 knot mid-level jet (centered around 5-6km) has been sampled by the CCX VWP within the last half an hour. As this overspreads the warm sector, shear will be in place for storm organization, including supercells. Damaging winds will be the primary threat, but some large hail and a few tornadoes will also be possible. The greatest threat will be across southeast Pennsylvania and New Jersey, where the greater instability is in place. However, as the warm front lifts northeastward, the threat could extend into southeast New York and Connecticut this afternoon."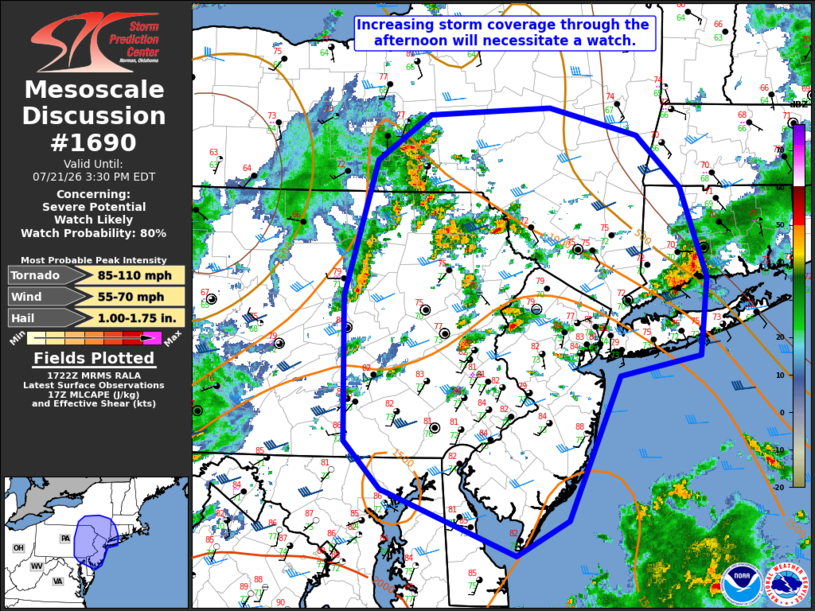
-
E PA/NJ/DE Summer 2026 Obs/Discussion
Newman replied to PhiEaglesfan712's topic in Philadelphia Region
All of the parameters are solid across eastern PA right now and will probably keep improving through the afternoon. But, just like Saturday, there just seems to be too much going on. Will see if that activity in western PA is able to tap into the favorable environment in eastern PA or not, the cloud coverage is really suppressing low level lapse rates rn. Which is ironic because mid level lapse rates, which are usually paltry, are great. -
E PA/NJ/DE Summer 2026 Obs/Discussion
Newman replied to PhiEaglesfan712's topic in Philadelphia Region
Once again we failed because 1. Early morning WAA crapvection and 2. Too much forcing for ascent driven by a strong synoptic system, which ultimately leads to clusters of storms every which way simply occupying the same spaces. It's the same problem we had with the Moderate Risk bust a few months ago. Too much convection. -
E PA/NJ/DE Summer 2026 Obs/Discussion
Newman replied to PhiEaglesfan712's topic in Philadelphia Region
That activity will more likely than not become outflow dominant by the time it reaches the Lehigh Valley. Maybe some embedded spinners, but more likely a damaging straight line wind threat -
E PA/NJ/DE Summer 2026 Obs/Discussion
Newman replied to PhiEaglesfan712's topic in Philadelphia Region
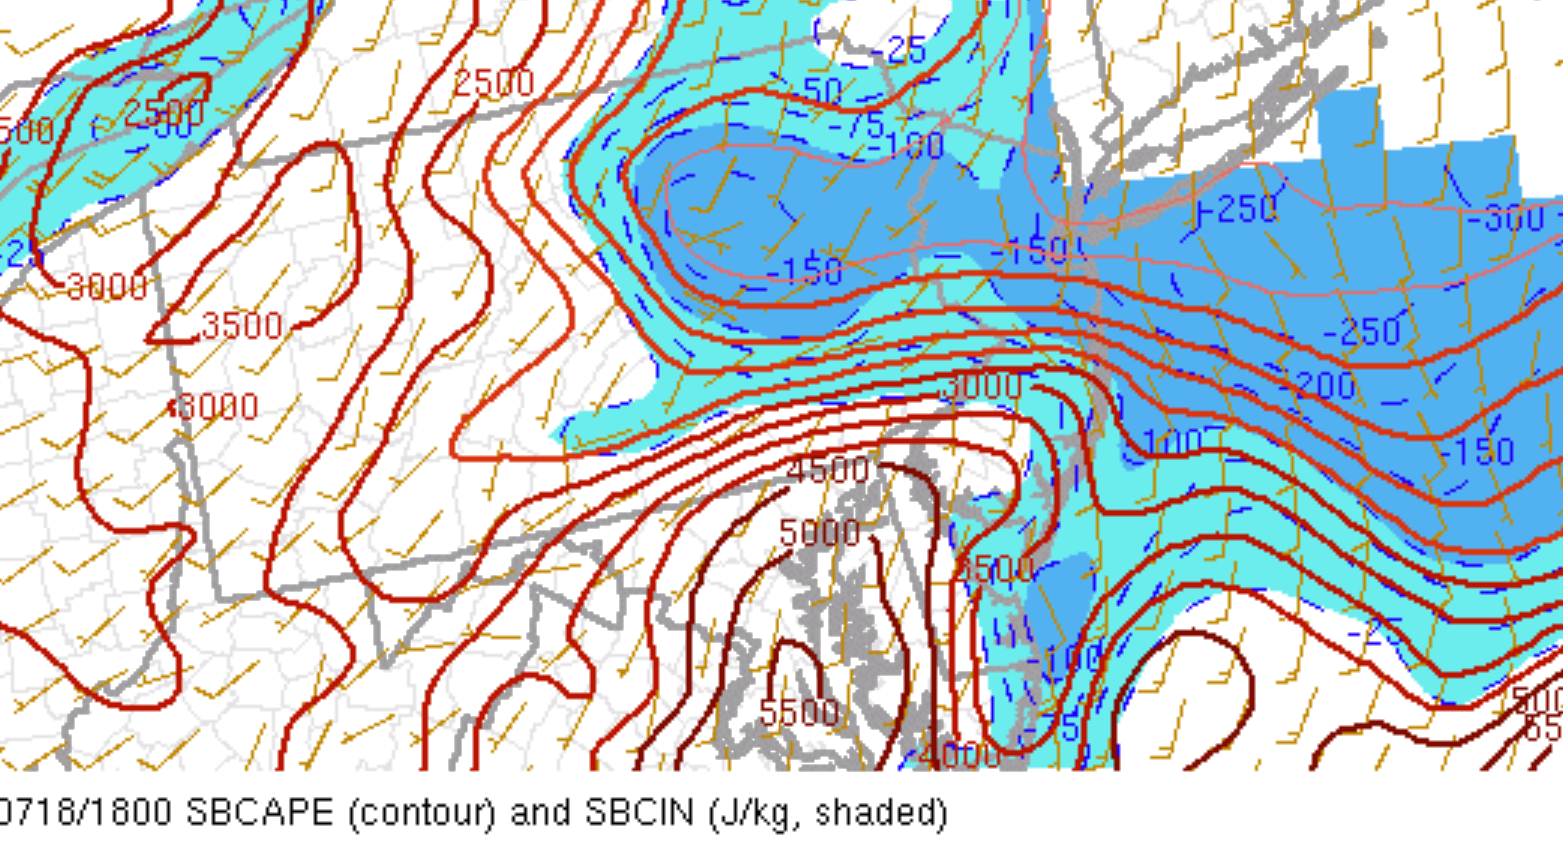
3000 MLCAPE/5000 SBCAPE creeping into Philly now. Low level lapse rates also finally looking somewhat decent too. -
E PA/NJ/DE Summer 2026 Obs/Discussion
Newman replied to PhiEaglesfan712's topic in Philadelphia Region
You can find the warm front pretty clearly on the latest 18z SBCAPE mesoanalysis. Surface obs are also evident... middle 80s in York, southern Lanco, Philly right now, but low to middle 70s still across the rest of SE PA. I do think this warm front will continue to lift northward but I don't have much confidence in how much in the next 3-4 hours. Some of that messy cloud debris near Harrisburg appears to be thinning out as it slides eastward, and we're getting more sunshine across the Lehigh Valley... All of that to say I think the Trenton/KOP/Philly area will maximize instability and low-level shear just south of the warm front. We shall see...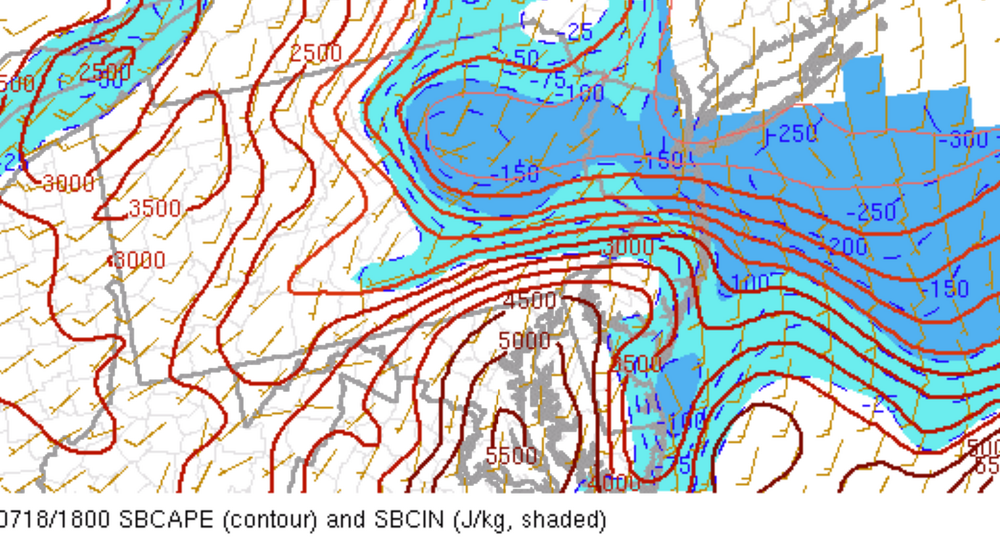
-
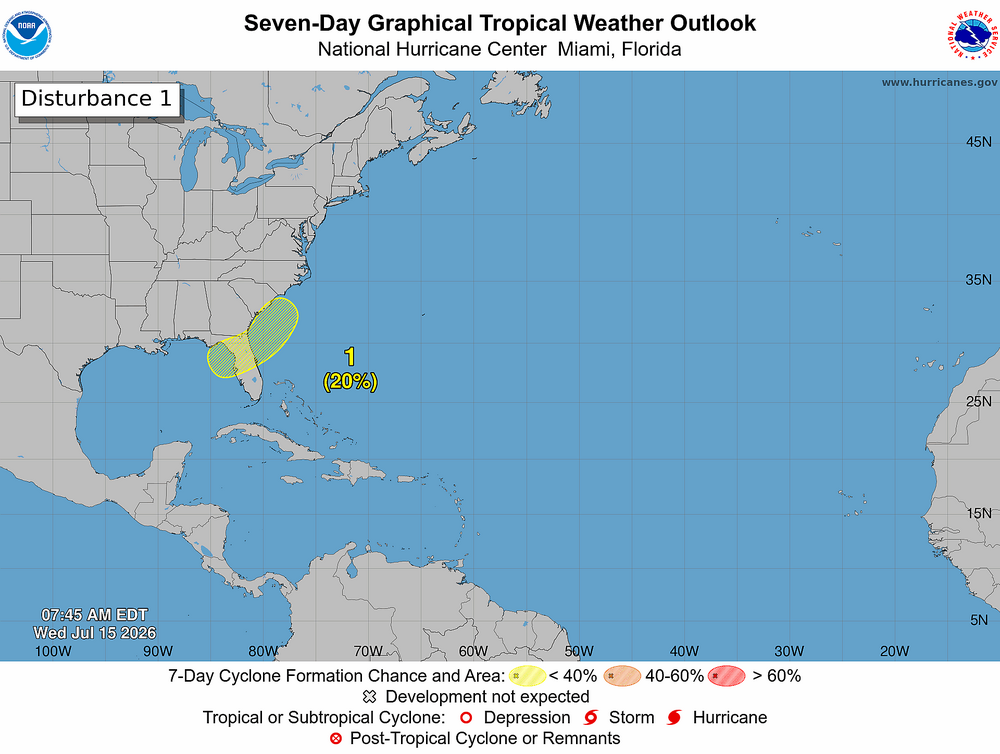
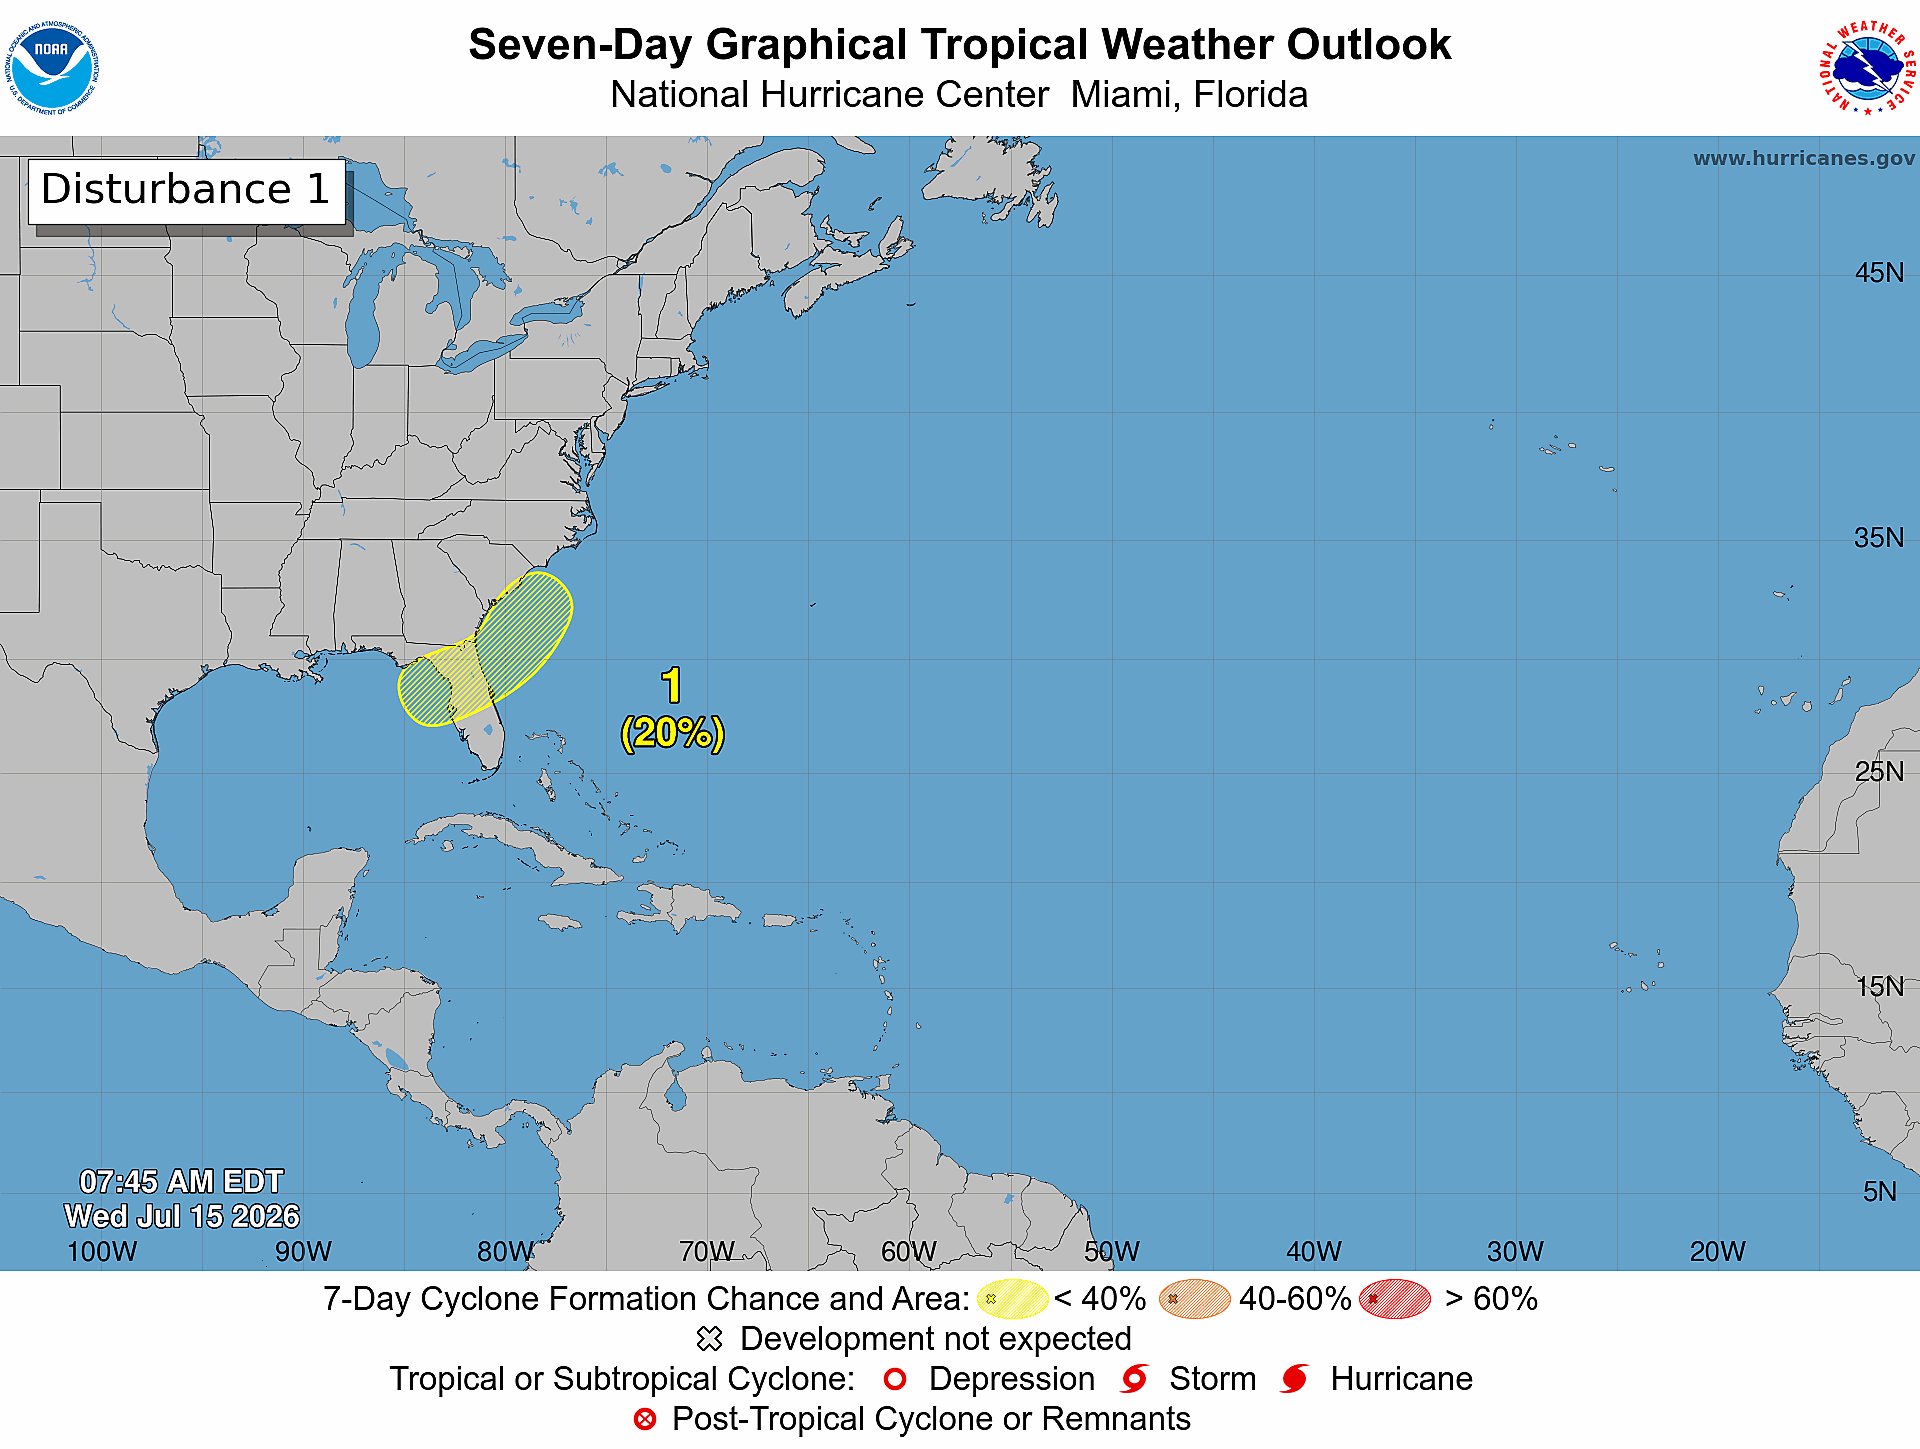
Satellite and radar imagery definitely getting that "look" west of Florida with the MCV that is moving offshore. Mid-level rotation quite evident. NHC bumped odds up to 10/30 at 2PM. 12z Euro, GFS, Euro-AI all pinwheel this area of vorticity northward tomorrow up the West Coast of Florida
-
The trough in the east should quickly pull whatever develops down here northward. Maybe 1-1.5 days over water in the northeastern Gulf
-
Northeastern Gulf of America: An area of low pressure is expected to form during the weekend over the northeastern Gulf of America. Subsequent slow development of this system is possible while it moves slowly northeastward over the northeastern Gulf and or near the southeastern coast of the United States by early next week. * Formation chance through 48 hours...low...near 0 percent. * Formation chance through 7 days...low...20 percent.