Scarlet Pimpernel
-
Posts
7,815 -
Joined
-
Last visited
Content Type
Profiles
Blogs
Forums
American Weather
Media Demo
Store
Gallery
Everything posted by Scarlet Pimpernel
-
Now...imagine if it were a large forest of cannabis plants that was burning, how would we all feel?
-
A bit like Andy Dufresne (in "Shawshank Redemption"...one of my favorite films!) crawling through 500 yards of sh*t-smelling foulness I can't possibly imagine!!
-
Agree. Things change, and improved knowledge (and medical understanding/advances) can help save lives and/or keep you from getting sick or adversely affected. I've never been a fan of the "we never whined about such-and-such and came out OK, now everyone's a wimp!" attitude (when in fact many people did NOT come out so OK). Yeah, some complaints about "how difficult it is" that I hear on minor or more trivial issues makes me roll my eyes, but in general, I totally get it. As for the conditions today, it's totally ugly out there. You can literally smell the smoke and feel it in your eyes and sinuses. Remarkable how the visibility is notably lowered too. Thank goodness I didn't have to be out for any length of time in this. I'm not sure how this compares to a couple of years back when we had a similar event with wildfire smoke that got into this area. Regardless, it's pretty bad.
-
Ugh, that June 2012 derecho event was awful! It was over 100 degrees that day and still at or near 100 into the evening right before the blast hit. Knocked our power out for 2-3 days solid which was miserable because the following days were still in the upper 90s. During Sandy we didn't have a power outage (or perhaps very briefly, can't recall exactly?) even with the more consistent winds. There was better prep during Sandy for sure as I recall...but also, the derecho ironically cleared out a fair bit of older trees/growth so that by October there wasn't as much to fall or get uprooted. (ETA: Interesting tidbit about the derecho event. Didn't get a lot of rain from that where I was, it was primarily a literal blast of wind in a concentrated amount of time. And there was a TON of lightning.)
-
Yup, and don't even get me started, LOL!! I had to seriously restrain myself from making too "overly political" of a comment with my DOGE remark! But damn, I have been utterly pissed off (and worried) the past year and a half, it's hard NOT to make at least some reference to the reality going on.
-

Big Heat (and storms?) Week into July 4th Weekend
Scarlet Pimpernel replied to yoda's topic in Mid Atlantic
Don't give them any ideas! -
Big Heat (and storms?) Week into July 4th Weekend
Scarlet Pimpernel replied to yoda's topic in Mid Atlantic
Personally, I can't stand extreme heat and consider it a "win" if we can avoid a ton of mid-upper 90s or 100+ degree days in any given summer! Hell, last August was about one of the most pleasant Augusts I can recall in this area, in a summer that wasn't overly insufferable. -
But...DOGE-ball is oh so much fun (not)!!!
-
Thanks for confirming that, I was just checking in here to see if anyone else noticed forecasts aren't loading and haven't all day thus far. Even when I can get to LWX's main site or the weather.gov main site (after a bit of a wait), the point-and-click for a location just sits and spins. I thought there was some issue with my wi-fi, but no other sites I visited had any issues. Wonder if they're getting hit with a ton of traffic due to the upcoming heat this week.
-
And...Happy Birthday to you @mappy!! I didn't realize your birthday and @stormtracker's were on consecutive days!
-
Didn't realize it was his birthday! Happy Belated, @stormtracker!!!
-
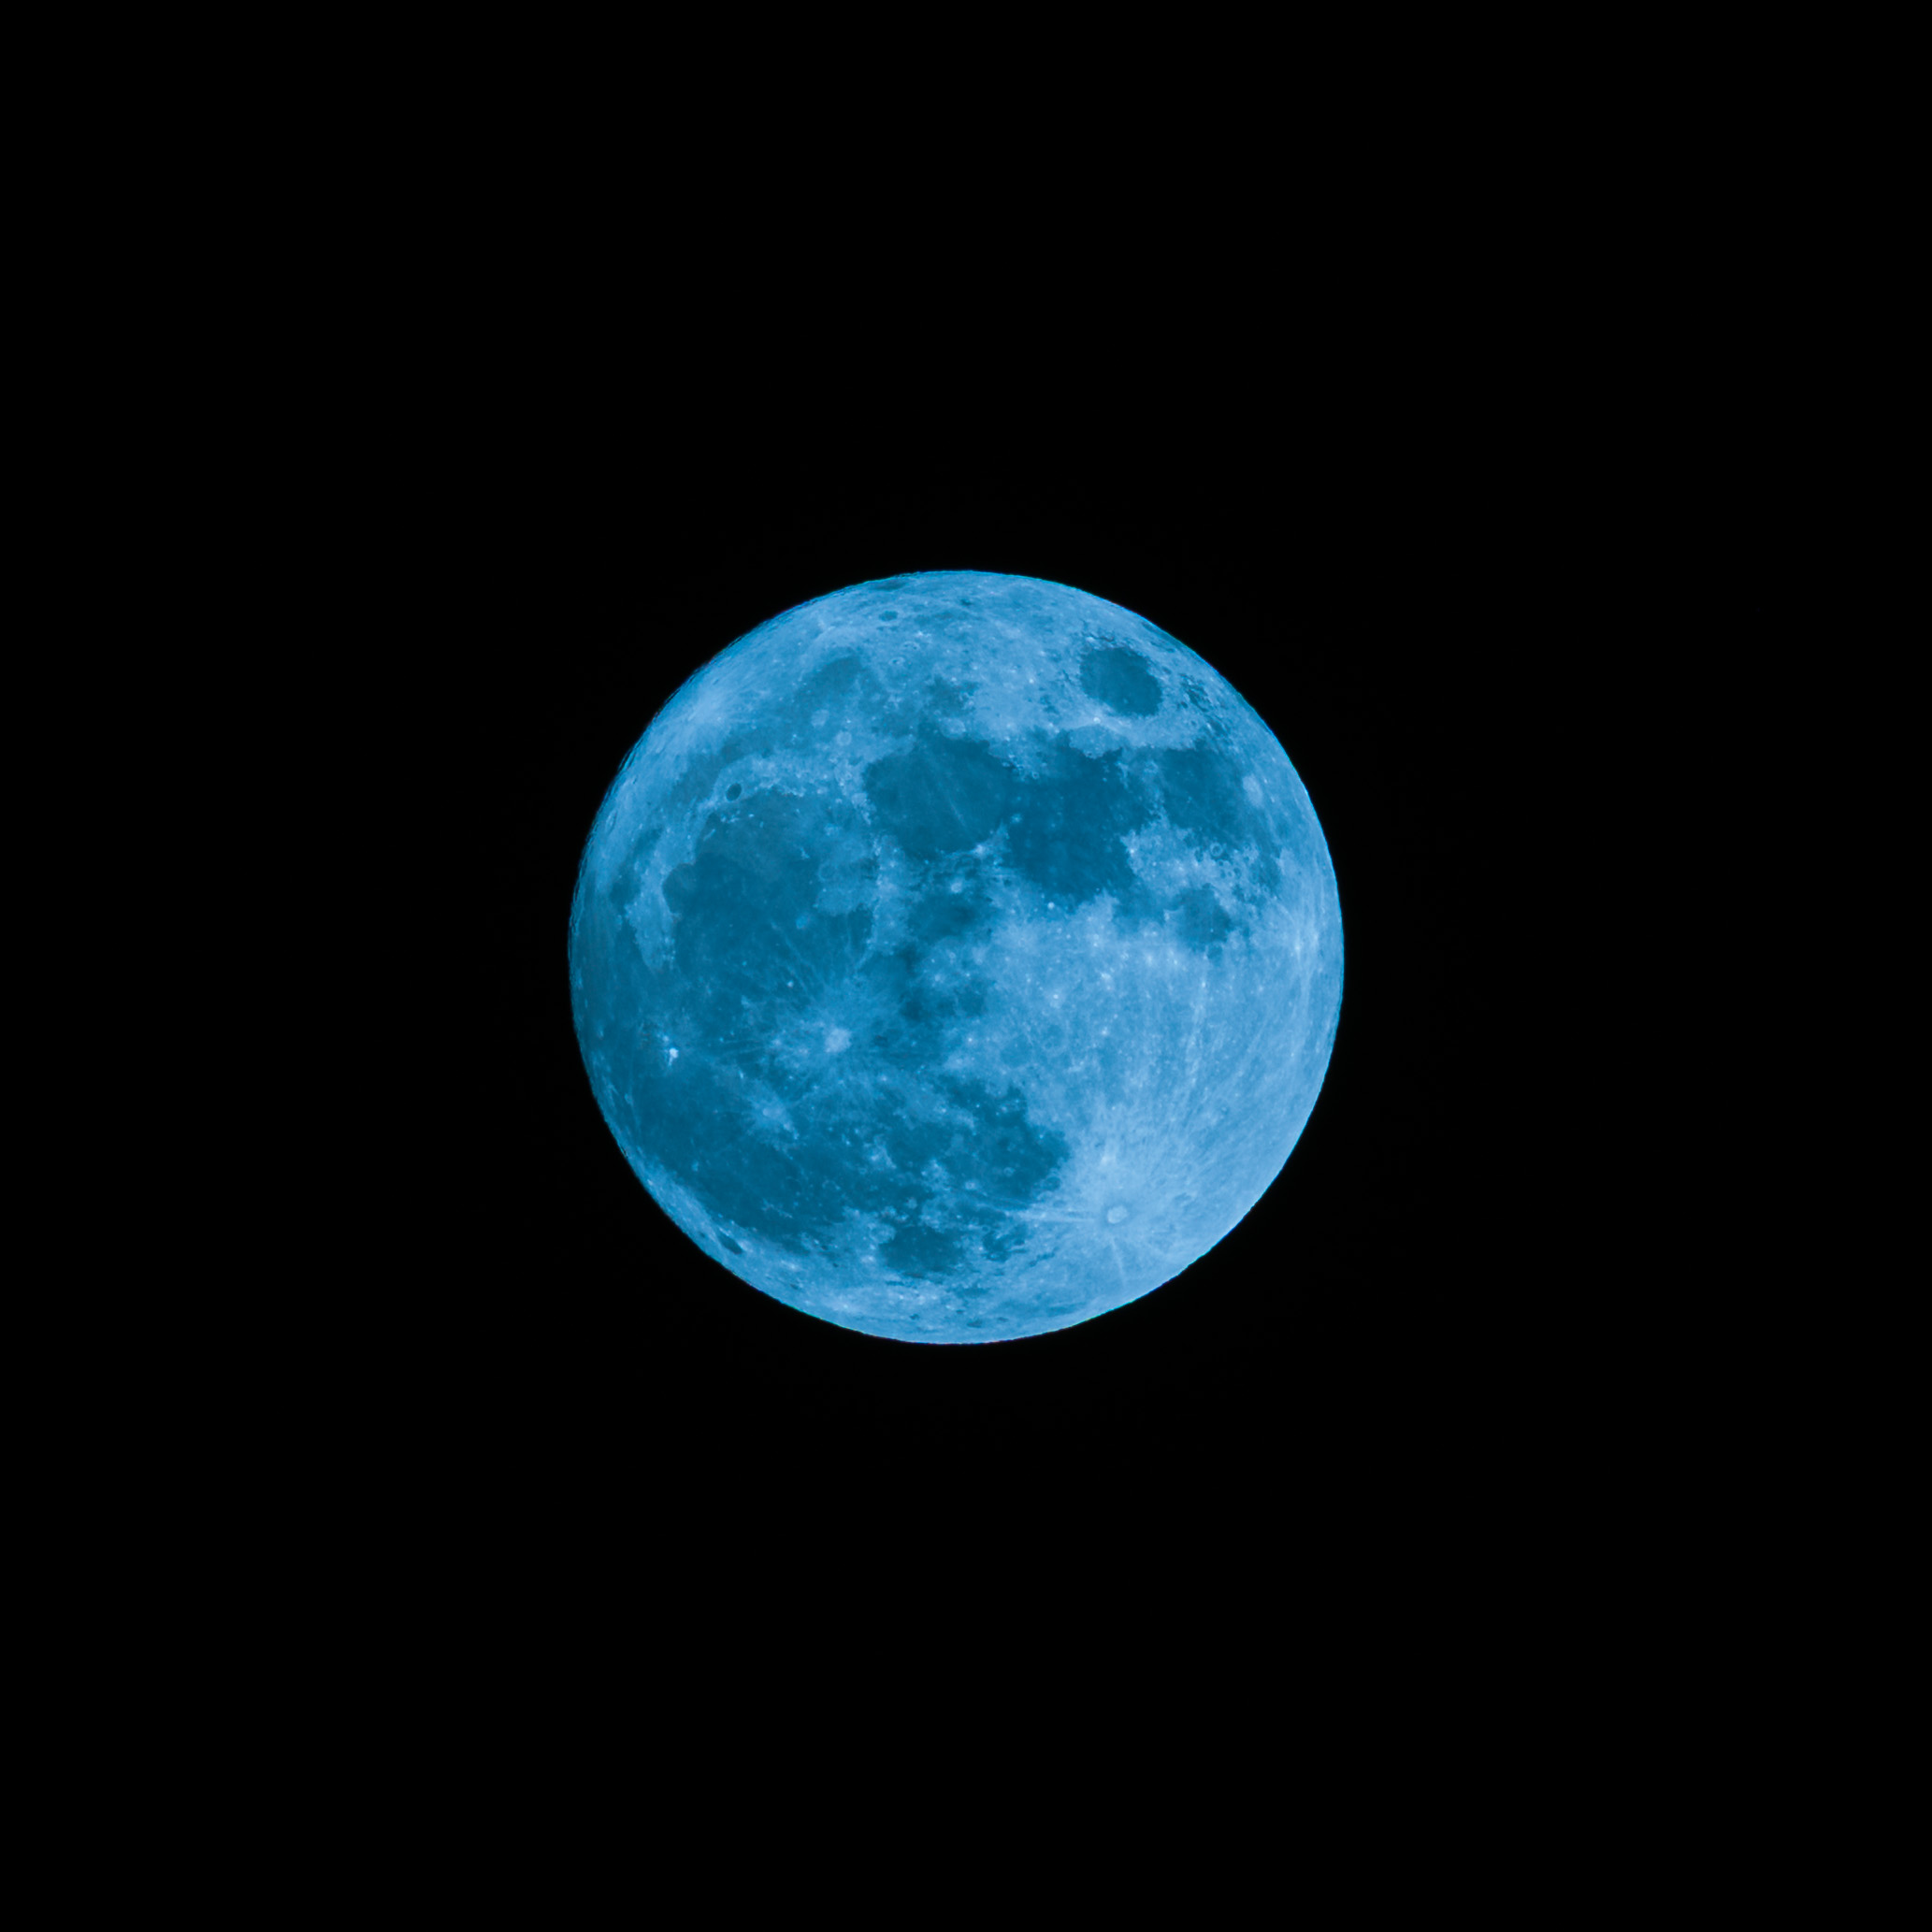
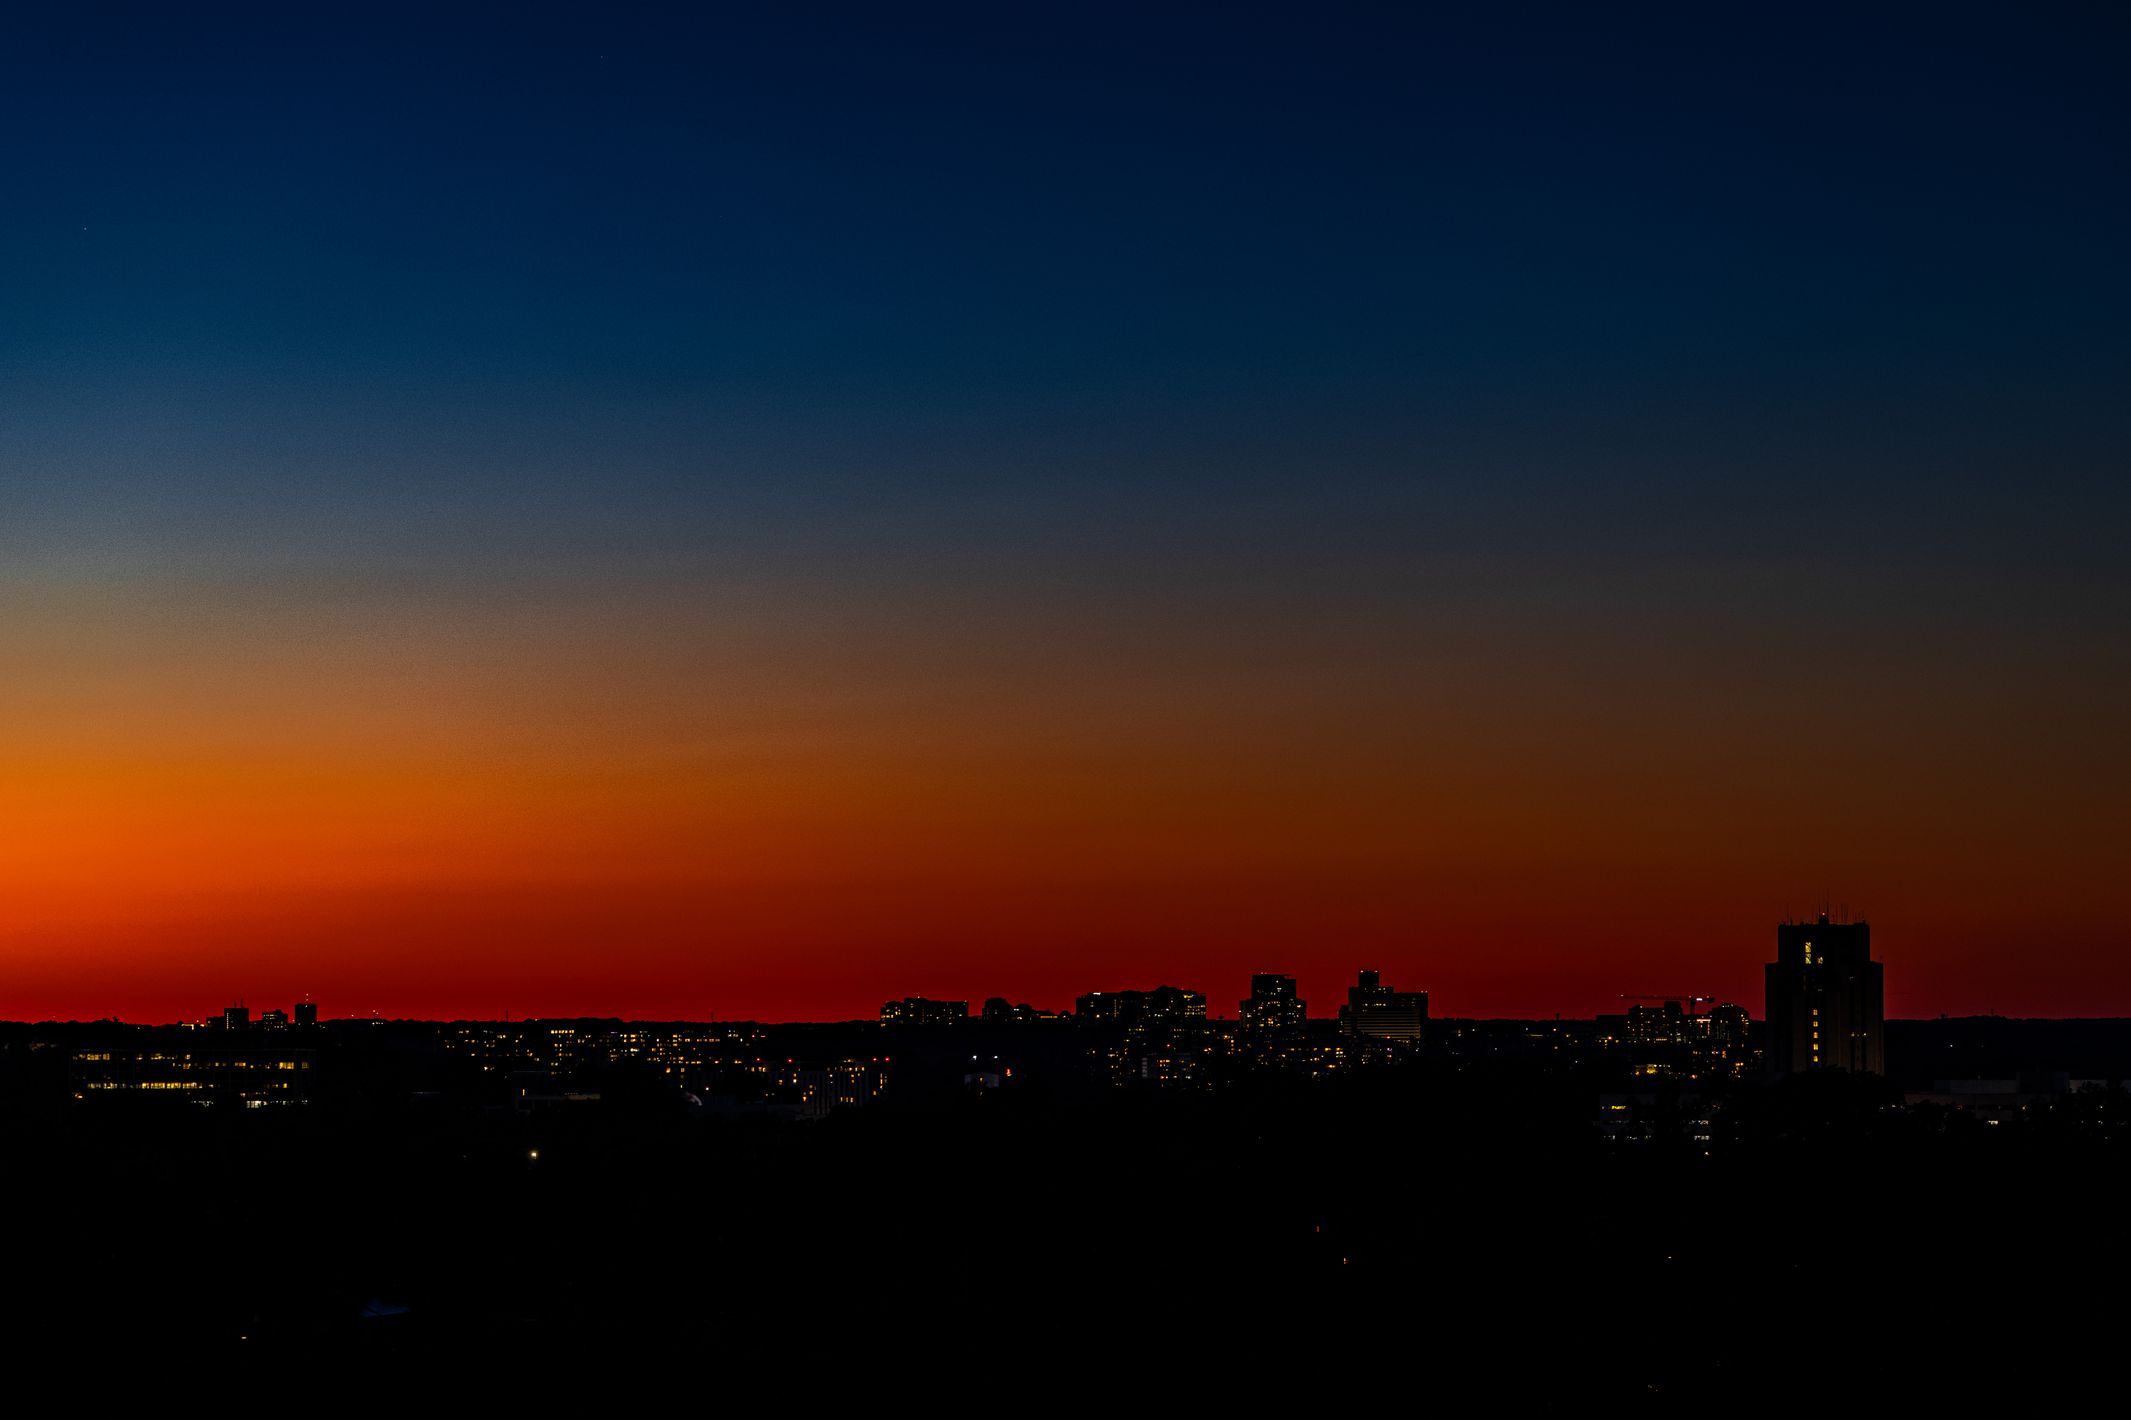
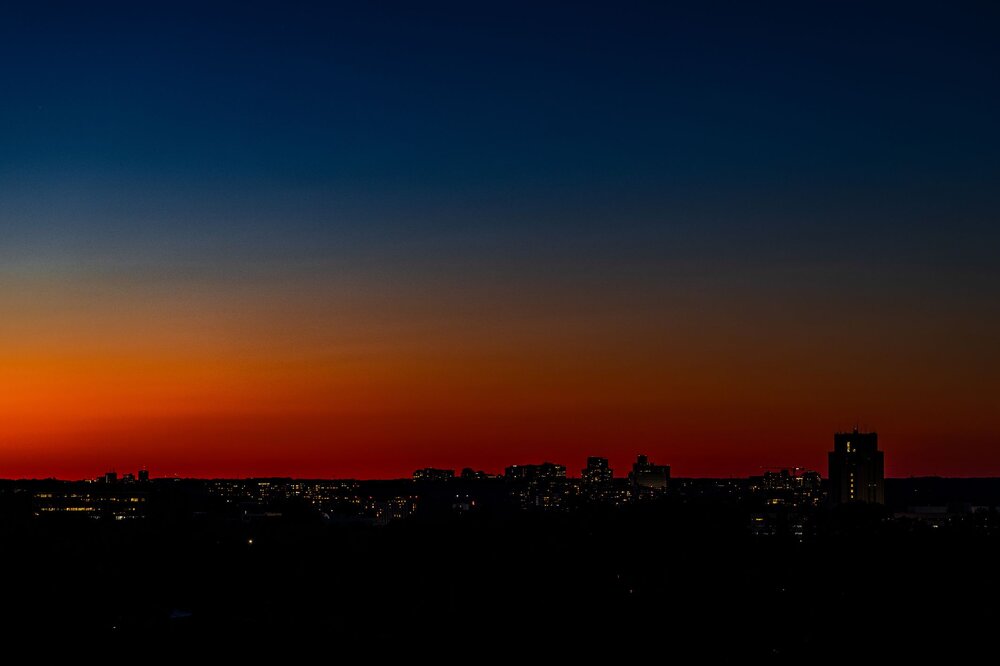
Took this photo of the "blue moon" this past weekend (2nd full moon in May). Altered the white balance and added some blue tint to make it a "blue" blue moon!! Also, same evening, some remarkable sunset glow to the north (looking toward Rockville, for those in the MD/DC/VA area).

- 177 replies
-
- 10
-

-
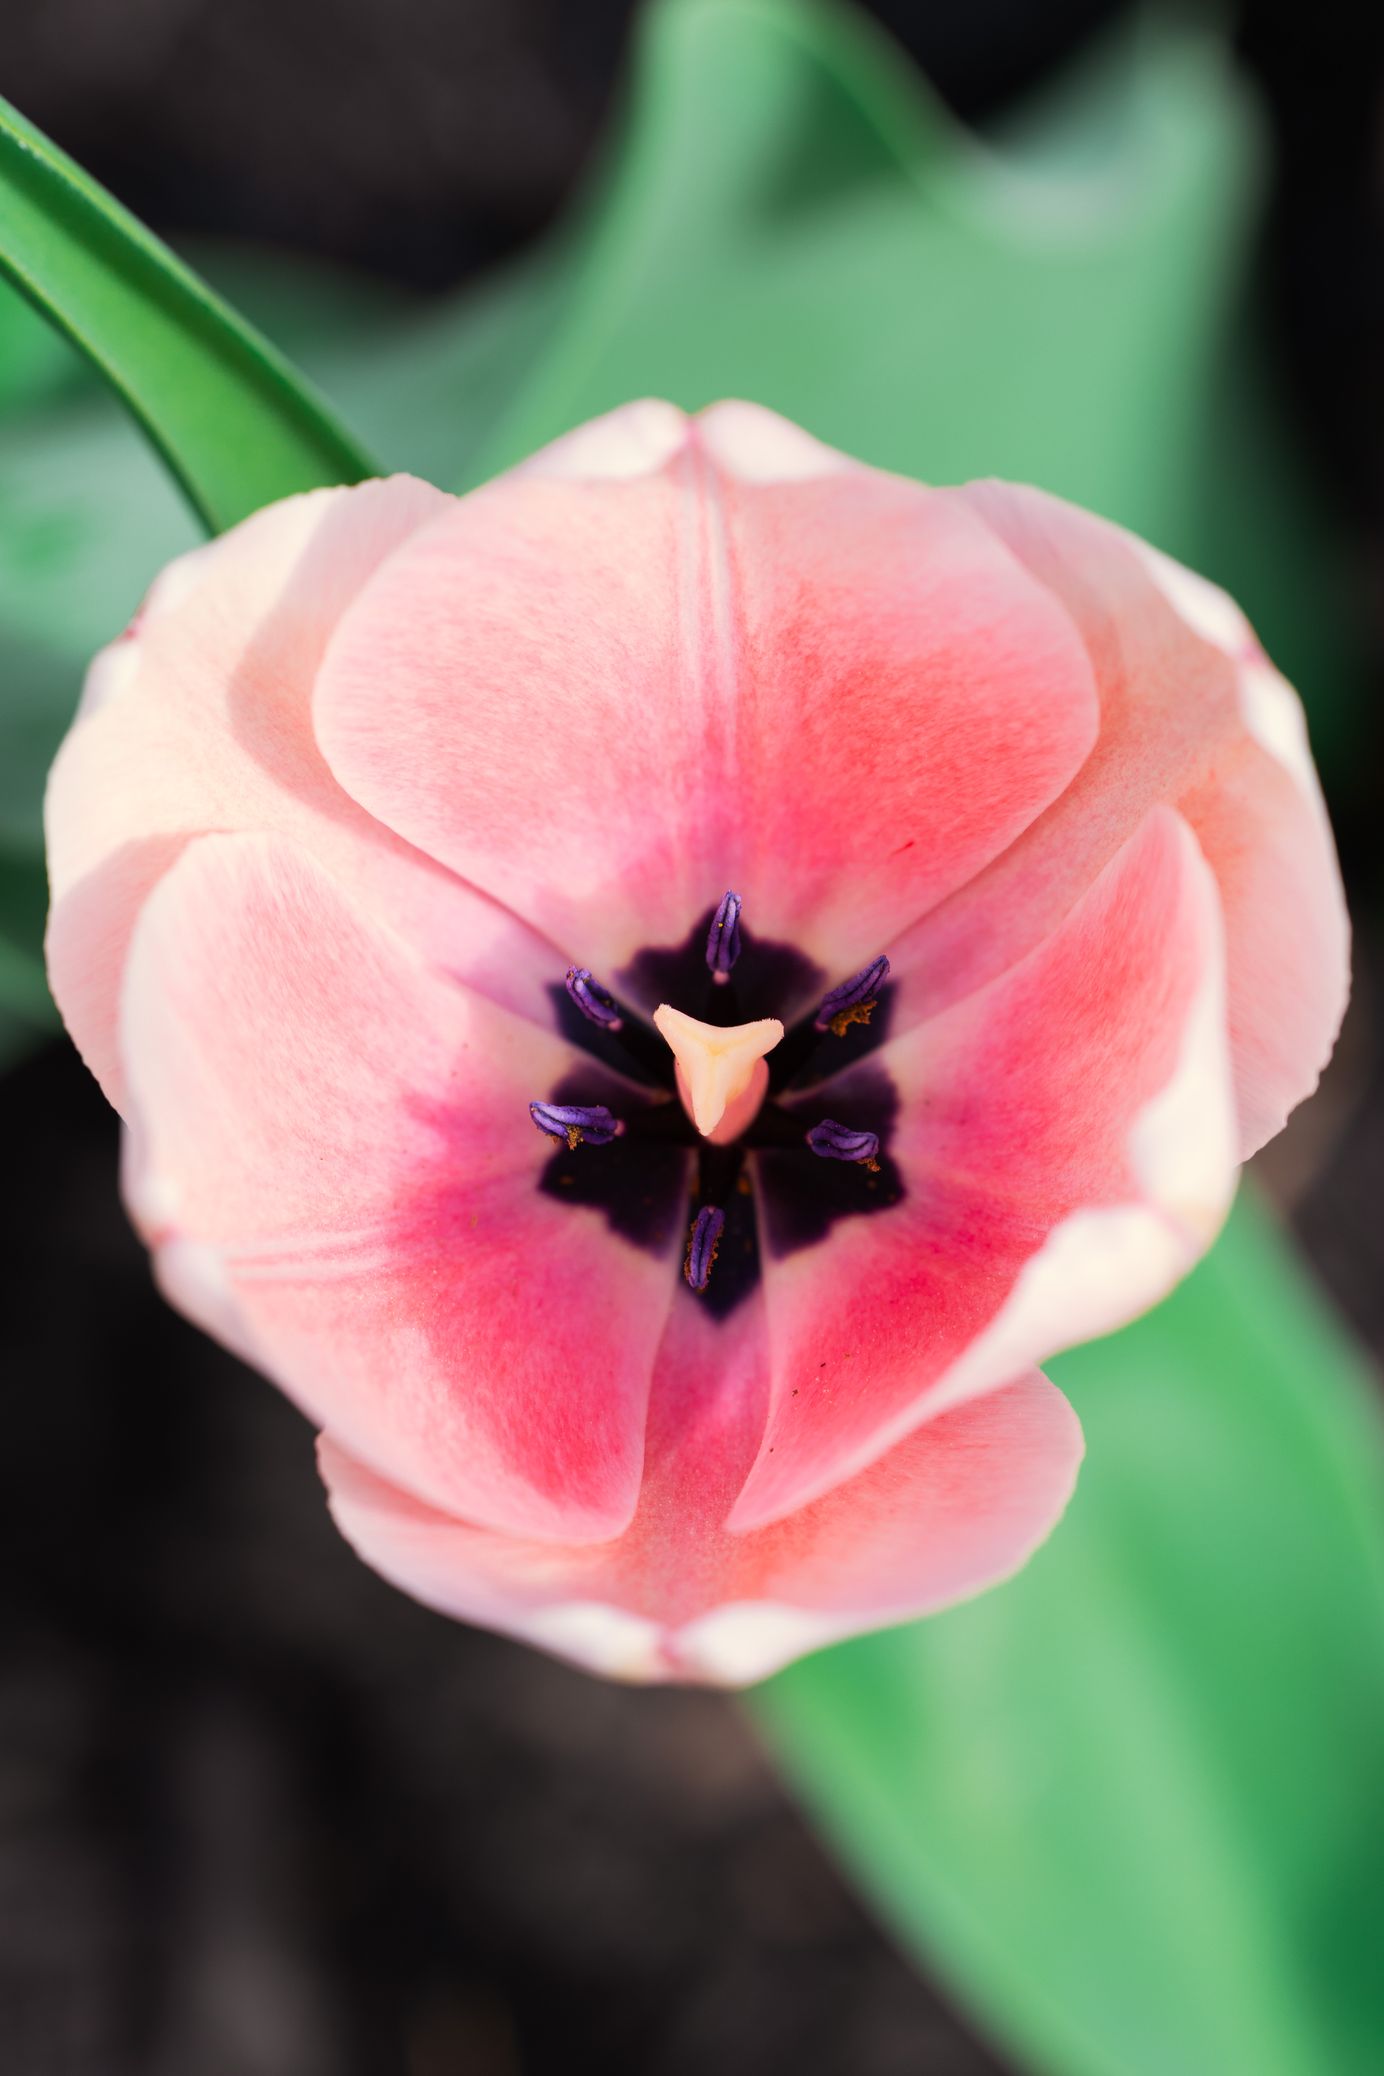
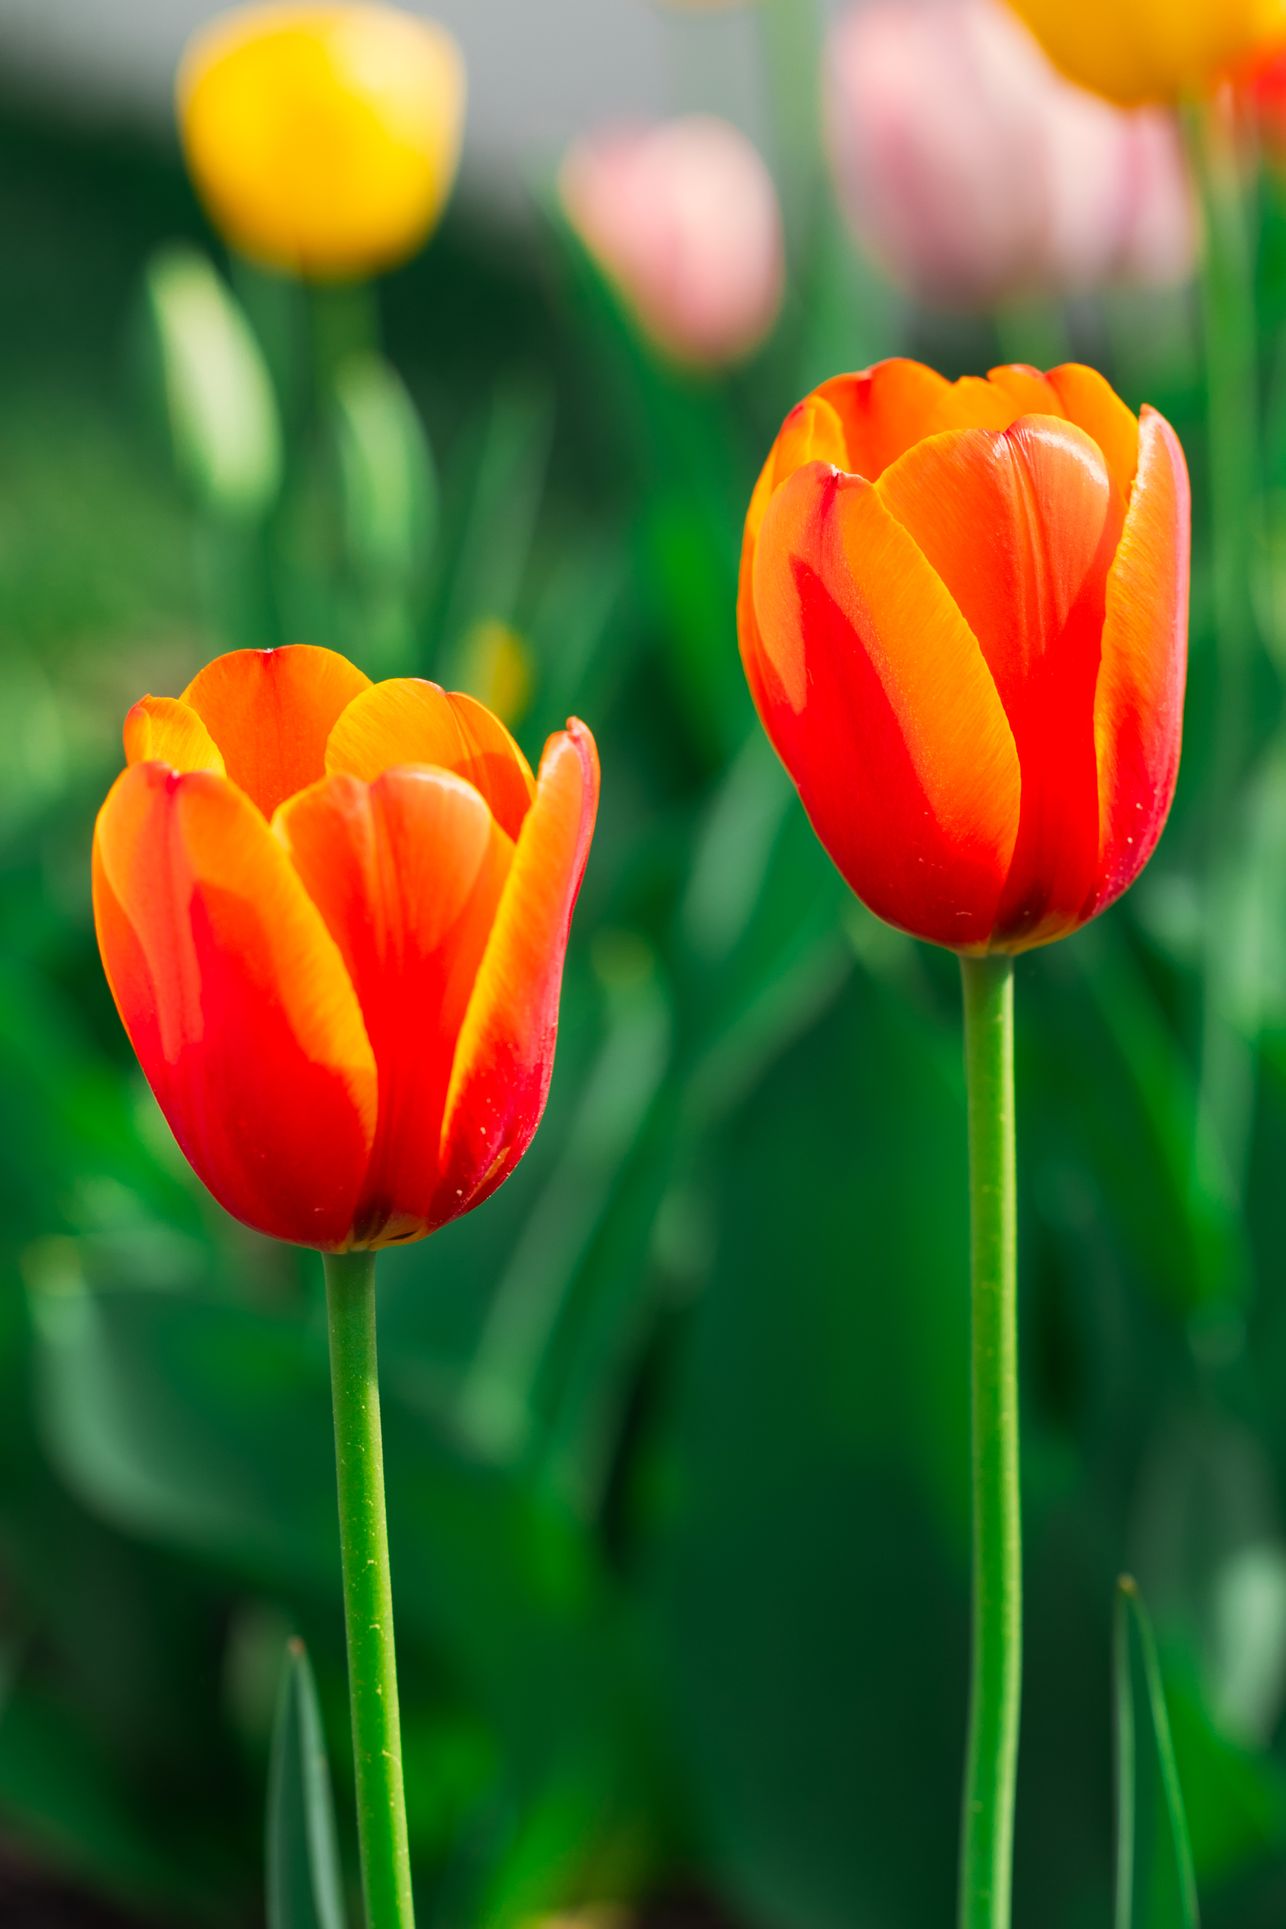
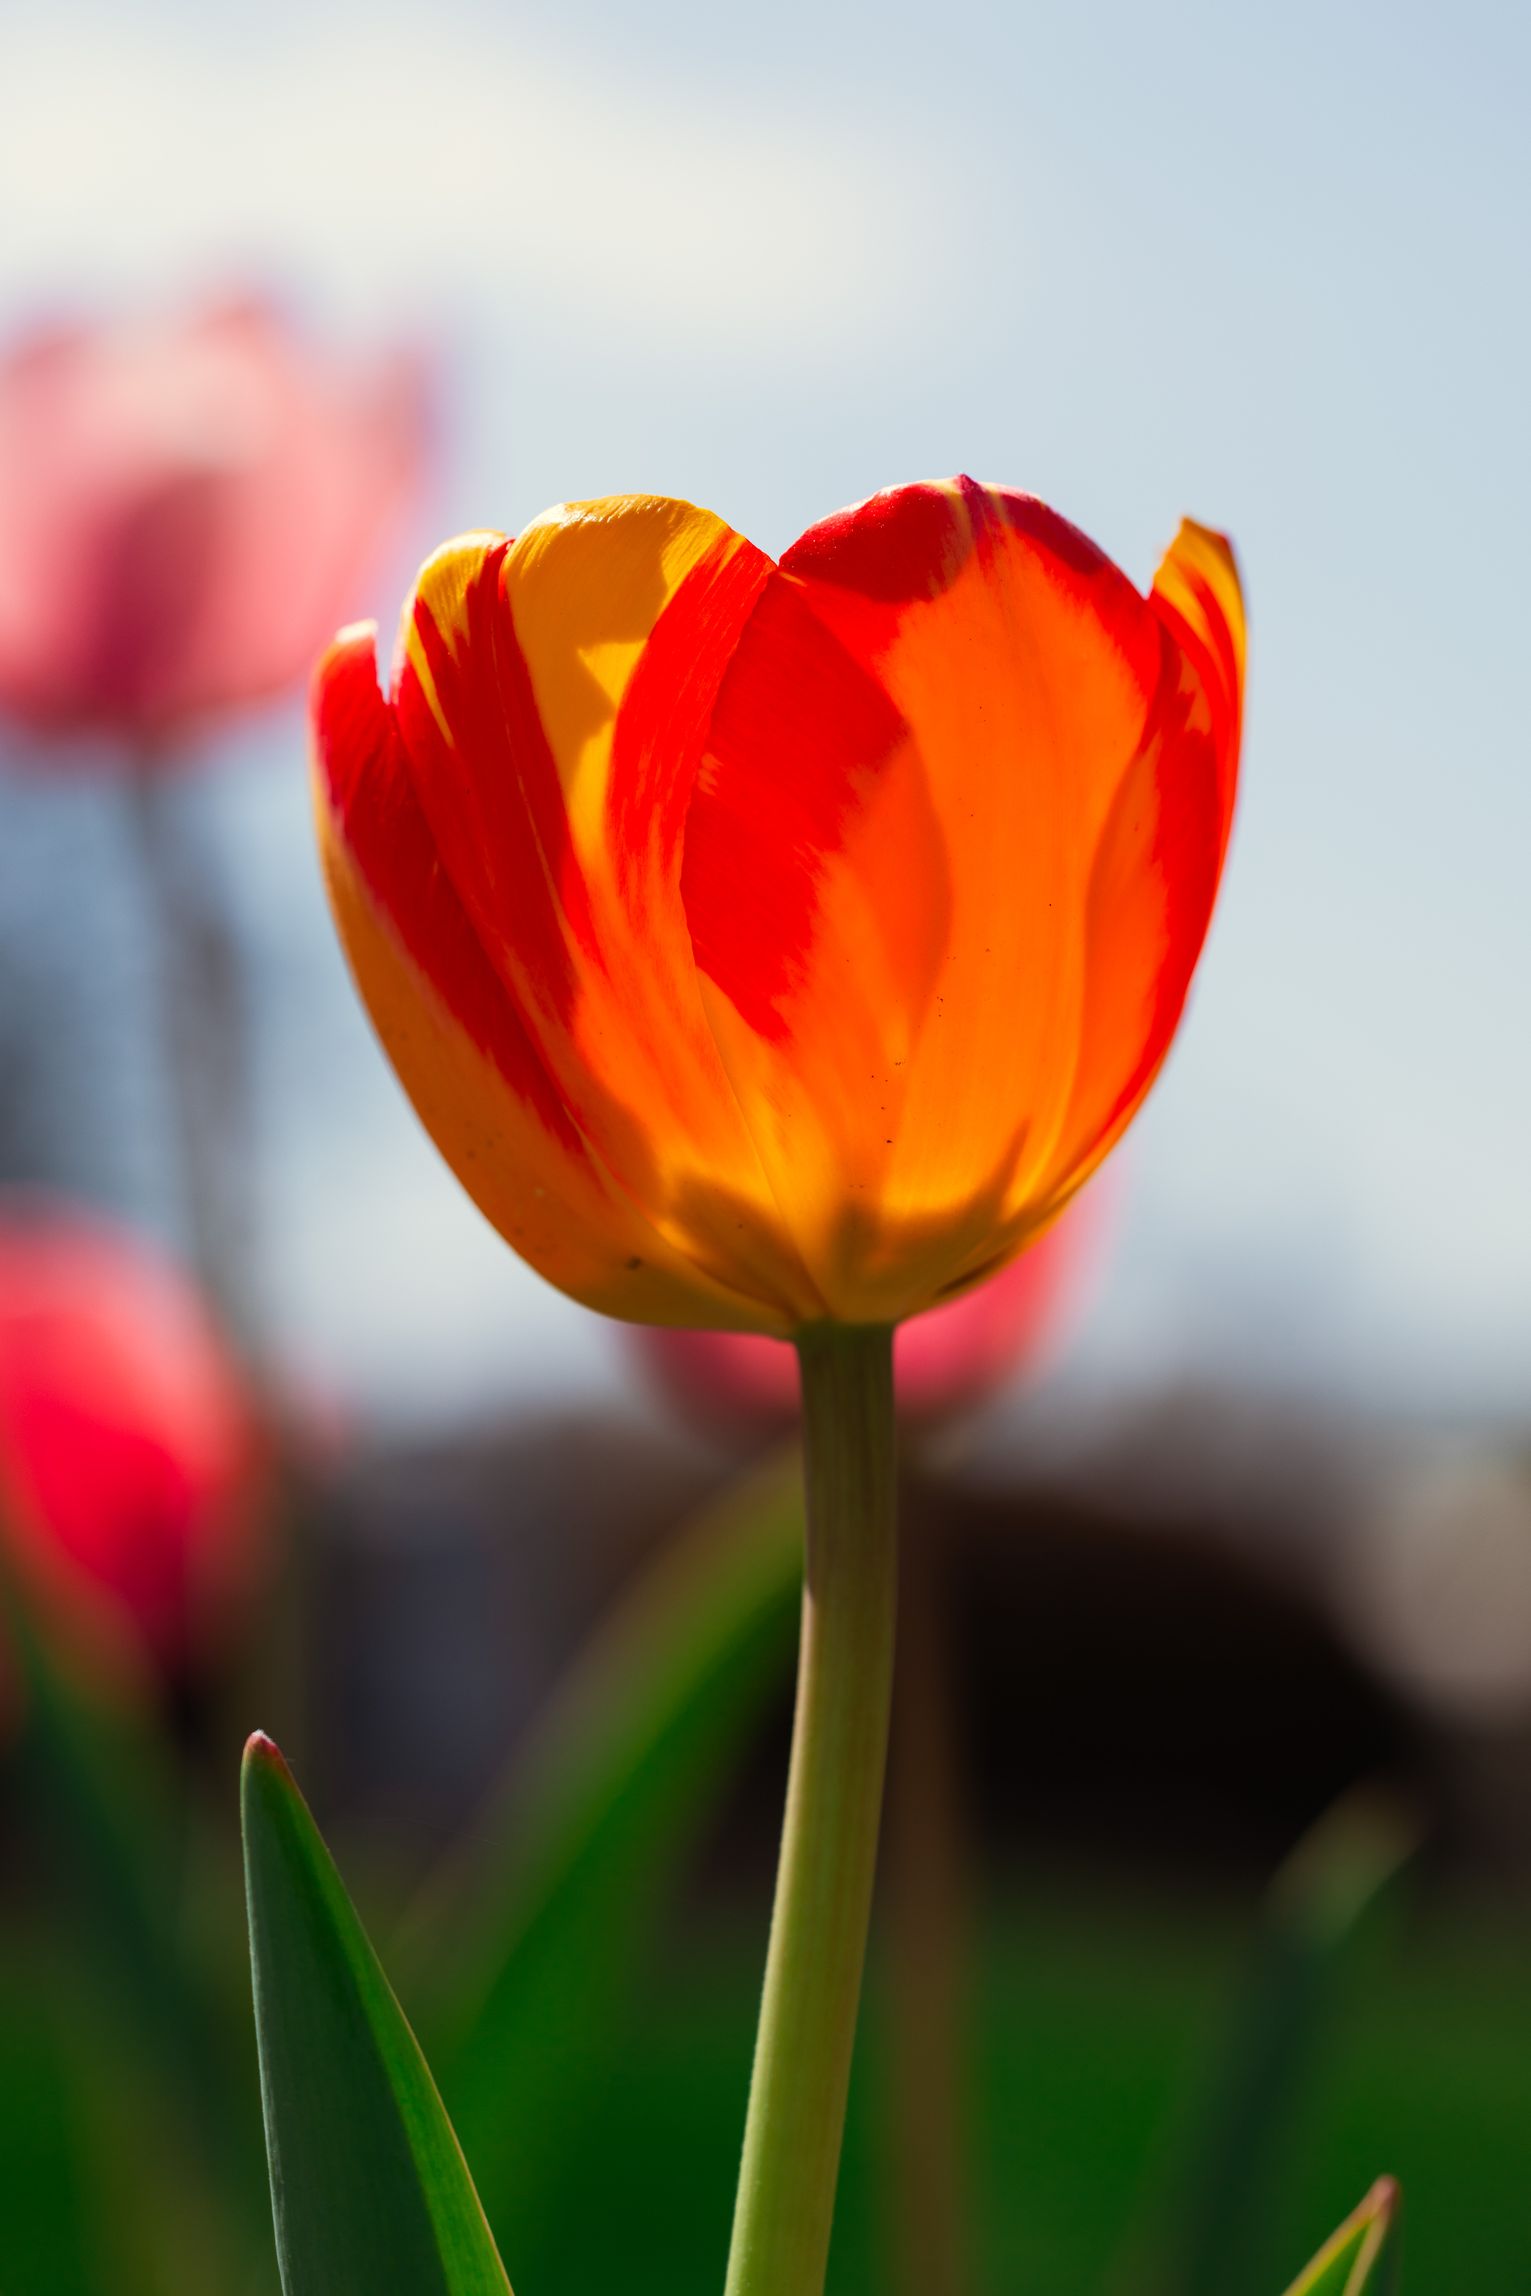
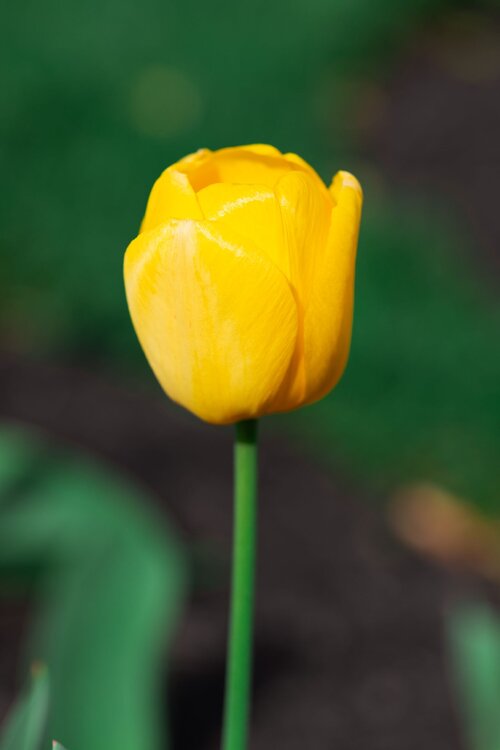
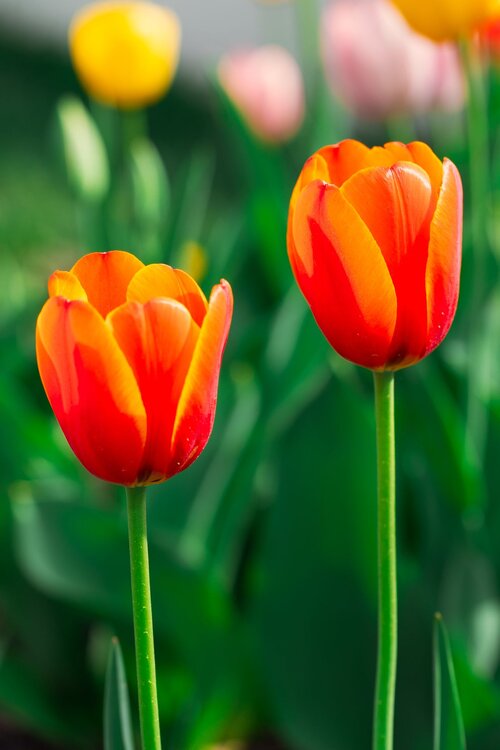
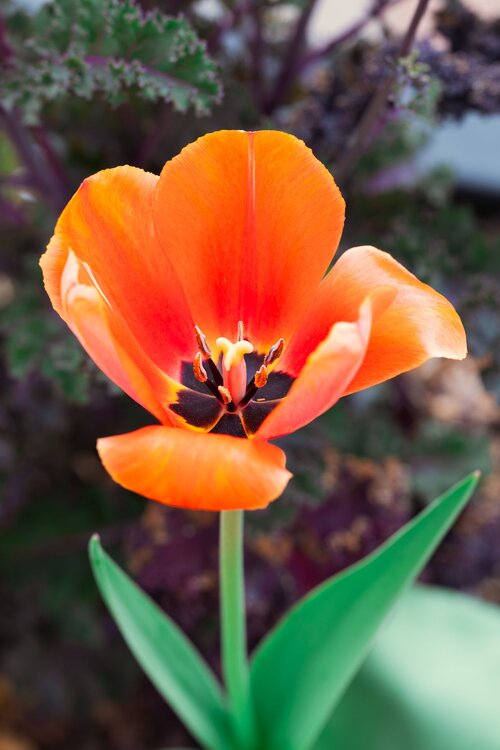
Happy Easter, happy spring to all! And @mappy, here are some tulips for you!!


-
It's time to grade Winter 2025-26(now that it's actually over)
Scarlet Pimpernel replied to CAPE's topic in Mid Atlantic
FYP!!! -
It's time to grade Winter 2025-26(now that it's actually over)
Scarlet Pimpernel replied to CAPE's topic in Mid Atlantic
OK in all seriousness I'd have to give it a B or B+. Yeah, we missed out on more snow which was indeed frustrating, but it's hard to top the 2 straight weeks below freezing, deep winter. And "snowcrete" was pretty cool, 5-6" snow with 2" sleet on top that turned into a solid layer that went nowhere for a long time. I could literally walk on top of it without pushing into the snow. And though we missed the big snow for February, I still got 3-4" when it fell at a good clip for awhile in the evening. Not to mention, the amazing turnaround with 80 degrees one day followed by half an inch or so of snow the next day in early March. -
So...snow on December 5th???
-
Amen!! I'm fine with 60s to 70s or so right now, but mid-upper 80s? Not yet, please!!! We'll have plenty of days (weeks!!) with oppressive heat in the 90s-plus and high humidity, that's a guarantee. Days where you feel like you'll just wilt or melt as soon as the sun hits you! I remember all too well the late spring and summer days when I was at Florida State University for grad school. Now THAT is oppressive, day in and day out with no break! It was always a sad day when that last cold front would go through north Florida sometime in early May...you knew there wouldn't be another one to bring in more refreshing air until nearly October!!
-
Not sure if you changed it once already, but yeah, there's some ridiculous amount of time to then change it yet again on one's own I believe (it's possible to do it once, basically, on your own). So I'm guessing that you had changed it sometime awhile back, thus got the "30,000 day" denial or something like that when you tried again more recently. I'm sure perhaps a mod would be able to go in there and change something to let you do it again. ETA: I'm tempted to suggest that you change your name to "The User formerly known as Prince[FredericWx]"!!
-
Just you wait until we see a tropical system near the Bay in late July that drops 24"+ snow on us for a cycle or two!!!
-

-
And thank you for keeping the faith, for the fun PBP (guys, folks...jaws!!) and commentary, and of course for being a Beethoven music lover! Until next winter then!
-
-
March 32nd snow is the best!!!
-
Dammit, you made me look!