eduggs
-
Posts
5,950 -
Joined
-
Last visited
Content Type
Profiles
Blogs
Forums
American Weather
Media Demo
Store
Gallery
Everything posted by eduggs
-
The pessimist in me says southwest of the NY-NJ border, this could turn into a quick (~2-4hrs) burst of steady snow followed by a period of light sleet and ending as flurries/snow showers.
-
Not great micro trends for NJ. It would be nice to see the occasional southwest shift to counter the northeast nudges. But the changes have been happening early in the midwest, which makes it hard to reverse downstream. Maybe an inverted trof at the end of the event will overperform! What's bad for PA and NJ is good for NY and CT.
-
The 18z EPS had a few members in that vicinity. And the GEFS had a few that were a little south but close. That surface track is possible though still somewhat unlikely. The mid-level low tracks are possibly more important.
-
Flurries possible overnight? Radar, HRRR, FV3 etc say maybe. But only Santa will know.
-
The 0z HRRR is very dry through 0z Sat. Yes it's the end of its range, but light precipitation is a concern of mine. 18z 3km NAM was too. There are mixed signals on the lift/forcing.
-
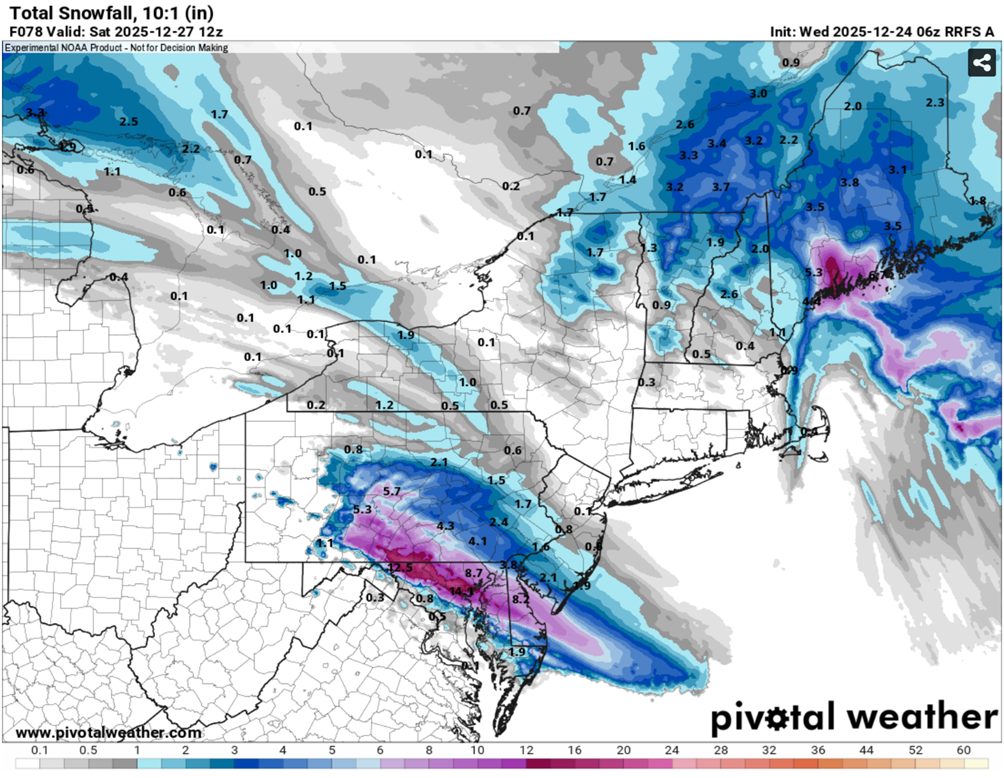
As expected, the 12z RRFS adjusted the precip. shield northeast towards model consensus, but it is (like the FV3) still very cold and suppressed compared to other guidance.
-
Quick glance at ICON and RGEM - didn't look like any major changes run to run. That should be comforting at this stage I think. The RGEM being north suggests the models taking it far south are not likely on the right track. The warm 700mb temps on the RGEM are a potential concern for sleet.
-
I'm pretty sure the RRFS is much more accurate at 48 hr compared to 84 hr... similar to the HRRR at 48 hr.
-
Counter to a few mesos being suppressed, the ECM-AI has ticked northeast with the precip. shield over the past 3 cycles. It's also interesting to note that it's on the opposite end of the envelope from the GFS-AI, which remains on the southern periphery.
-
6z RRFS for reference only

-
So we have a couple of meso-models driving this south with snow all the way down into Delaware. Are they onto something? Since the GFS, ECM, CMC, and their ensembles are in pretty good agreement as of 0z/6z, I'm going to speculate that the mesos are at the ends of their range and their convection allowing and hi-res qualities are yielding an unlikely result... We'll see.
-
The 6z RRFS nailed Baltimore with a minor event for Philly and nothing northeast of Trenton. It's presumably unreliable towards the end of its range. I've noticed it sometimes clusters with the NAM and WRF family.
-
The 0z CMC actually has ice ending as a little snow for Monday the 29th. This model was already the coldest for this event and it shifted even colder. Unfortunately it has close to zero support amongst the other ensembles. Then again, the thermal boundary has repeatedly trended colder in the mid-range recently...
-
I'm not saying you're wrong... And I appreciate that you are willing to stick your neck out and anticipate future model shifts. But I think it's worth noting that all ensemble guidance prior to 0z kept the heaviest precipitation well southwest of CT. Both the ECM-AI and GFS-AI also have done so for several cycles. I mention this because the ensembles and AIs have done well in the mid-range recently with precipitation distribution. We have not necessarily been seeing a northward shift in the short range. I can offer no particular reason to think this event will shift one way or the other... so I'm watching the ensembles means and spreads.
-
I know. But Cold Spring village (6 miles south) is even lower and there was at least 2" accumulation there. Fishkill is only 50ft higher than Beacon and maybe 4 miles northeast and there was a few inches there too. Snow disappeared across 1 mile of horizontal distance while driving at a constant elevation. I've never seen that in this particular area before. The snow level on the Beacon side of Mt. Beacon was about 400ft - 500ft. South and west of Beacon there was snow right to the river level. It was just weird.
-
Driving through the Hudson Highlands today I observed a couple inches in New Windsor, Cornwall, Newburgh, Cold Spring, Fishkill, and Garrison. In Beacon there was absolutely nothing - just bare, wet ground. Elevations were roughly comparable - all less than 300ft. I've never seen that kind of disparity between Beacon and other river towns before. It must have been some kind of meso-effect with Mt. Beacon or the wind direction off the slightly warm Hudson River... plus being right on the edge of the main band... but that doesn't explain Fishkill to the east having snow. Fascinating... Congrats to those who scored today!
-
Note that Danbury, CT - well inland - has been above 35F for three hours. They are northeast of the main accumulating snow band. Meanwhile, a narrow stripe of region to the southwest that is less climatologically favored for snow, is going gangbusters. That goes to show the critical importance of rates.
-
Could be a good burst of precip. incoming over the next hour or so for the NYC metro area. Surface temps may have warmed too much, but it could be a good test to see if rates can overcome temps in a few areas to put down a slushy accumulation.
-
Model soundings actually showed a bit of an inversion early this morning. Elevation hasn't mattered much so far. Soundings show the inversion reversing during the day so elevation may matter towards the end. But so far this has been banding and rate dependent.
-
Some areas going way over forecast. Other areas in subsidence leading to light intensity or rain. I posted 2 days ago (guessing) that I thought there would be winners and losers... that these types of overrunning events lead to narrow bands and funky distributions... and that's how it played out. These are the most wonderful events for those in the jackpot zones!
-
That is so awesome, enjoy it! I'm in Putnam County right now and we have less than an inch and main roads are wet. I'm still loving it.
-
It can snow and stick even in NYC in this airmass. NYC is a big place. It helps to be away from the immediate shoreline, outside of the heavily paved areas, and preferably a little north or west of Manhattan. If intensity is moderate or heavy, it can accumulate anywhere at 33.5F. If you are in a less favorable location within NYC and intensity is not particularly heavy and the temperature is 35F, then it is difficult to accumulate. But there are no hard and fast rules about predicting this. This kind of event happened many times in the past, including in the distant past.
-
Looking at radar, could be some 6-8" totals in NEPA and maybe stretching into extreme NNJ and W Orange County. Parts of Rockland and Westchester could get 3-4" if banding holds together. Pretty well advertised actually. NAM was too dry.
-
Two nights ago WPC snow probs for 2" accumulation had Nyack at 2% chance and Middletown at 20%. I said at the time they were low. I have no idea what they were looking at/using. Those are not mountainous regions. This was not a last minute shift or some kind of big surprise.
-
Subsidence in eastern Orange and Putnam Counties from the heavy band to the south and some downsloping off the escarpment. Meso models also showed this effect.