eduggs
-
Posts
5,951 -
Joined
-
Last visited
Content Type
Profiles
Blogs
Forums
American Weather
Media Demo
Store
Gallery
Everything posted by eduggs
-
I made a perfectly legitimate point. Focus on that instead of me.
-
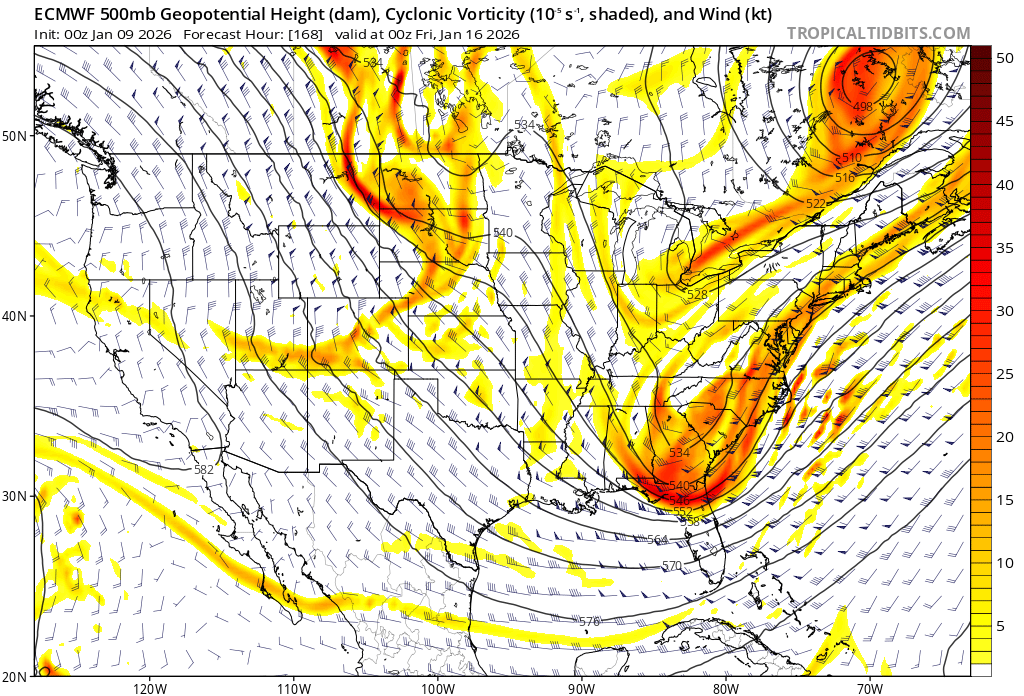
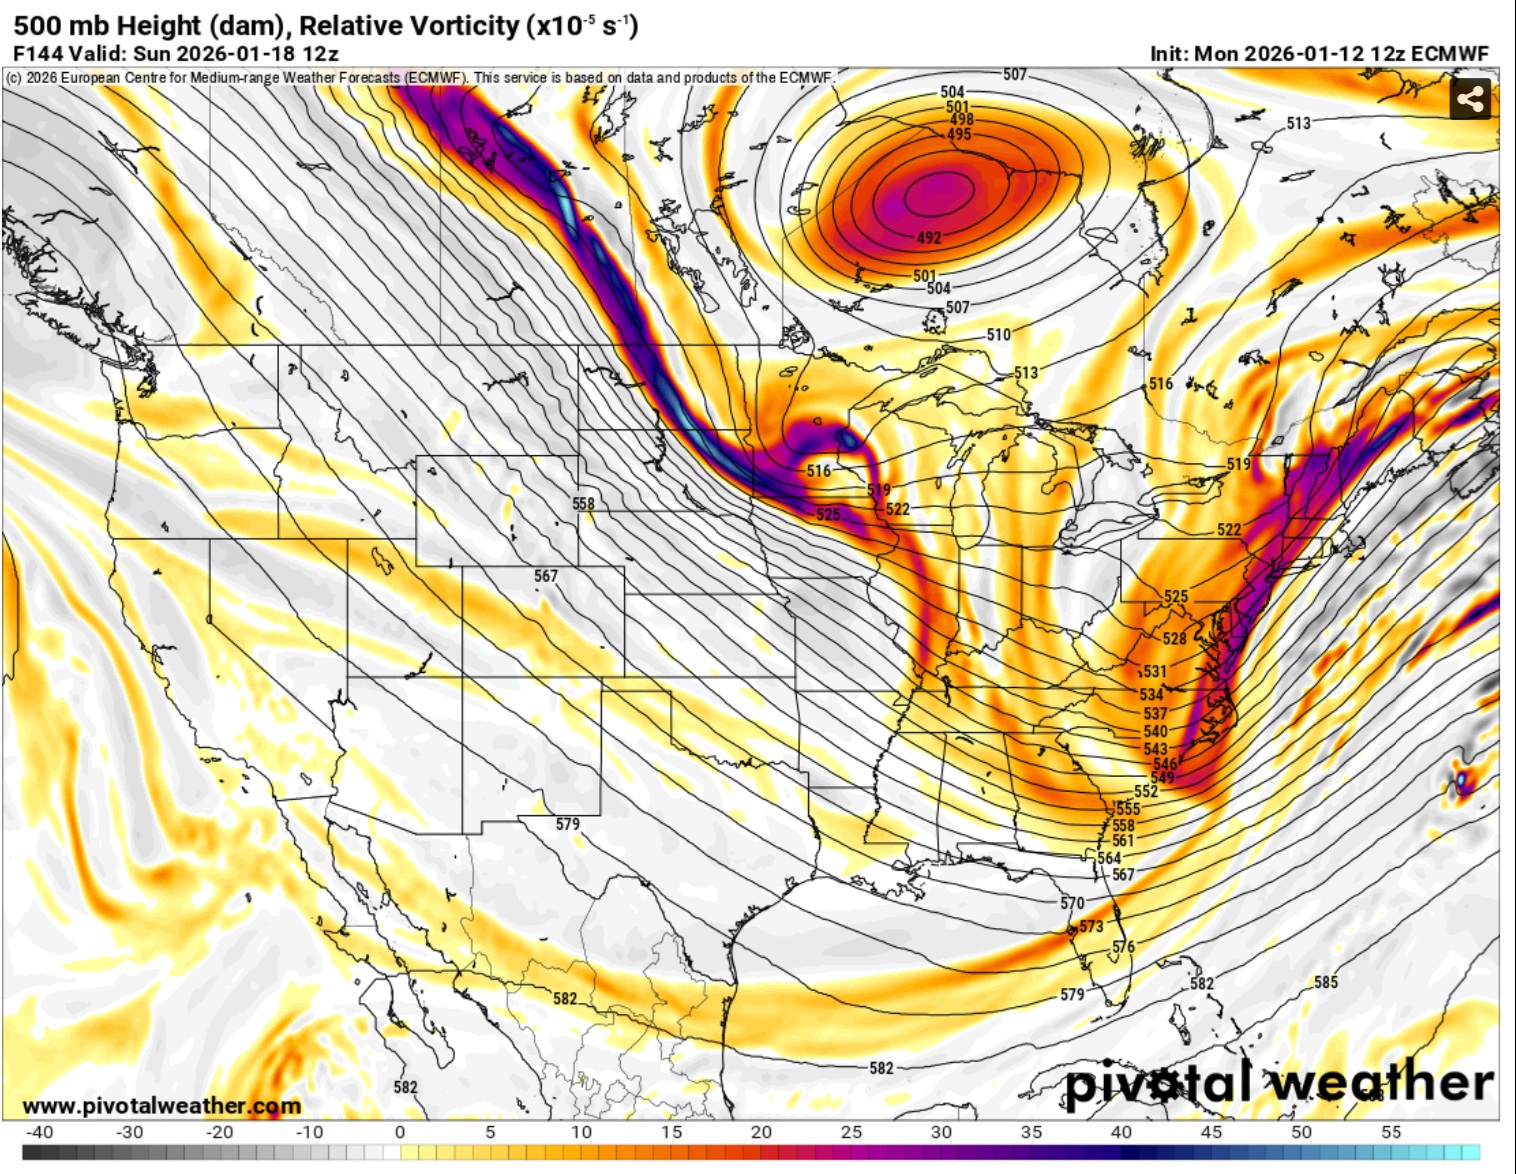
This ECMWF chart below looks a lot like something "clawing at the back" of the east coast trof for the 18th. This perfectly illustrates my point about being cautious about preferring a later threat based on averaged ensemble height fields.

-
The mid- and long-range continues to look really active for the north country with this clipper parade. And a lot of these events have better than typical dynamics. I can remember plenty of early Januarys that were dry frozen tundras up in the Dacks. Not this year.
-
I think it's more likely he'll present the underlying information that he uses in his analysis. He might also reread some of the citations at the end of the link he posted and sharpen up his own analysis. And then everybody benefits.
-
Look, I don't care how I look on this weather board. And there are certainly many people who know more than I do and whose brains work much faster than mine. I care about truth, facts, evidence, and the scientific method. These are the things that improved human quality of life tremendously over the past few hundred years. When you know what's true and you understand cause and effect, you can make good decisions that benefit people. The opposite is true when you make decisions based on myth, tradition, dogma, voodoo, or a misunderstanding of what's real and true. That's why I have a problem when people anthropomorphize weather features (surface highs/lows, "kickers") or climate indices, because it misleads people about what's actually happening. I'm sensitive to a distortion of facts and partial truths... especially when they are presented with an heir of expertise. That's why I challenge these things. If Don performed a sensitivity analysis that as a byproduct generated a mean (output) value for monthly temperature, then he should either say that or call it something else, like a probability analysis. Words matter. Perceptions matter. The reality is that, sensitivity analysis or not, we don't have a robust method to estimate local temperature beyond 10 days. The uncertainty is huge, particularly at our latitude along the coastal plain in January. To imply that we have a statistical handle on the likely outcome is disingenuous.
-
If he says something incorrect and continues to insist that he is correct, I will challenge it right here. Maybe I'm wrong. Maybe he's wrong. Either way, anybody reading can learn. If I had no respect for him, I would ignore it. People need to know what's true and what's not.
-
Sunday is still on the table for some kind of event. All the ensembles have something. It's workable.
-
Some of us know what a sensitivity analysis is. And for those who do not, your link is helpful. But what you present is not a sensitivity analysis. Or maybe you are withholding most of it, which should include: - which inputs you used in your analysis - how they were perturbed - how the output (mean temp) varied with those perturbations - ranking of influential variables The goal of a sensitivity analysis in to determine which variables have the biggest impact on some output... not just what is the most likely output. And if the variables, assumptions, and their tested ranges aren't included, the output is kind of meaningless.
-
I agree strongly with everything written except this. I believe these features are not causally connected. They are only loosely correlated, and always in hindsight. Besides that, the trof IS clearly sufficiently sharp for a major event. But the synoptic details (which you correctly mention) impede development in a way that would impact us locally.
-
Don, if you go with uncertainty analysis or probabilistic analysis, then I think we're on the same page. But not sensitivity analysis. Early in most months it should be close to a coin flip whether the month will end up above or below normal. Our climatic base state relative to previous decades is warm, so we hedge warm to start. And then Bayesian updating based on long-range modeling.
-
Snow is good anytime, but February is melt season and often the beginning of mud season. December- and January snow is more emotionally and aesthetically valuable at our latitude.
-
The hype started based on long-range anomaly charts about a week ago. A favorable "look" on those charts is like cat-nip to some people. The ICON, then GFS, and eventually ECM gave credence to this hype for a while.
-
The GFS and GEFS have performed poorly for our local area for the past few wintry potential threats. I know local performance is highly variable and somewhat random, and I haven't seen updated verification scores, but I do wonder if the brain drain that started at NOAA/NCEP around 2016 might be finally catching up to us.
-
That 55% prediction is not very useful without the associated uncertainty. Even if the statistical method used for the sensitivity analysis is sound, there is presumably a large spread considering our lat/lon and the variability of the underlying factors/predictors. It could plausibly end up well above or well below normal for the month.
-
The GEFS are clustering around the OP as usual, so 0z is worse than 18z. But they are not catastrophic. They don't look completely hopeless. Still some plausible path back to a snow threat. When you trace the critical shortwave(s) back to deep northern Canada, its seems incredible that such a minor shift (100 miles) in placement of a ripple in the flow that travels 3000 miles could have such a major impact on future weather. That's just to say that a minor model error in the critical shortwave track could still cause significant model changes from here on out.
-
It feels like it's been a pretty active winter so far in the Adirondacks and N VT. Lots of small and medium events. I see no reason why that won't continue. Down here we've had a lot of dustings and coatings... As many this year as the past 4 combined.
-
I don't think it's game set match just yet. It's not unprecedented for a 3 or 4 day model head fake. But we'd really have to pull a rabbit out of our hats at this point. If this plays out close to the 0z GFS, I think it was a great job by the AI models. They showed this weird, disjointed surface setup for days and hardly wavered.
-
Yeah the GFS shifted towards model consensus unfortunately.
-
The critical shortwave on the 0z GFS is slightly further east this run. Crossing WI instead of MN. That's probably not good.
-
The Canadian is still not on board.
-
It finally has the critical shortwave diving south through MN at 60hr. Not quite as sharp as the GFS, but huge improvement over 18z.
-
I did notice a bunch of 960s something mb lows on the individuals off of the Cape at 18z Fri. That's a bit west of the GFS op. I'll take the 958mb just off Montauk though! It's fun to look at but even on the GFS and GEFS, the 850mb/700mb lows are too slow to develop. And I'm losing confidence in this type of solution as we lose models to the Canadian solution.
-
It's a shame that all the overrunning is modeled up in NW PA and NNY. If the GFS is right, there could be some good snow with that feature.
-
We lost the UK, ICON, and ECM-AI today. We'll track it to the end like the Challenger crew steered the shuttle, but this is starting to look cooked.
-
We're down to the GFS & GEFS. We'll see how the ECM and UK look. This sort of has the feel of a glimpse of a chance slipping away.