

raindancewx
-
Posts
3,953 -
Joined
-
Last visited
Content Type
Profiles
Blogs
Forums
American Weather
Media Demo
Store
Gallery
Everything posted by raindancewx
-
Southern Plains Winter 2021-2022
raindancewx replied to Iceresistance's topic in Central/Western States
The long-range models are completely useless except for looking at the next month right before it starts for temperatures and precipitation. The Jamstec, when it was around did a pretty good job of accurate gauging ENSO strength. I do think right before the next month starts, the CFS and Canadian on tropical tidbits do have some skill, although much less in Fall and Spring than in Winter and Summer. -
Some random thoughts for winter - - The strongest land falling hurricanes on the Gulf Coast tend to precede incredible cold waves. Not always. Not in the same location or same month. But they do appear pretty frequently: 1932, 1935, 1947, 1961, 1969, 2004, 2017, 2018, 2020 all come to mind. - Cold ENSO Junes with staggering Western heat is not common. Like...at all. It's vanishingly rare actually. But it shows up in 1961 (a year a with 932 mb hurricane to hit the Gulf v. 929 this year). - In La Nina years since 1950, April NAO patterns correlate to December NAO patterns around ~0.25 (r-squared). The correlation is positive, so like last year, the very negative April favors a -NAO in December. - Years with similar levels of warming in Jan-Aug in Nino 4 - La Nina, El Nino - whatever situation you have - tend to be fairly warm in the winter. Not always - but very few exceptions either. I am expecting a major cold wave in the East this December. But I don't think it will last the entire month, and I don't think the month will finish super cold overall.
-
2021-2022 ENSO
raindancewx replied to StormchaserChuck!'s topic in Weather Forecasting and Discussion
The ENSO zones in 2021 are generally close each month to a blend of 1967, 2001, 2011. Not really expecting that to change overall. This isn't what I expect to happen in the winter regarding US weather, but I do think the event will look like this. I'm expecting what I would call "cannonically cold enough" La Nina conditions to last from about October-February, so may not be an official event. -
Southern Plains Winter 2021-2022
raindancewx replied to Iceresistance's topic in Central/Western States
The WPO is a pretty warm signal when positive for most of the US in late winter. I think you guys would have been colder in Jan-Mar without the record strength (strong lows over NE Asia). -
Southern Plains Winter 2021-2022
raindancewx replied to Iceresistance's topic in Central/Western States
September is the month I use for testing analogs I come up with in Summer. The way the month looks like it will finish does match one of the weightings I like. But still want to see how the month finishes before I go into detail. There are some unusual features I don't like for this winter, mostly because I don't know what to do with them. The level of June-July heat in the West in a cold ENSO year is hard to find. But it's pretty similar to 1961. The four years I like most right now are 1961-62, 2001-02, 2017-18, 2020-20 for the winter. You can roughly re-create the four Nino zones each month of 2021 blending 1961, 2001, 2011 together. I'm trying to decide which extra years will be in the blend at the moment. There are a lot of "B" tier analogs this year, by the system I use: A analogs - generally strong matches for temp/precip patterns in the US over long time frames. B analogs - generally strong matches for temp OR precip patterns for long time frames. Or good matches for both in short periods (can beat A analogs in small periods) C analogs - generally strong matches for temps or precip for short periods. D analogs - consistently "off" but vaguely similar. "B" analogs for me right now are 1938, 1960, 1967, 1973, 1977, 1979, 1988, 1995, 1998, 2000, 2005, 2008, 2011, 2013, 2016. I'm most tempted by 1960, 1967, and then all the years I listed from 1998 on. I'm very hesitant to use the years after the biggy-El Ninos though (2016, 1998, 1973). Pending more information, I like some kind of weighted blend of 1961, 2000, 2001, 2011, 2017, 2020 for the Fall. That's a similar QBO/AMO/PDO/ENSO/Solar/Hurricane landfall/ENSO prior year match, with nearly identical matches locally for both temperatures and precipitation for close to a year. In other words, it's a cold ENSO year, after a cold ENSO year, with relatively similar solar, a warm North Pacific, and the Indian Ocean in the right phase (1998 is the most recent year with incredible warmth east of Indonesia like this year in a La Nina, tempted to use it to reflect the IOD magnitude). Need to see if resembles September at all though. -
2021-2022 ENSO
raindancewx replied to StormchaserChuck!'s topic in Weather Forecasting and Discussion
-
Southern Plains Winter 2021-2022
raindancewx replied to Iceresistance's topic in Central/Western States
Does this work for you Mr. Sunshine? I don't have a forecast for this year yet. My general view is there is blocking this year, but the timing will be a lot different than last year. I don't expect a record, or near record +WPO like last year for the 1950-2020 period. There were countless storms <1000 mb by the southern tip of Kamchatka which is the Bering Sea rule "translation" spot for where I am, at 17-21 day leads, and it's a pretty relevant feature for late season blizzards in the SW & tornadoes in Spring. My hunch is the PDO will start to flip pretty hard late winter. Most of the local data implies a wetter/warmer winter than last year. The true dog-shit winters in the Southwest tend to see very wet Septembers in La Nina / cold ENSO years. Look at 2005, 2008, 2013, 2017 in September v. 2007, 2011, 2012, 2020 in terms of recent years. I'd be happy with an inch of rain this month (about average) at this point. If you look compared to last year, the Indian Ocean Dipole is also more of a thing this year. So I'd expect different tendencies for where the MJO amplifies or de-amplifies. -
Southern Plains Winter 2021-2022
raindancewx replied to Iceresistance's topic in Central/Western States
I know I just made a huge post on the strongest landfalling Gulf Hurricanes, but it's not something I weight highly. It's more that given a choice between a year like 2010 without relevant Gulf hits, and a year like 1961, I'd pick 1961, if all other factors were equal. I do think it's interesting that the stronger La Ninas tend to not see major Gulf hurricanes though (2010, 1973, 1975, 1955, 1998, 1999, lack big hits). -
Southern Plains Winter 2021-2022
raindancewx replied to Iceresistance's topic in Central/Western States
This is how my analogs did last year for anyone curious. I was trying to create a +WPO La Nina based on how similar the Nino 3.4 data in 2021 was to 2007. But I also expected more blocking than that year, with the Apr-Dec NAO correlation (r-squared) around 0.2-0.3 in La Nina years. The -NAO in April was quite strong in 2020, like this year. It's freaking hard to get a major +WPO in a La Nina, but the tendency is that the WPO goes positive in the lowest sea ice extent years, and I knew that heading into last year. -
Southern Plains Winter 2021-2022
raindancewx replied to Iceresistance's topic in Central/Western States
I wasn't making some detailed observation based on any research, but I would bet on a relationship. Quite a few of the ten coldest Februaries in the past 90 years show up for sure (1933, 1936, 1949, 1989, 2019, 2021) for various spots of the US. Look at the fours / fives to hit the Gulf Coast since 1930. https://www.aoml.noaa.gov/hrd/hurdat/All_U.S._Hurricanes.html 1932, (1935), 1948, (1960), 1961, 1965, 1969, 1988 (Gilbert s. of TX), 2004, (2017), 2018, 2020 You can debate if 1935/1960/2017 (SW FL/Keys), 1988 (not US), should count, but you definitely have a lot of cold in those years of cat 4-5 Gulf landfalls. February 1936, February 2019, Jan 1970 are cold to stupid cold after the cat five hits (all El Nino / near El Ninos btw with the fives). Severe cold in Dec-Mar after a 4-5 landfall on the Gulf: December (8/12): 1932 (West), 1935 (East), 1948 (NW), 1960 (SE), 1961 (everywhere), 1965 (west coast), 1969 (east), 2017 (Lakes/NE). January (9/12): 1933 (West), 1936 (all but west), 1949 (west), 1961 (SE), 1962 (everywhere), 1966 (everywhere), 1970 (everywhere), 1989 (west), 2018 (SE) February (10/12): 1933 (West), 1936 (all), 1949 (West), 1962 (north), 1966 (everywhere), 1989 (everywhere), 2005 (sw), 2018 (N Plains), 2019 (Plains), 2021 (Plains) March (7/12): 1949 (West), 1962 (all but NE), 1970 (all but west coast, 1989 (N. Plains), 2005 (NE), 2018 (NE/Montana), 2019 (Plains) Summary of Severe Cold Signal: 1932-33: D-F (West) 1935-36: D-J (East), F (all) 1948-49: D-M (NW, then west) 1960-61: D-J (SE) 1961-62: D-J (all), F (N. US) M (all but NE) 1965-66: D (W), J-F (all) 1969-70: D (East), J (all) 1988-89: J (West), F (all) 2004-05: F (SW), M (NE) 2017-18: D (NE), J (SE), M (NE/Montana) 2018-19: F-M (Plains) 2020-21: F (Plains) -
Southern Plains Winter 2021-2022
raindancewx replied to Iceresistance's topic in Central/Western States
Severe cold snaps tend to occur within a year of the most powerful Gulf Hurricane landfalls. Typically after. Some periods in 1964-65, 1965-66, 1969-70, 1961-62 and 1967-68 are stupid cold in the Plains relatively near Hilda, Betsy, Camille, Carla, and Beulah. Similar to how you had stupid cold after Michael (2/2019) and Delta (2/2021) last year. We'll see how that goes. The other recent monster storm years like 2005 and 2008 and even 2012 had pretty severe cold at times (and snow too). It's just something with the MJO and how the subtropical highs setup in the Atlantic I think. The overall pressure pattern last year was kind of like a blend of 1959-60 (x2), 2007-08, 2008-09, to get the La Nina, warm North Pacific, super +WPO, and net -NAO. It's not an easy thing to replicate historically, but I sort of had the right idea in October with my blend of 1995-96, 2003-04, 2007-08 (x5), 2012-13 (x2), 2019-20. Point is, I'd look hard at the big Gulf years in the 1960s, and then some of the very weak and cold-Neutral years with the warm North Pacific. I already have some pretty solid analogs but nothing definitive yet. -
2021-2022 ENSO
raindancewx replied to StormchaserChuck!'s topic in Weather Forecasting and Discussion
Since 1950, there is no ENSO event where Nino 3.4 has fallen by more than 1.0C from September to Dec-Feb. Keep your eyes on the September readings in Nino 3.4. First few days are 26.5C on the weeklies (centered on 9/1). You need 26.0C in DJF just for a La Nina (-0.5C v. 1951-2010 average of 26.5C). -
Happy one year anniversary for the great 9/8-9/8 snow storm. We had snow down to Santa Fe last year. High was 47 in Albuquerque, unbelievable cold for that early in the year.
-
2021-2022 ENSO
raindancewx replied to StormchaserChuck!'s topic in Weather Forecasting and Discussion
La Nina? La Not-a. Basically no meaningfully cold water in the 120-170W, 5N-5S zone yet. -
The years with the highest Atlantic ACE tend to have active MJO pulses in the right phases during Summer for fun and games later on, when it gets cold. I haven't looked, but I'd expect that the increased frequency of hurricanes in some La Ninas corresponds to different strength for the subtropical high in winter, and can lead to more volatile conditions on the Atlantic side, instead of just the Pacific volatility that often shows up in La Nina winters. The strongest storms hitting the Gulf Coast (1886, 1900, 1932, 1961, 1965, 1969, 2018, 2021 as examples) also tend to occur when the Atlantic flips from AMO phase to another, and that is linked to more pronounced periods with blocking in some of the research.
-
ACE is pretty correlated to total snow in NYC/Philly, less so in Baltimore/DC/Boston in La Ninas. r-squared is around 0.3 in some spots in around 30 winters. Almost impossible since 1930 to get a big winter for snow without a high ACE total in a La Nina. Not a guarantee, but La Nina goes from ~0% odds for a great winter (+20-30% snow v. average) to 50% if the ACE is high enough. Look at the 11 winters for snow I listed for Baltimore above, and compare them to the lower ACE (<150) years to see it.
-
2021-2022 ENSO
raindancewx replied to StormchaserChuck!'s topic in Weather Forecasting and Discussion
PNA has never really correlated that well to December or Fall ENSO values, whether you use Nino 3.4 ssts like I do, MEI, ONI, SOI, whatever. PNA correlation to Nino 3.4 December is 0.1 according to CPC. Very weak. https://psl.noaa.gov/data/correlation/table/corr.table_dec.txt -
ACE is sustained winds in every named tropical storm measured every six hours, in knots. That number is squared and divided by 10,000. Each 6-hour ACE value for each storm is summed for the season. So sustained winds of 115 mph (category three) give 100 knots. That value would 100*100 / 10,000, i.e. 1 point. If the storm was 130 kts six hours later, it would 130 * 130 / 10,000. The ACE figures I referred to are for the Atlantic. The six hour time frame for measurement is used because it corresponds to old ship reports and things like that pre-satelite era.
-
2021-2022 ENSO
raindancewx replied to StormchaserChuck!'s topic in Weather Forecasting and Discussion
Yep. Especially in the Fall. If you rank Nino 3.4 by month for "coldness", the event last year was most impressive in the Fall. October and November 2020 were both top ten cold ENSO events since 1950. The later/earlier periods were no where near that. These are your coldest ever Novembers in Nino 3.4, using a constant baseline (CPC uses a sliding baseline) of 26.49C. Top ten sounds real strong out of 71 years right? Problem is only like 23 or 24 of the years are La Ninas. So the peak is really only slightly above the middle of the pack for a La Nina, and then it was weaker in winter Spring. 1955 -2.24 1973 -2.16 1988 -1.84 1975 -1.44 2010 -1.43 1999 -1.37 2007 -1.32 1998 -1.25 1964 -1.23 2020 -1.21 -
That look on the Euro is somewhat similar to at least one of the cold ENSO (non-La Nina) years in the 1960s. Can't remember if it's 1960-61, 1961-62, 1962-63, or 1967-68 but I think at least one of those is similar. The warmth by Indonesia with another big IOD phase is not something I was looking at a few weeks ago.
-
2021-2022 ENSO
raindancewx replied to StormchaserChuck!'s topic in Weather Forecasting and Discussion
That bath water by Indonesia seems way more important to the global pattern at the moment than the weak little cold-Neutral look we have. Still a lot of light blue / white (-0.4C to +0.2C waters v. 1981-2010 averages) in the 120-170W, 5N-5S Nino 3.4 zone. -
2021-2022 ENSO
raindancewx replied to StormchaserChuck!'s topic in Weather Forecasting and Discussion
Nino1+2 Nino3 Nino34 Nino4 Week SST SSTA SST SSTA SST SSTA SST SSTA 28JUL2021 22.1 0.8 25.1-0.4 26.7-0.4 28.7-0.1 04AUG2021 21.7 0.7 25.1-0.2 26.7-0.3 28.6-0.2 11AUG2021 20.9 0.1 24.8-0.4 26.5-0.4 28.6-0.2 18AUG2021 20.5-0.1 24.4-0.6 26.0-0.9 28.6-0.2 25AUG2021 20.6 0.0 25.0-0.0 26.5-0.3 28.5-0.3 01SEP2021 20.3-0.2 24.7-0.3 26.5-0.3 28.4-0.3 29JUL2020 20.1-1.2 24.7-0.8 26.3-0.8 28.4-0.5 05AUG2020 19.8-1.3 24.6-0.7 26.3-0.7 28.4-0.4 12AUG2020 19.9-0.9 24.8-0.4 26.4-0.6 28.3-0.5 19AUG2020 19.5-1.1 24.3-0.7 26.0-0.9 28.4-0.4 26AUG2020 20.0-0.6 24.2-0.8 26.1-0.7 28.6-0.2 02SEP2020 18.9-1.7 23.6-1.4 25.8-0.9 28.4-0.4 For this week, +1.4C in Nino 1.2, +1.1C in Nino 3, +0.7C in Nino 3.4, and even in Nino 4 compared to 2020. Last year, conditions were solidly La Nina by now. This is not that. Nino 3.4 is 120W-170W. You have some warm water below the surface at 160W and west. The waters below the rest of Nino 3.4 are somewhat cold but not incredibly. You also have some warmth way at depth which diminishes the totality of the cold signal quite a bit.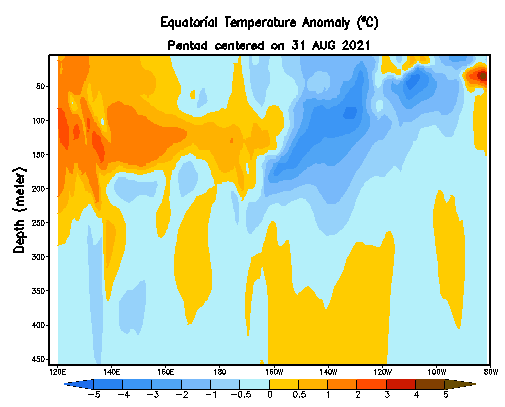
-
It doesn't work reliably in Baltimore/DC and south, but in La Nina years, ACE over 150 is almost a pre-requisite Summer trait for the big NE snowy winters. Pretty sure there are no La Ninas more than +20% or +30% for NYC/Philly snow totals since 1930 when ACE is not at least 150. I know you guys don't live up there, but if you hit 150 ACE in the Summer, you at least have a shot at a lot of Nor'easters with blocking. The big ACE La Nina years since 1931-32 are these, in order of highest ACE: 1933, 2005, 1995, 2017, 1950, 1998, 2020, 1999, 2010, 1955, 1964. If you use Baltimore, the 11-year average snowfall is (44.6+19.6+62.5+15.4+6.2+15.2+10.9+26.1+14.4+18.1+18.6)/11 --> 22.9, and essentially a coin flip for near-normal to snowy conditions using the 1991-2020 snow average. 1933-34, 2005-06, 1995-96, 1999-00, 1955-56, 1964-65 are all near average to snowy using the most recent 30 years. 2020-21 and 2010-11 would probably be snowy patterns too with less bad luck.
-
2021-2022 ENSO
raindancewx replied to StormchaserChuck!'s topic in Weather Forecasting and Discussion
All months since March this year have at least resembled the 1961 look nationally, although the placement/extent of the cold matching 2021 has not been perfect. You can see the Summer finished too cold in 1961 compared to this year. My view is you can't treat weak La Ninas in the old days like weak La Ninas today. They tend to be surrounded by warmer waters in the Pacific now. But the old cold-Neutrals years often had that. So that's why a lot of those years are working well as analogs right now. Locally, there is something of a signal in the temperature matches for a very cold December followed by a much warmer late winter. The monsoon in my exact spot has not been strong, but it has been quite consistent for southern NM and Arizona this year. Those areas won't need any cold/extra moisture in winter to remain above average...so my guess is they won't be cold or wet. Here we've been dry with near average temps which is a more mixed signal. The hottest driest cold-ENSO Summers tend to be colder/wetter winters here (1954, 2007, 2011, 2012, 2016, 2020) while the wettest/coldest cold-ENSO Summers tend to be warmer/drier winters here (1933, 1999, 2005, 2008, 2013, 2017). Not quite sure what to do with a Summer with below average hot days and rain yet. Last year had ~88 days hit 90, with ~40% below average rain in Summer. This year is more like 25% below average rain. As of yesterday, only 55 days have hit 90 - fewest since 2008 (64 is average for a year). -
Occasional Thoughts on Climate Change
raindancewx replied to donsutherland1's topic in Climate Change
If you included the necessary prior conditions to the immediate trigger for the recent flooding, you'd have Henri and all the other flash flood events from the near record wet Summer in Boston and NYC in there, and I'd expect you'd end up a lot closer to 400.

