

raindancewx
-
Posts
3,953 -
Joined
-
Last visited
Content Type
Profiles
Blogs
Forums
American Weather
Media Demo
Store
Gallery
Everything posted by raindancewx
-
The cold ENSO years starting 2007 with very low sea ice (4.3 million square km or lower mins in Sept) have all been cold somewhere in the West in winter (2007-08, 2011-12, 2012-13, 2016-17. 2020-21) while the higher sea-ice cold ENSO years have not been (2008-09, 2010-11, 2013-14, 2017-18). That's something I'm watching. Certainly worked here last year. Late Summer, July-September is pretty well correlated to how warm Nino 3.4 is in March-May. You would think we'd see a pretty different late Summer pattern from last year. I've actually been sold on a near average or cold August out here for a while for a few reasons - two near record hot Augusts in a row are unlikely to repeat with a third. More generally, this also looks like a more active East Pacific hurricane season than last year to me which can help crush heat in the Southwest in August. Hot La Nina years in the Southwest tend to see late developing heat (90+ readings). So it didn't reach 90 until June here, which is late. But if the sea ice is low, that hasn't failed since 2007 as a "cold somewhere in the West" signal in the low ENSO years. Would be interesting to see those two stats locally go against each other. I'm also starting to wonder if the level of rain by the New Mexico & Texas border the past 60 days is enough to prevent a big high from settling in there for a while. I knew back in Spring May would be a decent month out here just because the November NAO (+) is highly correlated to wet Mays when positive, and so is the January WPO (+) - and both were extremely/record positive. The extreme drought for New Mexico has been been cut in half since 1/1 according to Uncle Sam.
-
2021-2022 ENSO
raindancewx replied to StormchaserChuck!'s topic in Weather Forecasting and Discussion
Nino1+2 Nino3 Nino34 Nino4 Week SST SSTA SST SSTA SST SSTA SST SSTA 02JUN2021 23.2-0.4 26.6-0.2 27.6-0.2 28.8-0.2 09JUN2021 23.2-0.0 26.7-0.0 27.8-0.0 28.9-0.1 16JUN2021 23.3 0.4 26.0-0.5 27.2-0.5 28.8-0.2 23JUN2021 22.9 0.2 26.3-0.0 27.6-0.0 29.0 0.0 30JUN2021 22.6 0.3 26.2 0.0 27.5-0.1 28.8-0.1 June monthly data crossed into positive territory (more El Nino like than La Nina) against the 1951-2010 baseline I like to use for ENSO. Even against the more recent 30-year period, we're solidly Neutral now. We're still tracking fairly similarly to 2012 and 2013 in Nino 3.4 for the year. The June figure is also close to 2016 now. -
Historic Pacific Northwest Heatwave of 2021
raindancewx replied to donsutherland1's topic in Climate Change
The attribution science assumes that some link between the Earth warming an extreme event can be found. But...it does it after it happens. To me that's like saying I studied that a big steak filled me up more than two slices of bread. I don't think it has any use. I know I complain about the math, but it's really more the philosophy that bugs me. You can predict after every single unusual weather event than a scientist will say it is Global Warming that contributed to the event. The public doesn't care because the public already knows the scientists will say that. People have no use for knowing that a specific unusual regional weather outcome in the future is linked to the Earth warming if there is no specific timeline for when it will or won't happen. The weather has always been pretty terrible at times, and people have always had to adapt to it, it's just now the adaptations are all toward the warming changes rather than more erratic changes. You can't do anything useful behaviorally from knowing that a rare event was linked to changes in the Earth's temperature. Are people in Portland going to give up their cars? You might think they'd buy air conditioning, but you had a pretty big heat wave in the Northwest in July 2009 and even that didn't happen to a large extent, and it's not like the population stopped growing out there in the 1800s when they had prior less intense heat waves before cooling systems and things like cold bottled water were available. I don't see the point of any of it. If you're talking about something like water in the West, most of the states have had 10 to 100x increased population compared to 100 or 200 years ago, so even in a colder or wetter climate you'd have water and other resource shortages with poor planning. You would have had to divert water resources anyway out here just from the order of magnitude in the population growth (New Mexico went from 327,000 in 1910 around statehood to 2,100,000 now as an example, and even in the 1800s Mark Twain was noting the rivers rain dry, and most of the West has seen far faster growth). https://www.carbonbrief.org/mapped-how-climate-change-affects-extreme-weather-around-the-world -
2021-2022 ENSO
raindancewx replied to StormchaserChuck!'s topic in Weather Forecasting and Discussion
Euro keeps missing the boat on the Nino 4 readings. Whole plume should shift warmer though. -
Historic Pacific Northwest Heatwave of 2021
raindancewx replied to donsutherland1's topic in Climate Change
I wasn't trying to argue that the specific +40 or +50 readings are not super rare. I think those are flukish and not normally distributed at all. In fact, I ran some of the figures for the NW and Canada in sites with 100+ years of records and they don't really pass some of the normality tests depending on what you're looking for. I can tell you locally, precipitation and snow are the same way, unless filtered by ENSO. So I'm not a big fan of that premise. My focus was more on the general +30 and +35 zone. I think with enough +30 events, you have to look at it as inevitable that some spot somewhere would greatly exceed the general trend. My math was my daily estimate for +35 odds, not +40 or +50. I do think it's well under 1 in 200,000 for a spot to hit +30 in a given day. It's not really that rare in the way we perceive time with so many days. My assumption here is if the high was as strong, but 15 miles displaced in a parallel universe Earth but the same pattern existed, you'd have different sinking air through the valleys and then the sea breeze would behave differently too. You'd end up with a different collection of records by magnitude and space. That's why it's so dumb to me to attribute the +50 or the +40 to climate change. You should be trying to figure out if this setup exactly or with slightly different positioning is going to happen again, or if next time the high will be as strong, but with a sea breeze allowing Seattle to be 78 while Spokane is 110. Most of the research I see is only about "proving" the Earth is warming to show the science is settled using poorly calculated probabilities, which is dumb, if you believe it is settled as the scientists surely do. I really don't have an issue with the general idea of warming, but the way the science is used in situations is borderline useless, since no one knows if this will happen later again this Summer or in 5,000 years, even if the odds favor it happening more. -
Historic Pacific Northwest Heatwave of 2021
raindancewx replied to donsutherland1's topic in Climate Change
I would say to add to this, that each climate region / zone is akin to a slot machine with specific odds for an extremely unlikely event. The odds of a jackpot in the Northwest are apparently much higher in Summer for record heat than where I live in the mountains of the Southwest as an example. How do I know that? In Albuquerque, the all-time record high is 107. The highs reach 72 in mid-April peak at 92 in late June to early August, then fall back to 72 in mid-October. That means you have a six month period, for 1892 to 2020, which is 128 complete years at 183 days per year, when 35 degrees above average is less than 1/23,000+ odds, just going by the observations. That's even including substantial warming in that time frame. That's what I mean when I say the bigger effects are from climates changing climate zone/type. Seattle and Portland are perfectly capable of warming up rapidly by drawing up hot desert air in the Summer that sinks from the East rather than cool Maritime air from the West or cold Arctic air from the North. New Mexico is hot regardless, because whether from the south or east or north or west, the surrounding is hot. NM won't see +35 because in that six month time frame since there is no source region of air hot enough to put 127 degrees at 5,300 feet above sea level in July, or 107 in April or October. The issue with this type of math is that the odds reset each day. It's not 1/23,000+ for Albuquerque to hit +35 for the half year, or 1/10,000 for Portland to do it in the Summer. It's each day. I know some spots hit +50, but the general area was more like +35. Given that we just had multiple days of record readings, all concentrated in the same area, it's pretty obvious that because of the exposure to cold in the Arctic/ very wet Pacific air/ very hot desert air from the Southwest, that the odds of a +35 day in the Northwest in the Summer are actually way better than the <1/23,000 per day floor here. If you split the Earth into 200 pieces, I would bet the average frequency for extremes resemble what I have observed in my lifetime. I am going to be 34 in September. In my lifetime, living in Philadelphia, London, and Albuquerque, I have experienced something like 5-10 days that were more than 30 degrees above or below the long-term average high for the place. Philadelphia had a high of 6 in 1994, that's out by +30. Off the top of my head, I remember some mid 80s pool parties in March 1990 and 1998, a 95 in April 2002, 23 in March 1996 after the very cold winter. That's my guess for most extreme in Philadelphia. It snowed when I was in London in October 2008, but that's not 30 out, despite being part of that record wave (their earliest snow since 1934). In Albuquerque, there was a high of 9 (-42) and then 18 in February 2011, a high of 20 (-33) in February 2021. That's it -seven (ish) days, with a few others right probably pretty close. So based on my random sampling of Earth's climate, I've experienced 7/ ~12,400 days more than 30 degrees above or below the average high, roughly 1/1,800. I'd imagine that's closer to the figure for the extreme heat, with the recognition, that those odds are for each day. That's also why you see the extremes so often. Using my lifetime, it would be: 1 in 1,800 odds for a +/-30 high, every day, run every day for each climate, since each day has a different weather pattern globally. The other simpler issue is if you scan old newspaper and magazine accounts, you do have a lot of accounts of pretty extreme temps even in the 1800s in the Northwest. Some of the records online are free, like the one, others are behind paywalls from things like the NYT. https://www.ncei.noaa.gov/sites/default/files/march-1887-monthly-weather-review-final.pdfvia: United States of America War Department, Monthly Weather Review for 1882, Washington D.C lists the data below The following are the highest temperatures observed during July 1882 in the United States: Fort Lapwai, Idaho (113° F, 45.0° C) Umatilla, Oregon (105° F, 40.6° C) Alamota, Washington (105° F, 40.6° C) One report says: In August 1889, forest fires raged in California, Idaho, Washington, Michigan, Montana, Oregon and Wyoming in the United States. At Seattle, Washington, for several weeks, this region was clouded by smoke, caused by extensive forest fires in every direction. The entire eastern slope of the Cascade Mountains, from Natchez Pass north to the boundary was in flames. At Helena, Montana, destructive forest fires prevailed during the entire month of August. The fire consumed many million feet of lumber and thousands of acres of timber. Another report says Walla Walla hit 108 degrees in July 1891 as an example (pretty close still to the 114 record that stood from 1961 to a few days ago), with Portland at 102. I'm assuming with the current average July high of 89 or so in Walla, it was probably 85 or 86 back in the day, so just as now, you had +30 Summer days against the background of the climate state. I personally think the idea that the probability curve is what is changing for these events is sort of wrong. The events at the far end of the normal distribution are still very rare, they're just somewhat warmer when they do happen. If you change a spot from averaging 70 degrees to 72 degrees annually, and the physical limit of the spot is +/-35 v. the average, people can adapt to it. The issue would be if you changed from 70 to 72 and also shifted to a different climate zone, and suddenly +40 and -40 events became as routine as the +30 or -30 events against the 72 baseline. That's why that "record heat SW" thread has no real activity. It's great that you're concerned that we had a 600 decameter high. We'll have another one this week, and just like the last one, people here won't even notice. -
For the past year, the precipitation patterns locally have behaved much more like older years than recent years. Will be real curious to see if that continues into the rest of Summer and Fall. The most similar years to July-June 2020-21 also produced a wet monsoon. Some of the early things I look at imply a reversion toward a neutral or positive PDO base state by late year too.
-
Historic Pacific Northwest Heatwave of 2021
raindancewx replied to donsutherland1's topic in Climate Change
I probably come off as an asshole in a lot of these threads, but I am wealthy and I did buy and donate some air conditioning units to some friends who own hardware stores in the Northwest and Canada once this heat wave started to show up in the 5-7 day. I work with par sheets, math and statistics in a casino a lot for my job, including forecasting. So even if the odds for this event are 1 in 1,000 or 1 in 1,000,000 in a natural climate, the truth is I've seen award pays listed at 1 in 350,000 or lower odds happen on back to back pulls. The reason it happens in the casino is probably similar to why it happens in the climate. The odds may be super low for an event to happen, but even a place like SW Canada or the Northwest US is only a small portion of the Earth and so those odds are for each square mile of the Earth for each day of the year. The odds are not 1 in 1,000 for the entire Earth to be +50 on a given day. The odds are for one particular spot on the Earth. So the same thing happens with the games, with 1,000+ machines and several featuring multiple denominations, or multiple play options or multiple games within the game (Poker, Blackjack etc) the real world effect is we've given two $500,000+ awards (from the vendor fortunately, not the tribe) in just the past year, even though the machines are setup to pay that much - correctly - at extremely low odds comparable to the odds you see the scientists throw around. -
2021-2022 ENSO
raindancewx replied to StormchaserChuck!'s topic in Weather Forecasting and Discussion
Subsurface top matches for April-June 2021: Blend Apr May Jun 1987 0.31 0.58 0.37 1987 0.31 0.58 0.37 2004 0.21 0.30 0.04 2011 0.58 0.47 0.39 2014 1.41 0.95 0.27 Mean 0.56 0.58 0.29 2021 0.60 0.65 0.32 June 1987 is a pretty good match to June 2021. Not likely to be a good match in July though. Since the 1979 subsurface observations began, there has never been a June with the subsurface as warm as 2021 that went into a La Nina in winter. Years like 2000 were slightly positive in June, and then went into weak La Ninas though. Solar activity is also rapidly rising now. Monthly sunspot average was 16.2 from July 2020-June 2021. https://www.cpc.ncep.noaa.gov/products/analysis_monitoring/ocean/index/heat_content_index.txt Local precipitation patterns are a dead on match over the last year to some famous hurricane patterns for the US. Will be curious how that plays out this year. -
2021-2022 ENSO
raindancewx replied to StormchaserChuck!'s topic in Weather Forecasting and Discussion
I don't really a buy a La Nina this strong. But the trend toward a stronger La Nina is there on the Canadian for winter. -
2021-2022 ENSO
raindancewx replied to StormchaserChuck!'s topic in Weather Forecasting and Discussion
The western part of the tropical pacific is very similar now to 2013. Eastern areas? Not really. Not yet anyway. 05JUN2013 22.0-1.5 25.9-0.9 27.5-0.4 28.8-0.2 12JUN2013 21.9-1.2 25.9-0.7 27.5-0.3 28.8-0.2 19JUN2013 21.1-1.7 25.7-0.8 27.3-0.4 28.6-0.4 26JUN2013 20.5-2.0 25.6-0.7 27.4-0.2 28.8-0.2 02JUN2021 23.2-0.4 26.6-0.2 27.6-0.2 28.8-0.2 09JUN2021 23.2-0.0 26.7-0.0 27.8-0.0 28.9-0.1 16JUN2021 23.3 0.4 26.0-0.5 27.2-0.5 28.8-0.2 23JUN2021 22.9 0.2 26.3-0.0 27.6-0.0 29.0 0.0 -
Historic Pacific Northwest Heatwave of 2021
raindancewx replied to donsutherland1's topic in Climate Change
The Omega Block giveth and it taketh away. Looks like the high was 66 here. That's the coldest high on record, tied with 7/15/1968 for the 1892-2021 period centered on 7/1, i.e. 6/16-7/15. Edit: 67 for a hot minute. Still very close to all-time record cold. Coldest high since 1997 for a June day. -
Severe heat wave June 2021 in the southwest -- PSP 123F
raindancewx replied to Roger Smith's topic in Central/Western States
The stuff in the Northwest is more impressive than any heat wave in the Southwest during the Summer. Phoenix had some record highs this June, but daily records. Not state or all time or anything like that. We have less physical capacity for highs to run above averages down here, so you end up with a lot of years when a few days end up relatively near the 122 all-time record in Phoenix. Hitting 110+ in Canada or the Northwest is way more impressive when you have less bunching and it takes everything going right (wrong) for a record to be broken so easily despite being 20-40 above average. I can say for Albuquerque, the all-time record high is 107 degrees. So from mid-April to mid-October, that means in 90 years of records it's never 35 above average for at least six months of the year, like some places in the Northwest were. The 107 is around 15 above average. -
Historic Pacific Northwest Heatwave of 2021
raindancewx replied to donsutherland1's topic in Climate Change
Salem, Oregon. Keep in mind, Phoenix also had ~14% humidity when it was also 117 on the 18th. -
First of all, I'm probably younger than you. Second of all, you never gave a solution for states like where I live where those mean old oil companies are literally paying for my infrastructure, or at least 45% of it. Do you have a way for the state to make up those revenues, or just some empty rhetoric? I'm trying to tell you that the type of taxation that would meaningfully make a difference for emissions would leave people worse off meaningfully. Nothing is free. The Democrats have had almost complete control of the state law making bodies and executive branch since statehood, if they had the slightest interest in changing policy, presumably they would have by now. This may shock you, but knowing about science doesn't make you a good economist or a good city planner. It doesn't even make you a good advocate for science really, since that involves communication. Politicians aren't the planners of society. The world is the culmination of hundreds of billions of decisions. My point is merely that the gist of these threads is that because scientists in the field are very concerned about Climate Change, but people like the book author, you know actual scientists, are not, it strikes me as insane to say "We should only listen to Climate Scientists on the Climate. Only they are experts. Oh, but they aren't experts in any of these adjacent fields like ethics, economics, international relations, but obviously we should still unquestionably accept their input unflinchingly". That's your position from the gist of your post. https://www.abqjournal.com/2403026/nm-oil-output-at-record-levels-after-crash.html Despite attempts to diversify New Mexico’s economy, the state currently gets nearly 45% of its total revenue – or more than $4 billion annually – from taxes and royalties on the oil and natural gas industries.
-
2021-2022 ENSO
raindancewx replied to StormchaserChuck!'s topic in Weather Forecasting and Discussion
Nino1+2 Nino3 Nino34 Nino4 Week SST SSTA SST SSTA SST SSTA SST SSTA 26MAY2021 23.4-0.5 26.7-0.3 27.6-0.3 28.8-0.1 02JUN2021 23.2-0.4 26.6-0.2 27.6-0.2 28.8-0.2 09JUN2021 23.2-0.0 26.7-0.0 27.8-0.0 28.9-0.1 16JUN2021 23.3 0.4 26.0-0.5 27.2-0.5 28.8-0.2 23JUN2021 22.9 0.2 26.3-0.0 27.6-0.0 29.0 0.0 About as neutral as you'll ever see this week. Subsurface is still slightly warm. Currently in Omega Block bliss here, with temperatures not topping the low 70s, rain, and no 90 degree readings in the forecast. -
Historic Pacific Northwest Heatwave of 2021
raindancewx replied to donsutherland1's topic in Climate Change
It's still kind of funny to me that this heat wave, which has a chance at setting all time (national and state) heat records is being compared to the heat down here earlier in the month. I think I had one record daily high in June on 6/14? I've got two potential all-time record low highs coming in the next four days. 120 in Phoenix is just very different from 110 in Portland Oregon. When you get the 600 decameter monsters down here, a lot of times they under-perform because any moisture in the air is destroyed, and you end up with a 67/102 day instead of a 75/105 day. In the Northwest you have actual oceans and bodies of water nearby to really juice the lows and allow for some nasty air-masses. When the map below happened last year, the lows were still around 70 each day, even with a ~2 degree urban heat island effect in Albuquerque for the lows on top of the 1.8F degree warming/century that is present in all other sites in NM. I can't even imagine a 112 degree day, +35F v. average, with a dew point in the 50s-60s all day like Portland had today, you just never have that oppressive stuff here. 104 with a dew point of 66 at 1pm is the type of the thing that would easily kill people not used to it. https://forecast.weather.gov/data/obhistory/KPDX.html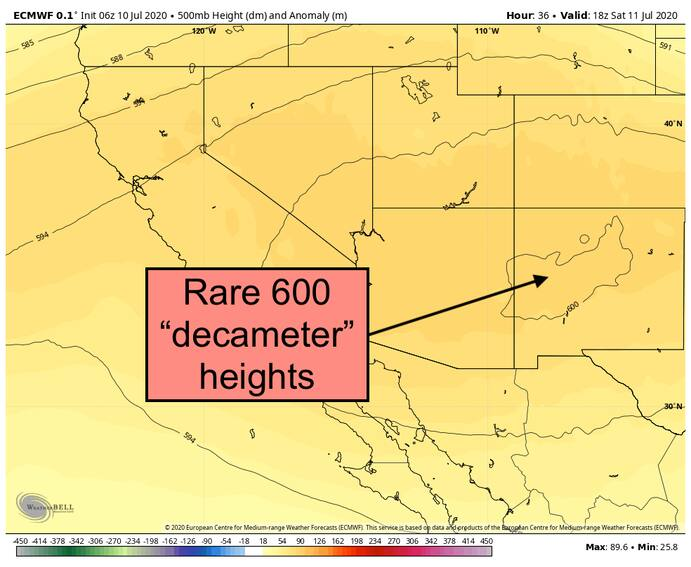
-
Central/Western Medium-Long Range Discussion
raindancewx replied to andyhb's topic in Central/Western States
The look on the CFS for July has been fairly consistent with the big positive March WPO correlation to July for a while now. Not to mention the May -NAO correlation to July. -
The big hints for next winter at this juncture are the periodic record WPO values, the first (net) -NAO winter in forever, and then how cold Nino 4 was in winter. Winters after negative NAO winters tend to be cold in the eastern 2/3 of the US, but signal is weak, with a Great Basin warm signal: Winters after a cold Nino 4 winter tend to be cold Southwest, WA, CA, warm east coast and south. Again, signal is weak. Winters after a very positive WPO winter tend to be warm eastern 1/3 of the US and Montana. Not a whole lot of -NAO, +WPO, very cold Nino 4 winter combinations either to get the transition to the 2021-22 winter. DJF WPO NAO Nino4 2020 1.40 -0.42 27.32 2008 0.91 -0.08 27.48 2000 0.44 0.04 27.46 1959 0.38 -0.91 27.70 1952 0.28 -0.20 27.93 2007 0.43 0.65 26.97 July 2009 had the prior hottest day in Seattle at 103 late month. So it's interesting to see that year pop up when the subsurface has been similar. 1959 0.38 -0.91 27.70 1959 0.38 -0.91 27.70 2008 0.91 -0.08 27.48 2007 0.43 0.65 26.97 Mean 0.52 -0.31 27.46 2020 1.4 -0.42 27.32 I actually had mentioned 1959-60 as a "C-tier analog" in the back of my outlook last Fall for the winter because I thought it would be an OK temperature match at times. It was an excellent match in December and then pretty decent in February, despite being a lousy January match. The weird years following the WPO/NAO/Nino 4 would be 1960, 1960, 2008, 2009. That blend has a spatial look somewhat resembling the first two correlation maps. But obviously it's too early for a real guess as to what winter will do. But I do think some years following the strong +WPO, -NAO, very cold Nino 4 combo will end up working for next winter, just because the three things individually (record +WPO winter, ~very cold Nino 4, most -NAO winter in ages) are rare enough even individually.
-
Historic Pacific Northwest Heatwave of 2021
raindancewx replied to donsutherland1's topic in Climate Change
I've been impressed with the semi-constant 47-day cycle repeat since roughly last Fall in the US temperature profile. It's not exactly the same of course. Much more extreme and the cold and hot sources are in slightly different places. But the timing does line up and the look is similar when adjusting for the season. I've always figured part of the reason some heat waves and cold snaps are extreme now is that we are starting to get Spring/Fall type anomalies (+/- 20-40, instead of 10-20) in the shoulder/transitional months of Winter/Summer, when it used to be much harder for that to happen. I've had very warm highs transition to very cold highs transition at the same part of these 47 day cycles since September when near record heat (96) went to near record cold (47) in two days or so. Same thing in October. Current transition from low or mid-90s to low or mid 70s on Sunday or Monday is kind of the June version of it. Low or mid 70s would be near cold highs here for the time of year after hitting 103 earlier in the month, which is relatively close to record warmth (107 in June 1994). -
Severe June 2021 Heatwave in Phoenix and Tucson
raindancewx replied to donsutherland1's topic in Climate Change
I was looking the other day. Since the last big heat wave in the Northwest, Seattle has gone from 30% to 40% or so of homes with air conditioning. You can compare that to 86% of homes in Phoenix with air conditioning. That's why I actually think you may see some deaths from the heat in the Northwest in the coming days. One nice trade off for the synoptic changes happening now is the heat wave is over here, and we're getting a lot of rain the next few days. Any day with a high under 80 is a victory this close to the solstice here. I'll probably head up to one of the mountain towns to experience some early Summer 60s-low 70s.- 33 replies
-
- 1
-

-
- heatwave
- extreme heat event
- (and 5 more)
-
2021-2022 ENSO
raindancewx replied to StormchaserChuck!'s topic in Weather Forecasting and Discussion
Since March, with a major exception for April, the US temperature profile has resembled 2016 at a decent clip. The fierce heat is in a similar location this month for instance. For May, you can see 2016 was pretty cold too. March was very hot with less heat West. Going forward, Nino 3.4 is likely to move toward where it was in 2016. Will be worth watching to see how July and August behave. -
The proposals you see from a lot of the advocacy groups would more than offset any 3% GDP hits. If you taxed oil companies heavily enough, with something like a wealth tax or special income tax, they would pass on the cost to consumers. My personal view is that scientists should stay in their lane, focus on improving your field, and leave social policy to better thinkers. A state like New Mexico gets 40% of tax revenue from an oil. You really want to confiscate that money from a school or a road to lower the temperature of the Earth by a fraction of a degree over a 100 years? It's bad ethics. There are actually states with far more share of their budget coming from oil companies than here. It's not just "states" either, there are entire countries reliant on oil money for their economic development, and their not domestic companies, so the taxes from us, or Biden's proposed "global taxes" would hit them pretty hard. Telling people that they are losing the high paying oil job because a scientist is concerned that the Earth will be hotter in a 100 years is also insane to do politically. We're supposed to be a country where the society at large decides how to proceed. This non-sense with a few people getting to dictate how the entire country is ripe with ethical issues and political illegitimacy. You can see it with COVID too, the governors all magically decided they could do emergency orders without consulting the "people" via the state law makers. I always like the wisdom of the masses, if you asked a bunch of barbers how to come up with solutions for any negative impacts from the climate warming, you'd have a much better solution that stripping states of their oil money, which seems to be your solution via taxing externalities. This obsession with oil companies is also bad ethics and bad economics, since we as a people who drive cars and fly on airplanes demanded that the oil companies provide their product as cheaply as possible. It's the same bullshit as when people talk about how much they care about human rights and they spend three hours on their Chinese slave labor produced Iphone yelling at people on Twitter who won't even pretend to agree. Apple could produce Iphones in the US if you were willing to spend thousands of dollars per phone. The modern world is built on people getting what they want even if they have to make some difficult decisions. It's not always pretty, but the foundation is grounded well. Europe is also far less dynamic than the US with $7-$9 per gallon oil costs per gallon. That type of cost would destroy the US economy. Gas is a low percentage of costs for wealthier people but it would hit poor people and rural people hard. Frankly $640 billion is an irrelevant number and I don't particularly like their method for calculating it either. For a person making $40,000 a 3% hit per year, it's $100 a month. I would call that irrelevant next to the benefits that have been accrued via the processes that warmed the Earth - cars, airplanes, computing power increases, electrical grids, better buildings, and so on. The type of re-invention of society that is proposed to reduce greenhouse gasses would be extremely destabilizing, if for no other reason than it punishes people innocent of any major wrong doing for past mistakes. You're trying to make a moral argument that because of a culmination of past poor lifestyles, modern people have to live less luxuriously to save the Earth. It's the same ethical issue as slave reparations, or when modern Christians attack modern Jews for killing Jesus, or for calling young Germans in 2021 Nazis over something like an EU trade dispute. You're punishing people in the modern world for something you don't like that mostly happened in the past. It doesn't matter if changing the system would solve some of the issues, you're still advocating for a "two wrongs make a right" type of setup. Ethically, the solutions that tell people they can't have the lifestyle they want because of a culmination of mistakes from prior generations amounts to hot garbage in both practical and political terms.
-
Severe June 2021 Heatwave in Phoenix and Tucson
raindancewx replied to donsutherland1's topic in Climate Change
This is one of the largest weather forums in the US, and yet we have literally no active members from the deserts of California or Arizona. Presumably...they just don't care that much. Extreme warmth or not, there is something of a diminishing return to all of this. If you're used to 110 degrees, 115 or 120 doesn't seem like much more. Going from 80 to 90 in May always feels much worse than the 90 to 100 jump for me in June. The warmth forecast in the Northwest is actually much more impressive in that regard. It's hard to argue Phoenix is becoming unlivable or something akin to that when it keeps seeing such rapid population growth. Historically, a lot of strongest western heat waves are bunched together in brief 3-5 periods. So it doesn't really shock me to see another warm period. On net, with the cooler May, it's still easily possible (and likely) we'll have a much colder warm season overall than last year in the Southwest, which was nearly wall to wall hot late April to early September.- 33 replies
-
- 2
-

-
-
- heatwave
- extreme heat event
- (and 5 more)
-
2021-2022 ENSO
raindancewx replied to StormchaserChuck!'s topic in Weather Forecasting and Discussion
The trend on the Euro plume for June actually reminds me a lot of 2012. Although it doesn't "look right" to me either. An El Nino tried to form in Summer 2012. Died in the Fall. That's what the Euro has. I consider 2012-13 a cold-Neutral though for winter, not a La Nina. Against 1951-2010 averages, it was around -0.4C at the coldest point late winter, -0.3 overall. Jan Feb Mar Apr May Jun Jul Aug Sept Oct Nov Dec DJF 2012 25.67 26.08 26.67 27.32 27.61 27.75 27.54 27.32 27.10 26.98 26.86 26.34 26.20 2021 25.54 25.75 26.49 27.10 27.44 60 yr 26.45 26.65 27.13 27.55 27.67 27.47 27.04 26.65 26.54 26.50 26.49 26.45


