
high risk
-
Posts
3,280 -
Joined
-
Last visited
Content Type
Profiles
Blogs
Forums
American Weather
Media Demo
Store
Gallery
Everything posted by high risk
-
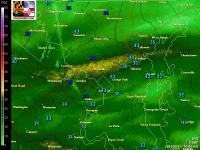
At a time when most storms are ramping down, the cell near Manassas exploded, seemingly aided by a cell merger. Major downburst signal.
-
Initiation ahead of schedule in the local area. Expecting an MD from SPC soon.
-
Yeah, the HRRR develops storms in that general vicinity. NAM Nest develops convection over northern VA
-
They evolve differently, but the HRRR and NAM Nest both like the I-95 corridor in MD around or just after sunset.
-
If today happens, it's going to be a late show.
-
As others have alluded to, the lower dew points yesterday probably led to so much downdraft cape that the damaging winds superseded the heavy rainfall threat. With higher dews today, the HRRR in particular suggests a greater heavy rain threat, although it delays initiation later than several other cams.
-

2026 Mid-Atlantic Severe Storm General Discussion
high risk replied to Kmlwx's topic in Mid Atlantic
Impressive number of reports today in the Mid-Atlantic, but a noticeable hole over northern Virginia.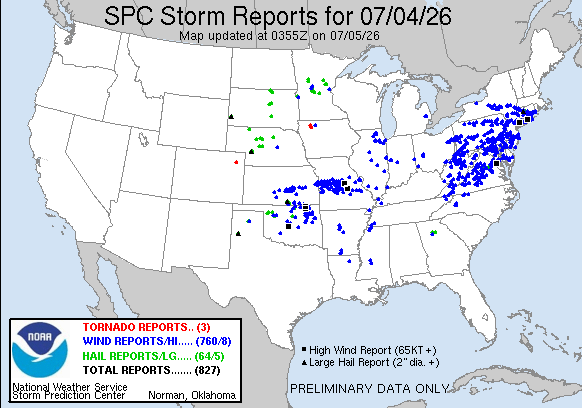
- 1,681 replies
-
- 4
-

-

-
- severe
- thunderstorms
- (and 7 more)
-
Yeah, I have doubts too, but we need to let this play out. Some initiation now in Montgomery County. Outflow boundaries could explode in this environment.
-
WPC heavy rainfall discussion suggests that experimental WoFS guidance really lights up the 95 corridor over the next few hours.
-
If we're not going to use the severe thread, we should rename this thread to include the storm threat.
-
2026 Mid-Atlantic Severe Storm General Discussion
high risk replied to Kmlwx's topic in Mid Atlantic
Dew points have legitimately crashed. That doesn’t seem to be hindering storm development to the west, and irs probably increasing the wind threat (with larger downdraft cape), but it *might* limit coverage a bit.- 1,681 replies
-
- 4
-
-
- severe
- thunderstorms
- (and 7 more)
-
2026 Mid-Atlantic Severe Storm General Discussion
high risk replied to Kmlwx's topic in Mid Atlantic
The lower dew points give me pause for sure, but I feel better seeing that even the HRRR, which overmixes the crap out of our area this afternoon, initiates a modest coverage of storms locally. -
2026 Mid-Atlantic Severe Storm General Discussion
high risk replied to Kmlwx's topic in Mid Atlantic
Wasn't expecting the box to come that far south, but as noted above, there is at least some cam support for it. Also, RRFS going operational is delayed until October. -
2026 Mid-Atlantic Severe Storm General Discussion
high risk replied to Kmlwx's topic in Mid Atlantic
While Friday is indeed capped with no real trigger, there are a couple of CAMs that have a complex of storms dropping south out of PA during the early evening and initiating new storms in our area on the outflow. That said, I'm certainly on board with the prevailing idea of better chances of storms Saturday-Monday with severe and flash flood threats.- 1,681 replies
-
- 5
-
-
- severe
- thunderstorms
- (and 7 more)
-
Would be really nice to be able to lock in a heavy precip event, but there is just too much uncertainty with position of the front, timing of waves, and overall strength of the system. My dream heavy rain scenario is convection along (or just behind) the front later Friday, overrunning showers and storms Friday night, and more elevated convection Saturday with the front hanging around and a shortwave.
-
Nope. The ongoing stratiform rain over us is what I was calling "round 2", and the HRRR seems to have a very good handle on this. After this ends soon, I think we have to wait until tomorrow morning.
-
Morning guidance definitely did not suggest that we’d be screwed north of DC with round 1. But now with round 2 this evening focusing south and tomorrow favoring areas to the south more, I’m very concerned that we’re going to be disappointed with our total.
-
It's a good soaking for most tomorrow morning. And I wouldn't call its forecast for today a fizzle; it's just more isolated with its heavier amounts, and it's a bit of an outlier in that regard.
-
The more backed surface winds and therefore better low-level shear do indeed appear to be more likely to our northeast, but the forecast hodographs for the local area on some guidance do suggest a non-zero tornado threat.
-
2026 Mid-Atlantic Severe Storm General Discussion
high risk replied to Kmlwx's topic in Mid Atlantic
Monday has my attention. The parameter space won't be high end, but we should have modest instability, deep layer shear, and dynamics. Timing of day is good. And there are even suggestions of some low-level shear, potentially eventually leading to 5% TOR outlook.- 1,681 replies
-
- 9
-
-

-
- severe
- thunderstorms
- (and 7 more)
-
2026 Mid-Atlantic Severe Storm General Discussion
high risk replied to Kmlwx's topic in Mid Atlantic
There is some hint of destabilization later today in guidance, and it wouldn't take much with these wind fields, so I don't think we're totally dead. That said, the models have a lousy handle on the ongoing convection, so the idea that we may be too stable is valid.- 1,681 replies
-
- 1
-
-
- severe
- thunderstorms
- (and 7 more)
-
2026 Mid-Atlantic Severe Storm General Discussion
high risk replied to Kmlwx's topic in Mid Atlantic
18z NAM Nest is the first really encouraging run for Thursday. It also seems to justify the outlook for tonight.- 1,681 replies
-
- 1
-
-
- severe
- thunderstorms
- (and 7 more)
-
2026 Mid-Atlantic Severe Storm General Discussion
high risk replied to Kmlwx's topic in Mid Atlantic
Deep westerly flow here is never a good environment for widespread convection. That said, the dew points aren’t progged to lower Thursday afternoon as much as I would have expected, and the RRFS is able to generate a few scattered storms. And any storm in this kinematic environment would be interesting. Still, the best chance of some rainfall might be early Friday as a weak wave moves along the front.- 1,681 replies
-
- 3
-
-
- severe
- thunderstorms
- (and 7 more)
-
2026 Mid-Atlantic Severe Storm General Discussion
high risk replied to Kmlwx's topic in Mid Atlantic
You’re not wrong that there are some factors working against this setup, and there are some legit questions about storm coverage. That said 1) dynamics are much better today - synoptic lift will be overspreading the area later today 2) we’re still several hours from game time for most of us, and better moisture should be arriving 3) while cape will be lower today compared to a few days ago, shear is way better.- 1,681 replies
-
- 6
-
-
- severe
- thunderstorms
- (and 7 more)
-
2026 Mid-Atlantic Severe Storm General Discussion
high risk replied to Kmlwx's topic in Mid Atlantic
Yeah, the HRRR says that parts of our area will have dew points in the upper 50s within the next 2 hours, and I'm very skeptical of that. This is why the HRRR initiates convection later and further east. If it's wrong, storms should initiate somewhere along the Route 15 corridor.

