All Activity
- Past hour
-
2007-2016?
-
I did not use it incorrectly. Those are the straight up global anomalies, using an expanded data set because in scientific principle, denser sample sizes are better - when also stretched out over the longer term, exposes trends that have more confidence. UNLIKE what you are providing in your poorly thought out rebuke, using scanter sizes.
-
They have v6 and v7 options
-
Notice when you combine land and sea anomalies and use a 1995 to 2025 climo base Tips anomaly for March drops from .9 to .04. Data use is important but data can be sometimes not used correctly
.png.5a71ab6db674c8273921e64555e8b6e7.png)
-
I remember reading your post with your thoughts on the March map. I would have shared your thoughts...but pretty interesting to see. whoops, I read past it I saw it just after Steve posted the link
-

2026-2027 El Nino
michsnowfreak replied to Stormchaserchuck1's topic in Weather Forecasting and Discussion
Lmao. That is ridiculous to say in April that the best case for the following winter is strong. That makes it sound like a foregone conclusion, and its not even close. Its going to be hilarious to see this thread if it doesnt even hit strong. The biggest surprise imo will be if it actually IS a "SSSSUUUUPPPPEEEERRRR" super nino, you just dont get supers that close. Itll be even funnier if the eastern troughing pattern continues or at the very least a 3rd year in a row where the winter turns out much colder in the east than the wishing of some here. -
Dude, I put that same link in my post! people just glance over these posts... miss stuff. But definitely knee jerk react. I tell ya, social media engagement is a privilege that about 96% of the population may not be very well suited for
-
I haven't looked into it. I don't really do a lot reanalysis -related look ups. I've been posting the GIS sfc temperature anomaly product from NASA on or around the 10th for the past several months, just for the muse of the fact that we enjoyed what most perceive ...even if not objectively so, a cold snowy winter, yet that was the exception to the vaster rule. It's been an interesting observational journey.
-

Chester County PA - Analytical Battle of Actual vs. Altered Climate Data
chubbs replied to ChescoWx's topic in Climate Change
No I can follow your argument. You are making an argument of incredularity, a common logical fallacy. You can't believe that NCEI could be right. The problem is you don't understand how adjustments are estimated. There is an easy explanation for your list of #. The 1946 and 48 moves are not the only station change at Coatesville. Other station changes occurred before 1948. Adjustments start at the present and work backwards. The most recent Coatesville 1SW data is from 1982. You have to start in 1982 and work back in time. To evaluate the adjustments you have to compare Coatesville to raw data from other stations. Station changes are identified when Coatesville doesn't match other regional stations. Coatesville results by themselves, as you have listed, don't provide any evidence about station adjustments. -
Thanks!! I feel like I had this site bookmarked at one point but probably lost it when something happened with my bookmarks. Curious if they will roll over to ERSSTv6 at some point
-
https://data.giss.nasa.gov/gistemp/maps/
-
Does anyone speak cat to let mine know that she can’t go out today because I put down weed prevention? She’s taught me how to say, “I want to go outside!,” but I’m having trouble responding.
-
Wow, I totally missed that. I'll have to read some more into it. I wonder if this CORe is just a more improved dataset?
-
2026-2027 El Nino
michsnowfreak replied to Stormchaserchuck1's topic in Weather Forecasting and Discussion
I think @40/70 Benchmark was being sarcastic lol. -
Interesting breakdown of the early 2026 anomalies, especially the regional contrasts across North America and Europe. It highlights how short-term cooling pockets can still exist within an overall warm global trend. It will be important to see how ENSO conditions and ocean heat content influence the rest of the year’s temperature progression.
-
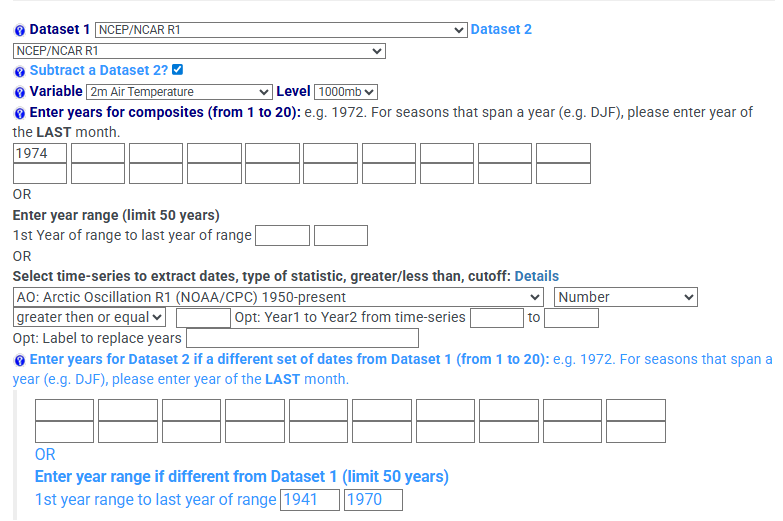
what site can you pull that from? Are you able to choose our own climatology periods or does it provide a list? I've used this https://psl.noaa.gov/data/atmoswrit/map/ You can create your own climatology period by subtracting from dataset two and using the years to subtract. I really like this because say I wanted to look at 1974...it's nice to see how 1974 compared to the 1941-1970 climo instead of just to the current climo (and even better because you can do both and see where the greatest changes have occurred)
-
What is likely going to be a much warmer than normal April is underway. Can see monthly departures of +3.5 to +4.0 by the time April finishes. Sure hope we can get some rain mid to late month because stream and river flow at least over NW NJ from what I have seen is very low. Not much rainfall in sight next 7-10 days. With the warming and dry conditions coming up fire danger is going to elevate quickly. The short term dryness has eased over the last 6 weeks but long term dryness remains. Early call from me is a warmer summer (JJA) with departures of 1.5 to 2.5 degrees for the season and normal to below normal rainfall overall. Of course local T-Storm activity can push some places to above normal. Overall though I am fully expecting a warmer and drier than normal summer season for most.
-
Yeah, that was announced awhile ago, but it looks like a new solution is being offered. Unsure if that is the entire motive/reason for making the move, but they announced this a month or so ago "...Central Operations has announced that the Climate Data Assimilation System (CDAS) will be discontinued in favor of the Conventional Observation Reanalysis (CORe) ..."
-
2026-2027 El Nino
michsnowfreak replied to Stormchaserchuck1's topic in Weather Forecasting and Discussion
Thanks. So we can realistically say super nino winters were: 1877-78, 1888-89, 1957-58, 1965-66, 1972-73, 1982-83, 1991-92, 1997-98, 2015-16. None of these were fun winters, but some were certainly worse than others. Also, no surprise, each winter behaved differently with not just snowfall but more importantly temps. The worst snowfall of the lot (5th worst all-time) was 1965-66, but it was also the 3rd coldest of the lot, and the next worst snowfall (1957-58) was 2nd coldest. Period of record avg snowfall for Detroit is 40.9". The best winters of the lot were 1972-73, 1877-78, 2015-16 and the worst 1965-66, 1957-58, 1982-83. Of course, this is all just for kicks. I do not think we hit super nino. 1877-78: 43.4” 1888-89: 23.2” 1957-58: 18.0” 1965-66: 15.4” 1972-73: 45.0” 1982-83: 20.0” 1991-92: 43.2” 1997-98: 23.4” 2015-16: 35.3” 2023-24: 23.5” -
.png.693f53b2e18d8eb2d29764d95d82d581.png)
-
was going to try and create a composite comparing March to 1971-2000, 1981-2010, and 1991-2020 climo but March 2026 not available yet on the reanalysis page. Also just found out that NCEP/NCAR R1 is being discontinued
-
These days I think are extremely underrated from a scientific aspect. There is something about watching the temps just absolutely sky rocket once mixing gets cranking. It's even more fun when you're in the sun because you can feel the science doing its thing. Love it
-
Today may challenge the diurnal recovery record in the unofficial nerdy Asperger contest...
-
Still looks like we're largely under the influence of high pressure on Sunday though...looks pretty dry. We increase mid-level moisture/clouds through the day. Perhaps some showers late in the day or moreso overnight but I hear soggy and I think rain most of the day
-
Versus 1951 to 2020 who picked these random years