All Activity
- Past hour
-

2025-2026 ENSO
PhiEaglesfan712 replied to 40/70 Benchmark's topic in Weather Forecasting and Discussion
Let's not re-write the weather. Yeah, the first half of April was a bit cool and rainy (but only slightly to the average): 2025-04-01 62 44 53.0 4.0 12 0 0.16 0.0 0 2025-04-02 57 38 47.5 -1.9 17 0 0.02 0.0 0 2025-04-03 76 48 62.0 12.2 3 0 0.04 0.0 0 2025-04-04 71 60 65.5 15.4 0 1 0.88 T 0 2025-04-05 62 49 55.5 5.0 9 0 0.02 0.0 0 2025-04-06 55 48 51.5 0.6 13 0 0.02 0.0 0 2025-04-07 51 41 46.0 -5.3 19 0 0.28 0.0 0 2025-04-08 48 38 43.0 -8.7 22 0 0.00 0.0 0 2025-04-09 50 33 41.5 -10.6 23 0 0.00 0.0 0 2025-04-10 54 42 48.0 -4.5 17 0 T 0.0 0 2025-04-11 48 42 45.0 -7.9 20 0 1.24 0.0 0 2025-04-12 45 38 41.5 -11.8 23 0 0.14 0.0 0 But as you can see, after the 12th, it turns very hot and dry (only 0.03 inches of rain after the Nor'easter): 2025-04-13 62 42 52.0 -1.6 13 0 0.00 0.0 0 2025-04-14 70 44 57.0 3.0 8 0 T 0.0 0 2025-04-15 69 48 58.5 4.1 6 0 T 0.0 0 2025-04-16 57 44 50.5 -4.3 14 0 0.00 0.0 0 2025-04-17 63 37 50.0 -5.2 15 0 0.00 0.0 0 2025-04-18 72 42 57.0 1.5 8 0 0.00 0.0 0 2025-04-19 80 63 71.5 15.6 0 7 0.00 0.0 0 2025-04-20 73 51 62.0 5.7 3 0 0.00 0.0 0 2025-04-21 66 50 58.0 1.4 7 0 T 0.0 0 2025-04-22 80 53 66.5 9.5 0 2 0.00 0.0 0 2025-04-23 77 54 65.5 8.2 0 1 0.00 0.0 0 2025-04-24 79 50 64.5 6.8 0 0 0.00 0.0 0 2025-04-25 79 51 65.0 7.0 0 0 T 0.0 0 2025-04-26 75 53 64.0 5.6 1 0 0.03 0.0 0 2025-04-27 72 50 61.0 2.3 4 0 0.00 0.0 0 2025-04-28 75 47 61.0 2.0 4 0 0.00 0.0 0 2025-04-29 83 50 66.5 7.1 0 2 0.00 0.0 0 2025-04-30 80 57 68.5 8.8 0 4 T 0.0 0 The cold pattern, outside of a few hiccups, ended just after the 2/20 snow event. From about the last week of February until mid-May was mostly warm. Only around mid-May did we turn cold. 2025-05-01 81 54 67.5 7.5 0 3 0.00 0.0 0 2025-05-02 86 59 72.5 12.2 0 8 0.00 0.0 0 2025-05-03 85 64 74.5 13.9 0 10 0.04 0.0 0 2025-05-04 73 63 68.0 7.1 0 3 0.12 0.0 0 2025-05-05 73 61 67.0 5.8 0 2 T 0.0 0 2025-05-06 81 61 71.0 9.5 0 6 0.03 0.0 0 2025-05-07 75 60 67.5 5.7 0 3 T 0.0 0 2025-05-08 81 59 70.0 7.9 0 5 T 0.0 0 2025-05-09 64 51 57.5 -4.8 7 0 0.18 0.0 0 2025-05-10 74 49 61.5 -1.1 3 0 0.00 0.0 0 2025-05-11 82 55 68.5 5.6 0 4 0.00 0.0 0 2025-05-12 83 55 69.0 5.8 0 4 0.00 0.0 0 2025-05-13 71 62 66.5 3.1 0 2 0.28 0.0 0 2025-05-14 66 59 62.5 -1.2 2 0 1.30 0.0 0 2025-05-15 77 63 70.0 6.0 0 5 0.03 0.0 0 2025-05-16 77 60 68.5 4.2 0 4 1.50 0.0 0 2025-05-17 86 62 74.0 9.4 0 9 T 0.0 0 2025-05-18 77 64 70.5 5.7 0 6 0.00 0.0 0 Pretty clearly you can see the pattern change from warm to cold: 2025-05-19 71 56 63.5 -1.6 1 0 0.00 0.0 0 2025-05-20 69 50 59.5 -5.9 5 0 0.00 0.0 0 2025-05-21 57 52 54.5 -11.2 10 0 0.45 0.0 0 2025-05-22 56 51 53.5 -12.5 11 0 0.56 0.0 0 2025-05-23 69 51 60.0 -6.3 5 0 T 0.0 0 2025-05-24 68 50 59.0 -7.5 6 0 T 0.0 0 2025-05-25 71 52 61.5 -5.3 3 0 0.00 0.0 0 2025-05-26 75 53 64.0 -3.1 1 0 0.00 0.0 0 2025-05-27 74 54 64.0 -3.4 1 0 0.01 0.0 0 2025-05-28 59 53 56.0 -11.7 9 0 0.77 0.0 0 2025-05-29 74 57 65.5 -2.6 0 1 0.01 0.0 0 2025-05-30 79 63 71.0 2.6 0 6 0.88 0.0 0 2025-05-31 75 55 65.0 -3.7 0 0 0.06 0.0 0 -
Yay some sanity has been restored !! 1993 at the top of the 100+ list lol. 1949 is a close second !!
-

-
Clouds look to linger through Tue afternoon. Wed looks to clear out and low- mid 80s. Thursday is the hot day this week but could see some storms later in the day.
-
Newark 100 degree day season leaders 1993 1 9 1949 2 8 2022 3 6 1953 3 6 1988 5 5 1966 5 5 2011 7 4 2010 7 4 1955 7 4 1944 7 4 2012 11 3 2006 11 3 2005 11 3 2001 11 3 1999 11 3 1911 11 3 2024 17 2 2021 17 2 2013 17 2 2002 17 2 1997 17 2 1994 17 2 1991 17 2 1980 17 2 1977 17 2 1954 17 2 1948 17 2 1943 17 2 1936 17 2 1919 17 2 1901 17 2 1898 17 2
-
wait, is that Forky haha?
-
99 would be a huge disappointment....
-
2006 doesn't even make the list for the hottest summers lol lol how are 1948 and 1949 at the bottom of the list, they were much hotter at NYC, JFK and EWR. This goes to my idea that LGA heated up with more car traffic, there was clearly much less traffic in the late 40s, so LGA was cooler than the other sites. 1993 isn't on this list at all, when EWR had 9, NYC had 3 and JFK had 2 days of 100+? LGA doesn't match my climate experience at all, EWR is a much closer match actually.
-
are we even sure we're getting *heat*? I just saw the forecast now says the sun won't come out until next Thursday (why do I feel like Annie, saying that out loud in my head lol.) And now we have a phantom rainstorm on Wednesday which didn't exist before now? I thought something can't be created from nothing-- where did this phantom rainstorm come from?
-
only one 80 degree in March (the last day of the month and only for the first half of that day) and cool and rainy for April (yuck).
-
He forgot about our cool and rainy April lol
-
April was extremely cool and rainy and please don't give me the bogus average temp *stat*
-
Light rain moving through the same areas as yesterday 0.22 in the bucket today (so far) total from the ugliness is 0.84
-
LGA 100 degree days season leaders 2006 1 4 1955 1 4 1953 3 3 2013 4 2 2010 4 2 2005 4 2 1999 4 2 1991 4 2 1966 4 2 2021 10 1 2019 10 1 2017 10 1 2012 10 1 2011 10 1 2008 10 1 2001 10 1 1995 10 1 1957 10 1 1952 10 1 1949 10 1 1948 10 1
-
Next week looks crazy
-
-
The latest Euro Weeklies, which go through July 13th, have mainly quiet in the Atlantic basin and near normal ACE in the E and W Pacific. If there are no TCs by July 13th, this would mean the quietest start in the Atlantic since 2009! Other years with no NS through July 13th since 1995 were 1998, 2000, 2002, and 2004. I really wish I could say otherwise (I’d love to finally see a weak season), but I still expect an above normal season. The Atlantic tropics, though not nearly as warm as 2003-4, are still plenty warm enough and expected to continue that way. Also, we’re looking at a ~weak La Niña during ASO per RONI.
-
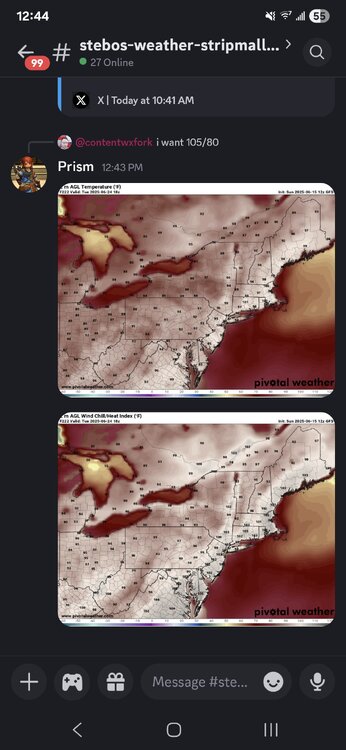
...Stick to the ensembles means from this range re the more important/obvious heat signal in debate. One day shot on Thursday ahead of shallow fropa, with limited backside CAA support. The, synoptic systemic circulation changes that will surge a ridge after ~ D6..7 That much is higher than climo confidence. Exact amplitude and/or interfering nuance notwithstanding... The 00z ensemble means of all three majors were incrementally improved on the heat signal comparing the prior 12z run, which was also incrementally improved on the previous 00z's means. The trend is clad, and is a spatial representation of what the numerical teleconnection correlate: PNA to -1 SD/-summer EPO/ + fluctuating NAO. The operational runs will vacillate between better and worse correlated synoptics for the next several day's worth of run cycles. Probably mid/late week they start coming to a consensus. Two notes: One, amplitude bias at this range is a real model issue. We've big signals start subtly lowering amplitude as we near enough to know this possibility lurks. Two, somewhat in conflict of that notion, we seem to emerge this heat signal above on top of the solstic, and also, evidenced is S/W/ Sonoran heat release. **This is a candidate for synergistic heat event**, but we won't get a sense for confidence in that from this range. Also, we may see a pattern entrance MCS vulnerability late this week or over the weekend as an early guess/surmise, with rapidly rising heights and a NW geostrophic wind over top WSW transport/differential theta-e advection underneath.
-
Lol I just saw it now
-

2025 Atlantic Hurricane Season
WxWatcher007 replied to BarryStantonGBP's topic in Tropical Headquarters
All the vorticity that could’ve become a seedling for TC development has stayed in the EPAC, which has led to a furious start over there. The Atlantic window is probably closed for the foreseeable future, at least in the western Caribbean and Gulf. -
All the vorticity that could’ve become a seedling for TC development has stayed in the EPAC, which has led to a furious start over there. The Atlantic window is probably closed for the foreseeable future, at least in the western Caribbean and Gulf.
-
65 and full sun with a breeze at the moment in Newburyport MA.
-
There are things in life to be miserable over. Weather isn’t one of those. It always changing whether we want it to or not.
-
Can we get one of these for Nassau County too? I am consistently hotter than JFK even though I'm considered to be on the *south shore* 1 mile south of Sunrise Highway but north of the barrier islands by over 2 miles.
-
I don't think anyone gets these fabled sea breezes unless they live on the barrier islands like Long Beach. For a sea breeze to get where I am at, it has to be at least 20 mph otherwise it only comes in after the high temperature has already been reached. That's how I know there was no sea breeze here last Thursday, the highest temperature was recorded at 4:30 PM. We can easily hit 100 on a SW wind here in July. The temperature drops after 3 pm but the high of 100+ is reached around 1 pm.