

GaWx
-
Posts
18,762 -
Joined
About GaWx

Recent Profile Visitors


-
2026-2027 Super El Nino
GaWx replied to Stormchaserchuck1's topic in Weather Forecasting and Discussion
Note that Nino 3 anomalies are stronger than Nino 1+2. So, this prog isn’t severely E based as of 2/1/27. -
2026-2027 Super El Nino
GaWx replied to Stormchaserchuck1's topic in Weather Forecasting and Discussion
1877-8 followed by cold neutral and then weak La Nina 1888-9 followed by strong La Niña and then weak La Niña But in neither of these cases were they immediately preceded by La Niña like ‘26. -
2026-2027 Super El Nino
GaWx replied to Stormchaserchuck1's topic in Weather Forecasting and Discussion
Thanks. Some of us have already been discussing ‘26-7 vs ‘97-8. On Saturday I posted that per the Euro progs, ‘26-7 is looking to evolve into a much less E based Nino than ‘97-8, which became the most E based Nino on record (back to 1951-2). When I refer to E based, I’m referring to the differences between 1+2 and 3 vs 3.4 and 4. This is what I posted: More on 97. Here were the monthlies: 1+2 3 4 3.4 1997 6 26.12 3.00 28.13 1.51 29.23 0.26 28.82 1.09 1997 7 25.59 3.63 27.90 2.09 29.37 0.47 28.86 1.56 1997 8 24.96 3.96 27.71 2.59 29.29 0.50 28.75 1.89 1997 9 24.69 3.96 27.74 2.84 29.44 0.68 28.85 2.13 1997 10 24.69 3.67 28.06 3.08 29.34 0.58 29.08 2.36 1997 11 26.12 4.47 28.37 3.27 29.39 0.69 29.12 2.41 1997 12 27.06 4.25 28.53 3.30 29.11 0.57 28.89 2.29 1998 1 28.12 3.55 28.74 3.08 28.95 0.64 28.93 2.38 1998 2 28.74 2.64 28.90 2.49 28.79 0.59 28.78 2.03 1+2 (peak 4.47) and 3 (peak 3.3) were way, way stronger than 4, which remained just wk (peak 0.69) and even way stronger than 3.4 (peak 2.41)! The forecast for ‘26 is much stronger in 3.4/4 and stronger in 3, but not as strong in 1+2: Per latest Euro, here are peak non-rel. monthlies: 1+2: 3.9 3: 3.9 3.4: 3.7 4: 2.4 That’s only a contrast of 1.5 from E to W compared to 3.8 in ‘97! And contrast from 1+2 to 3.4 is a mere 0.2 vs 2.1 in ‘97!! So, the prog is for ‘26 to be E based but way more balanced and thus not nearly as E based as the extremely E based ‘97. -
Since yesterday, the non-AI ensemble progged Gulf tropical activity has diminished other than for perhaps the Bay of Campeche, which would be favored to landfall in MX. (The AI never picked up on anything much.)
-
Do you have this map for other states in the SE? TIA
-
2026-2027 Super El Nino
GaWx replied to Stormchaserchuck1's topic in Weather Forecasting and Discussion
Thanks, Chris -Long range model winter forecasts have, indeed, tended to be too cold on average based on my recollection although the Euro has missed on both sides. So, I wouldn’t be shocked if 25-6 also comes in warmer than today’s forecast, but that remains to be seen. -But keep in mind that you essentially are showing a super Nino sample size of just one (2015-6 done in August) since 2023-4 wasn’t a true super (RONI peaked at only +1.49). ONI had ~0.5C excess due to very warm surrounding tropical waters from GW inflating the ONI. -Also, other super Ninos had a fairly similar temp. pattern to what the NMME shows overall. -
2026-2027 Super El Nino
GaWx replied to Stormchaserchuck1's topic in Weather Forecasting and Discussion
-Unlike Cansips, these NMME maps look typical/more believable for a strong Nino. -The strong Nino very typical wetness (starting as early as Oct on this run but I usually bank on the start in Nov) gives a lot of hope that the bad but somewhat improved drought in the SE will be mainly history by mid to late winter. - These maps are consistent with the El Niño winters that had one major to possibly historic SE US snowstorm like has occurred in many El Niños. -
2026-2027 Super El Nino
GaWx replied to Stormchaserchuck1's topic in Weather Forecasting and Discussion
Nino 3.4 warmed only 0.2 in today’s release for last week averaged out vs the prior week from 0.5 to 0.7 vs my guess based on daily OISST levels/changes of it warming 0.3 (from 0.5 to 0.8). But this difference could possibly be mainly due to rounding. For example, perhaps the prior week was, say, +0.46 vs last week being, say, +0.74 or whatever. It has gotten more E based the last 5 weeks but (as per what I recently posted) the Euro doesn’t have it getting more E based overall from this point forward and thus keeps it from getting anywhere near as E based as 1997-8: 1+2 3 3.4 4 29APR2026 0.6 0.4 0.4 0.5 06MAY2026 1.0 0.5 0.4 0.5 13MAY2026 1.3 0.6 0.4 0.6 20MAY2026 1.6 0.7 0.5 0.6 27MAY2026 1.7 0.8 0.5 0.7 03JUN2026 2.1 1.0 0.7 0.7 -
Thanks. I realize that the RDU sensor is often a hot spot under sunshine in the warm season per past discussions I’ve read here and elsewhere. Do you know if your house had temps that jumped around ~6 F within just a few minutes of 3 PM? That seems very high with little change in sky condition (mostly sunny as opposed to large amounts of cloud cover suddenly moving in or out) and no big wind direction shift!
-
Fake news from RDU??TODAY MAXIMUM 99 259 PM CLI from KRAH ——————-NORTH CAROLINA WEATHER ROUNDUP NATIONAL WEATHER SERVICE RALEIGH NC 300 PM EDT SUN JUN 07 2026 RALEIGH-DURHAM MOSUNNY 93 57 29 VRB3 29.93F RWR from KRAH ——————-So, the 99 high was recorded at 2:59PM whereas the 3PM hourly reading was only 93. Sure, yeah right. This is truly bizarre! And the 99 seemed too high when considering surrounding stations!
-
2026-2027 Super El Nino
GaWx replied to Stormchaserchuck1's topic in Weather Forecasting and Discussion
Are we headed for another 2023-4 where SSTs are warm around Australia? Per JB, the models that showed for winter 2023-4 at H5 the mean E US trough/Aleutian low (most of them) didn’t have it that warm there and thus he blamed the unforecasted warmth around Australia. -
2026-2027 Super El Nino
GaWx replied to Stormchaserchuck1's topic in Weather Forecasting and Discussion
After a very strong warming the prior 5 days averaging a very impressive 0.1C/day, the latest OISST 3.4 finally slowed its warming although it still warmed slightly (.014). Now that the full week’s data is in, I’m guessing 3.4 will be warmed by 0.3C to +0.8C in tomorrow’s release: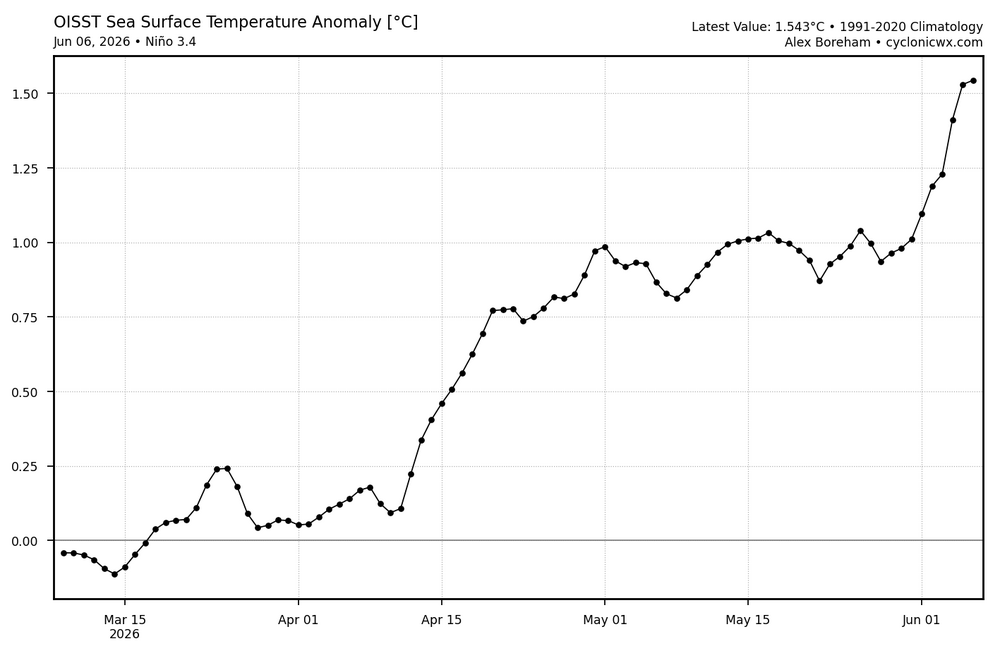
-
2026-2027 Super El Nino
GaWx replied to Stormchaserchuck1's topic in Weather Forecasting and Discussion
The MJO ended up going strongly into phase 8 (see image below) after all despite models a couple of weeks ago going only modestly into it and extended ensembles a month ago turning left in 7 toward the circle/missing 8. Bastardi back in April predicted W Car/Gulf TCG in June based on his expectation the MJO would go into 8 despite the extended ensembles not showing that. He more often than not predicts early activity. So, that’s not unusual. But he was right about the MJO. Will he be right about the Atlantic basin June TCG? Models/ensembles are hinting at the chance for this late this week:
-
2026-2027 Super El Nino
GaWx replied to Stormchaserchuck1's topic in Weather Forecasting and Discussion
Thanks, snowman. A key will be to see whether or not 3.4/4 fall severely behind regions 3/1+2 to determine whether or not this will be a very strong form of E based. For those who prefer it be/not be overly E based like ‘97, you’ll want 3.4 to not warm too steadily/keep warming steadily through the summer/early fall overall. -
The Memorial PGA event, hosted by Jack Nicklaus, in Dublin, OH, has a Hickory, NC native, JT Poston, with a big 4 shot lead over Raleigh, NC native Ryan Gerard headed into rd 4. The Memorial is easily considered a top 3 event in terms of field, prestige, and difficulty of course after the Majors/TPC. Yesterday it not only had 2 rain delays, it had from a supercell penny sized hail falling live on TV! That’s a first for me to see at any golf tourney. One thing that contributes to my enjoyment of watching golf is the strong wx influence.


