

Typhoon Tip
-
Posts
43,368 -
Joined
-
Last visited
Content Type
Profiles
Blogs
Forums
American Weather
Media Demo
Store
Gallery
Everything posted by Typhoon Tip
-
Doesn't get much better than this ...
-
And I've never seen anyone obsessively attempt to sell non-objective reality like you, either. But..it's okay. We know your the class goof-ball and it's all fun.
-
-
questionable
-
Beat MOS by 3 and 5 deg respectively with our 73 here today. Yet watching the sun set on this splendor tomorrow evening will be like farewell to a fondest love.
-
I feel like the models are negotiating how we're gonna get screwed .. with BDs on this day, no that day ... no, we mean this day game every couple of runs. Instead of just not screwing us. Get it? like, one way or the other, you're getting screwed? Technically there's a ridge over eastern N/A mid latitudes, but these heat crippling nuances keep getting sent down stream along 50 N.
-
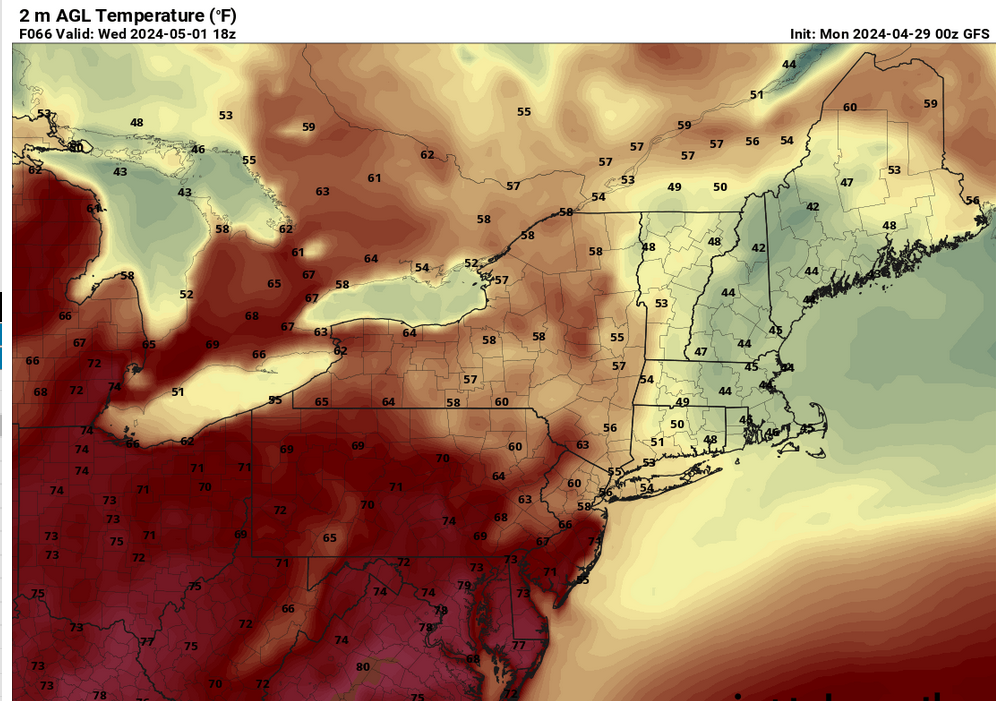
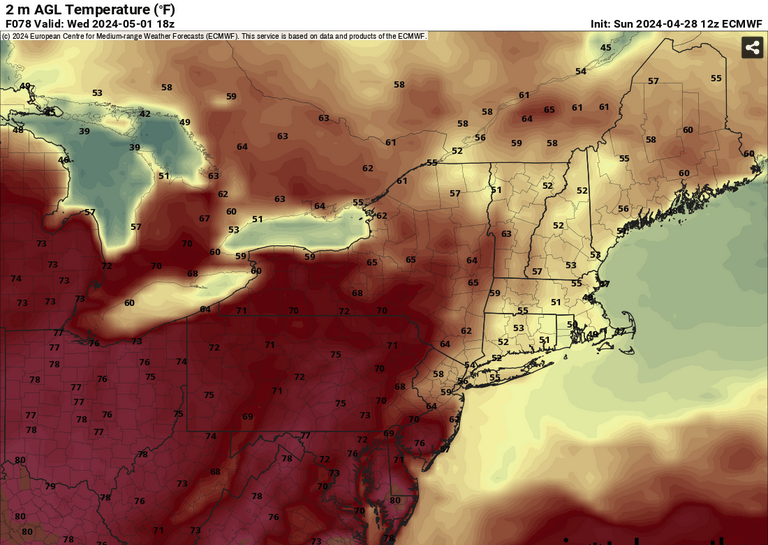
It looks at 500 mb like a warm ( relative to season..) time of it Mon-Wed but nuanced details in the flow are teaming up to crumble and compact it S such that it won't get NE of NYC. Hasn't verified yet of course but being April .. heh. Just pick a 2-m temp product and loop it and you can see this walling off is persistent right through the period. Obviously ...being 70 at all isn't terrible, no .. .but we're not part of the cool kids. Lol. Plus, some models like the GFS have a day in the 40s into NE zones while it's over 70 at EWR. The basal pattern is coherently different in the models beyond that though. We're not likely to see these deep radiator nights in that look. Cool will come from back packing E Canada/Maritime air, with lows actually modestly above normal after afternoons around 55 ...should BD air mass violation occur. But when the sun shines and the wind were ever to turn around ... you're 70 pretty fast. The 850 mb general thermal layout has seen the last of sub 0C S of border latitudes ( in general) without any means to really bring that back, both in what's left of telecon statistics ( fading for the season ) and in the ensemble mean spatial synoptics. It should be seasonal to modestly AN for 10 days beginning tomorrow. Which frankly is a relative win for those of us that truly hate and despise 29 F mornings after probationary afternoon "warmth"'s phony sense of liberation from winter. On a personal note... on Nov 3 I'm gung ho for any symbolic gesture the weather can muster to signify the impending season. Diametrically opposed to that now. But no one ask.
-
That's a multiple vortex event. The meso is subtended so far below the cloud base that the eikman potential/drag forces it's circulation radius to fold inward; thus splits into several subsidiary vortices all rotating around a common axis, each "suction spot" can have winds in access of 180 mph Very deadly...
-
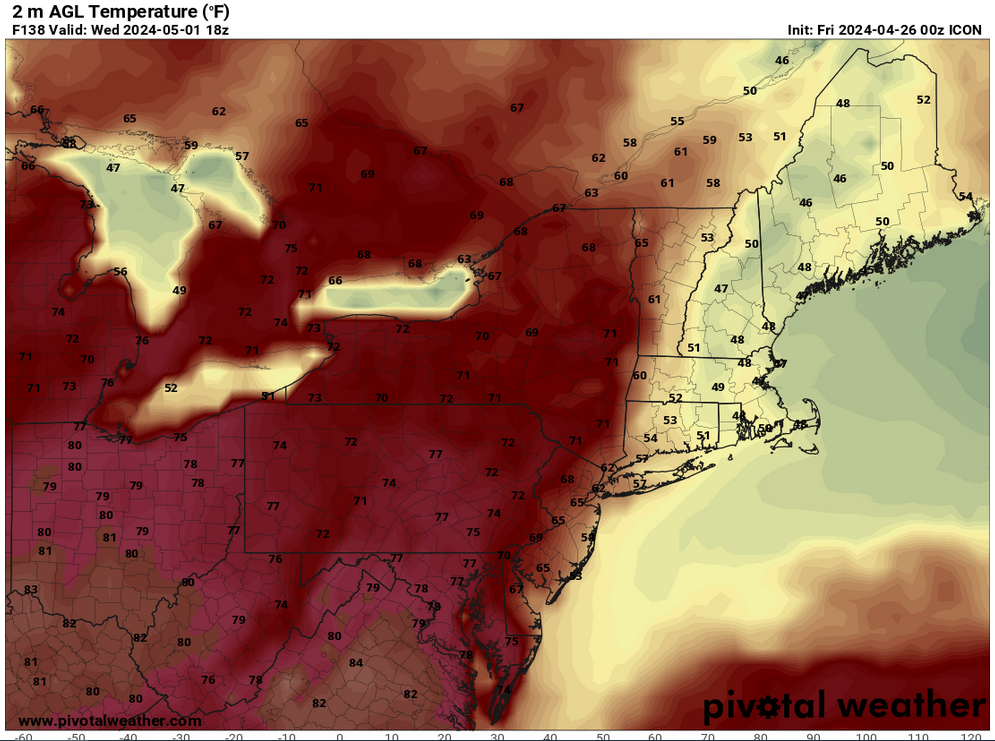
Hypothesis of mine: the GFS has poor physics in it's make up during transitioning from winter into summer solar incidences. It seems to be doing this on this run. It seems unlikely those thicknesses will drape like that indefinitely like this run does that. The sun will obliterate that lower tropospheric thermal structure pretty fast there. The way it to make it cool and stay cool in May is to drive the east wind. That's more of a COL medium as the GFS has that layout.
-
You have either a BD on Monday, or the materialization of a front under us that would be more like 'defaulting' us on the N side of a front. But having to contend with that was obvious going back a couple of day's worth of guidance imho. I still haven't seen much reason since to go against, not when looking at both the forecast' synoptics and considering our sore-butt climo in the spring.
-
It's been shaky anyway, regardless of model. Don't try to tell Kevin that. LOL. It's not surprising when given any excuse to do so, the GFS in particular will always bulldoze warm ups
-
Classic spring na na na-na na pattern
-
pretty impressive sun telling the atmosphere who's daddy temperature rises going on. 28 to 48 here in 1 1/2 hrs is quite impressive for a stasis air mass only being modulated by solar radiation alone. And doing so on the front side of the daylight when the sun angle is still climbing, nothwithstanding ... As Kevina pointed out, elevations south of Central NE were likely spared the harshest freeze tinging; ORH low was 36. FIT was 28.
-
Just because you said that ... we are now BD'ed under a stable convention toxicity until July 10
-
Do you mean 'machine -based' guidance products, like MOS? I've often wondered if they stage the raw models to 'coax' them into 'admitting' the season is in fact changing ha. No but sometimes, particularly with the GFS ..., it seems any given extended range on March 15 - ~ April 15 or so, the model regresses whatever is happening back to Feb 15. It's really very annoying if ever the GGEM and Euro and the ens systems all flagging the first sig spring warm up and the GFS is creating ice storms. But that aside, the MOS products I think are weighted to climo farther out in time. Not sure the 24 -hour ones are weighted as much, tho. interesting
-
Haha... you're whole post could just be the bold. Nothing else LOL
-
things lookin' pretty good in the long range for warm enthusiasts ...
-
54/16 desertification
-
I was actually buckin' for 58 in Tolland, and 78 in Danbury
-
GFS is pretty weak with it on this run anyway. Confident there'll be a BD if not non-committal warm boundary in the area early this week. Question is how meaningful it will be to sensible weather. Conventional experience/history tells us the sorest butt relative to all indicators is the safer lean but there's always hope - again, albeit quite rare, ...I have seen these kind of synoptic outlooks break more favorable so it's not impossible. I just don't wanna end up 47 under slate grays sky while it's 84 in Newark NJ
-
At this moment, in the actual charts that people actually 'look at,' Sunday has the best potential for a W wind warm day - sun assisted. That said, even it is somewhat laced with uncertainty because a diffused warm boundary is attempting to smear through the area overnight, Saturday night, and the models are not making it abundantly clear whether that passes cleanly off or doesn't stall in the area. Some models have QPF dappled in the area. Seems to be trending toward less of that taint so ... it may end up more partly sunny with warm advection entrails around and temps rising over machine guidance -type day. But that ill-described WF seems to be the impetus for screwing up Monday. The discrete analysis of the pressure pattern over our region on Monday look less like a BD actual passage and more like one that materializes S, which gives an impression that for all of us NE of mid NJ ... it is more like 'defaulting' the area on the N side. There is an upshot to that, it's not a BD with a face smacking cold whip. Fronts that come through with jolt chilling wind gusts and a strata ceiling rendering what was once a warm sunny afternoon to a dreary gray, 32 F temperature plummet ... happen when they formulate NE from a cold origin, then mixing in Labrador urine along the way. And it all takes place within an hr or less. We've seen this more times than can be counted in memory since being alive. The upshot is that a BD already south, places us in an already homogenized air mass, so not quite as harsh as being as being 'back-doored' by a horny Labrador The problem is that the gradient is really weak at this far eastern end of that warm frontal miasma. It's one reason why the front is amorphously defined... but, it all means there is limited momentum to actually bring it through. So it stalls in the area ... The rest is topographical. High terrain W-N, has a built in counter current at all time pointing back SW, east of said elevations at lower levels - it's a geographically fixed unmovable, always in place, consequence about New England. I "think" the models are just allowing that vector as the only remaining forcing - and so they are kind of like formulating a BD pattern in position. it's interesting. Beyond that the week is less confident. Yesterday it looked like ( as is usually the case with BD climo - ) any wedging would be blown out by Tuesday late as a weakening frontal structure cleans out. It would actually have been warmer ( potentially) after that, with lower thicknesses, being offset with katabatic flow type and high clear blazing sun... etc. But last night's Euro abruptly obtruded a much strong trough with that... Meanwhile, the GGEM and the GFS are closing off a cold spring pig shits low between here and NS. Either scenario is bad for warm enthusiasts. 7 days out though...
-
Agreed
-
I think Kevin must be using his installs to actually heat his home ? hahahaha
-
Yeah Scott, next week's warm up may not happen NE of mid New Jersey... Oh it will at 2,500ft but anything underneath that ~ altitude is outside the party listening to grooving music and good looking people through the wall of the BD front. Sorry Kevin, you're not invited
-
It will be colder tonight than last night. ... there is no argument


