GaWx
-
Posts
19,016 -
Joined
Content Type
Profiles
Blogs
Forums
American Weather
Media Demo
Store
Gallery
Everything posted by GaWx
-
I appreciate your work and optimism about a -NAO this winter since I'm also a winter lover and thus hope you're right. Over the last 44 winters, -NAOs (I define as sub -0.25) for DJF have been few and far between: 1984-5: (NAO -0.70) (moderate La Niña) headed down in cycle 21 with limited sunspots averaging only 20/month; this was 20 months before the minimum of Sept 1986 1986-7: (NAO -0.30) (moderate El Niño) very early in cycle 22 four months after the Sept 86 minimum with very limited sunspots of only 6/month 1995-6: (NAO -0.62) (moderate La Niña) headed down in cycle 22 with limited sunspots of only 12/month nine months before Sept 1996 minimum 2009-10: (NAO -1.67) (strong El Niño) one year into cycle 24 at 13 months after the Dec 2008 minimum just starting to head upward but with still limited sunspots of only 22/month 2010-11: (NAO -0.68) (strong La Niña) two years into cycle 24 at 25 months after the Dec 2008 minimum headed further up but still low at 33/month 2020-1: (NAO -0.42) (moderate La Niña) early into cycle 25 at 13 months after the Dec of 2019 minimum just starting to head up but still with limited sunspots of only 14/month --------------------- Note that there has been either one or two -NAO winters during each of the last four quiet portions of the cycles! So, based on the last 44 years of -NAO winters, the data clearly shows that being within two years of a minimum (ascending or descending) along with limited sunspots (so, nowhere near a cycle max) has given the best chance for a -NAO winter. The average distance from minimum was only 14 months. So, for these last six -NAO winters, the average monthly sunspots were all low to very low: 20, 6, 12, 22, 33, and 14 for an average of only 18. This 18 compares to the longtime average monthly sunspots of 85 (based on 1900-2022 data). --------- Where are we going to be in the current solar cycle this winter? 49 months past the prior minimum (Dec of 2019), which is much closer to the upcoming maximum than the prior minimum. We're at 134/month so far in 2023 with it rising. So, per extrapolation, there's a very good chance that this winter will be 150+ or not far from twice the longterm average of 85. So, very high sunspot activity nearing a maximum is quite likely. So, if this winter were to have a -NAO, it would be practically totally opposite of the others over the last 44 years regarding the solar cycle. This along with there being a -NAO (sub -0.25) during only 1/7 of the last 44 winters and only one of the last 12 winters tells me that anyone who doesn't predict a winter -NAO often but is doing so this winter would deserve major kudos if a -NAO were to verify since the odds seem to me to be so stacked against it. Thus, it will quite interesting to see what happens this winter, -NAO or not. As a winter lover, I'd love to see the recently rare -NAO. I'll probably later also post this in the winter prediction thread. Monthly NAO since 1950: https://www.cpc.ncep.noaa.gov/products/precip/CWlink/pna/norm.nao.monthly.b5001.current.ascii.table Monthly sunspots: https://www.sidc.be/SILSO/DATA/SN_m_tot_V2.0.txt
-
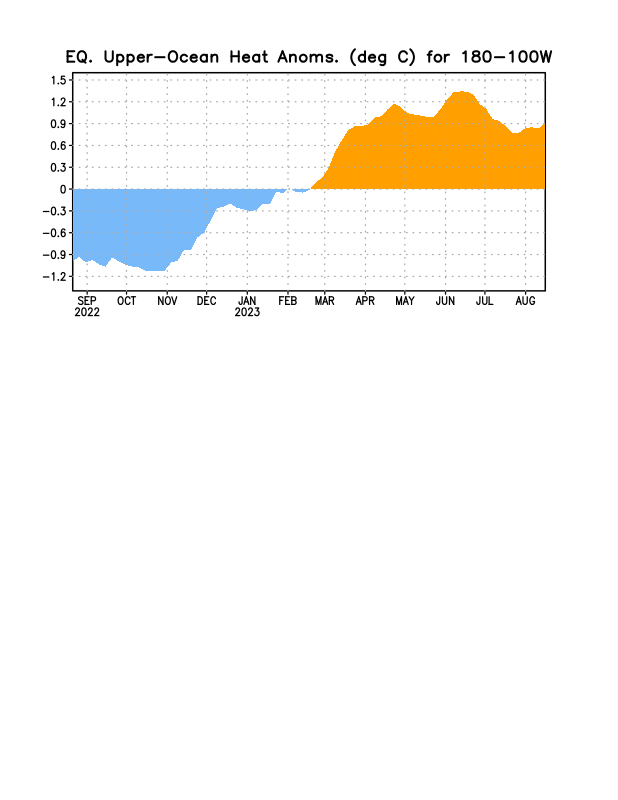
Per the graph below and consistent with your animation, it does appear to me like it may finally be starting to reaccelerate upward. Your animation ends about four days (your last image centered on 8/20) after the graph below, which ends near 8/16. I continue to expect a significant OHC rebound over the next few months (likely to new highs for this El Niño), which would be needed to support the Nino 3.4 ONI peak of +2.0+ that I now think is likely (70% chance):

-
Report: Another Year of Record Heat for the Oceans
GaWx replied to donsutherland1's topic in Climate Change
I just checked the Key West Buoy's SST and it is all of the way down to 87F, down 5F from just over two weeks ago! After being warmer than the coral bleaching SST of ~87.3F since mid June at Key West and peaking in the high 92s on the hottest days, it has finally cooled to just below that crucial temperature and is now just under 87F! Some good news that probably won't be reported by many news outlets. Let's see how long it will stay down in that vicinity. https://www.ndbc.noaa.gov/station_page.php?station=kywf1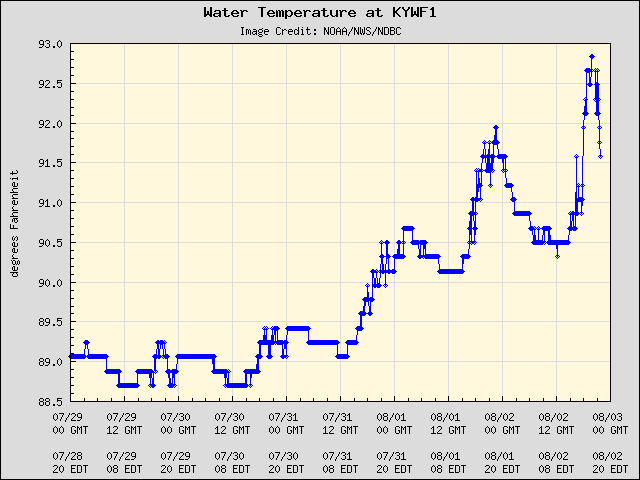
-
Don was impressive and an overachiever vs expectations.
-
@donsutherland1 Do you happen to have any feel yet for where you expect the very crucial NAO to be this DJF? I'm asking you because I recently had looked at several 2019-20 winter forecast threads and you were the only one I saw who explicitly called for a +NAO, which we know verified quite well: Strongest +NAO DJF since 1950: 2014-5: +1.66 2011-2: +1.37 1994-5: +1.36 2015-6: +1.31 1999-0: +1.30 2017-18: +1.30 2019-0: +1.27 1988-9: +1.26 1993-4: +1.02 2021-2: +1.02 -all 10 since 1988-9 -6 of the 10 since 2011-2 -NAO (sub -0.25) DJF since 1950-1: - 22 of them (30% of winters since 1950-1) - 16 of these 22 were between 1954-5 and 1978-9 (~50% of winters during that period) - Only 4 of the 22 sub -0.25 winters were after 1986-7 (11% of winters since 1987-8): 1995-6, 2009-10, 2010-1, and 2020-1 - So, only 1 of the last 12 winters (8%) sub -0.25 - Why has there been such a strong tendency away from -NAO winters since 1987-8? Could it be the +AMO? GW? - Is anyone yet predicting a sub -0.25 NAO for the upcoming DJF? If so, based on what?
-
Indeed, the models suggest it will eventually move away from strongly east based like it is now. But in the meantime it will take a good bit of time since it is so strongly east based now and thus they suggest Nino 3 anomalies will likely still be warmer than 3.4 through Dec with them perhaps getting close together in Jan and maybe matching each other in Feb. Nino 4 anomalies remain cooler than Nino 3.4 through Jan. on all of the models.
-
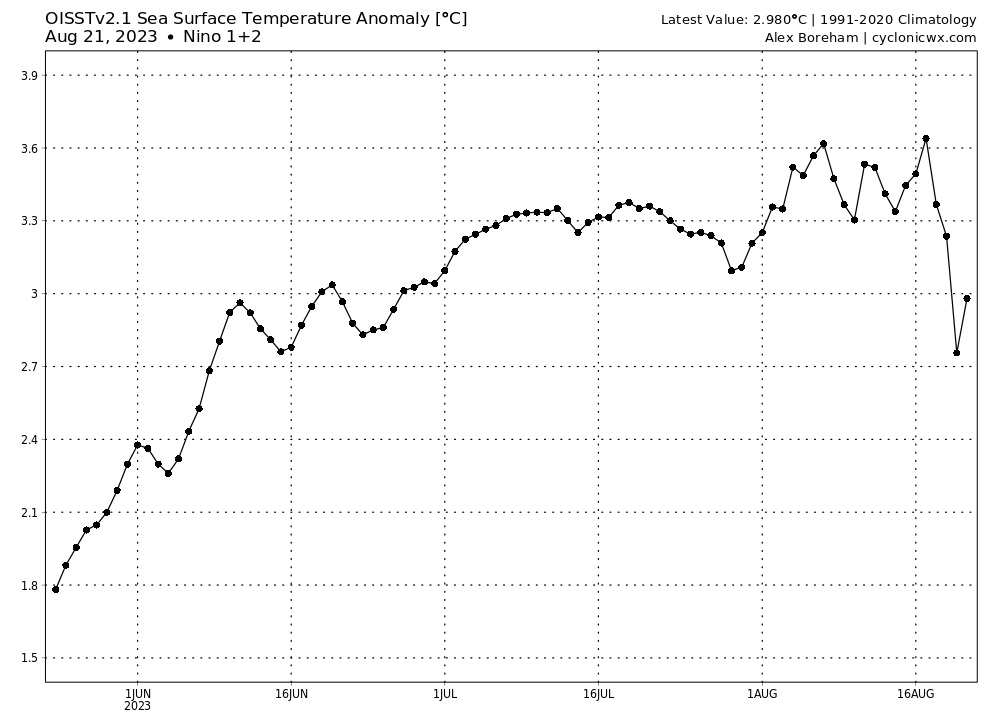
The wild OISST Nino 1+2 anomaly, which plunged ~0.5C yesterday and nearly 0.9C over just a three day interval, rebounded by nearly half of yesterday's drop today from 2.756C yesterday to 2.980C today (see below). But it still has a long way to get back to the top. Thus, I do lean toward the top being in based on using model consensus as a guide. Nino 1+2 was reported today to be at +3.3 again. Nino 3.4 rose from +1.2 to +1.3, Nino 3 rose from 1.8 to 2.0, and Nino 4 remained at 0.9. Based on model projections, I expect the current east based Nino (1+2 and 3) to eventually yield to a cross between east and center based for DJF. By F, itself, it would probably be getting close to center based.
-
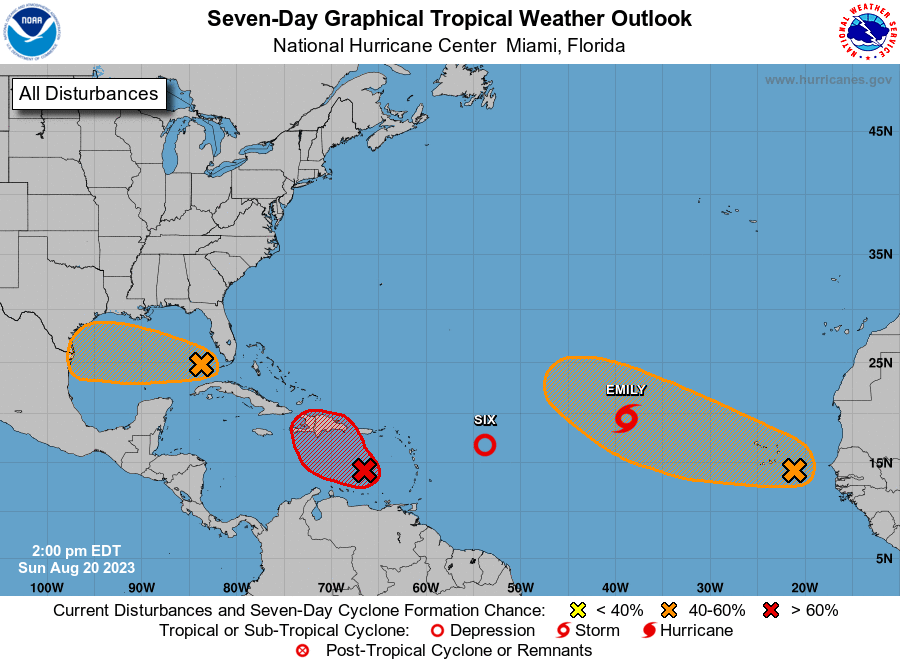
So this thread went from discussion just yesterday of the NHC being too slow to upgrade to the exact opposite today. From yesterday: "The NHC’s lack of propensity to name obvious tropical cyclones is starting to get annoying. It took them far too long to name Emily and the day before TD 6. Just because it’s in the open ocean doesn’t mean you don’t initiate advisories when it’s an obvious TC." But I do agree that Gert is no longer a TC.
-
For Fri-Sun (8/18-20), LV has received 0.85" with ~0.55" of it from Hilary. They're very fortunate considering the ~2" progged by model consensus Fri through today and with it currently looking like little for today. Definitely an underachiever there, which is great news for them.
-
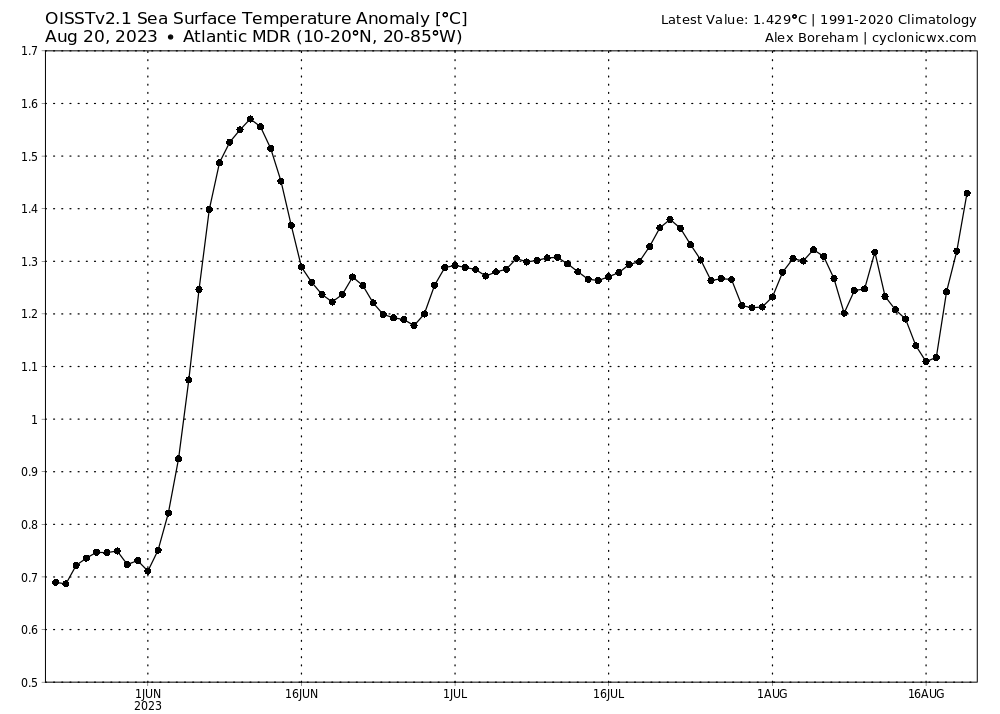
I'd think this should help cool the water some. But as of yesterday per OISST, the MDR SST anomaly was still very warm and actually it had warmed the last three days:
-
A couple of us just yesterday were talking about how the NHC has been too slow this season to date in upgrading systems vs years like 2020 and possibly overreacting to criticism then. Example:
-
Oops, yes, 3-0-0. I think I was looking ahead at Franklin model projections to become a H down the road.
-
-With the upgrade of TD6 to Gert, August is already up to 3/1/0. -Gert now joins Arlene, Bret, Cindy, and Emily as names that go back at least to 1981 and which will return in the 2029 list. - Arlene at 12 times had already been the most frequently used Atlantic name through 2023. Now it will be back for at least #13.
-
I'm predicting Nino 3.4 will be +1.3 in tomorrow's weekly release, not too far from getting into the strong category. Yet, this hurricane season is now about as busy as can be in terms of number of features being followed south of 30N!
-
It looks to me that Las Vegas will dodge the proverbial bullet as model consensus suggested ~2" was quite possible for the Fri-Mon period, including the Fri monsoon. Right now they're near 0.70" with ~1" total for Fri-Mon, if that, looking much more likely than anything close to 2" total. So far, the only flash flooding was 4-5PM Fri from the monsoon, not Hilary.
-
A 5/2/2 August would not be a big shocker considering the # of features being followed/modeled as well as the very warm Atlantic. So, I'd say most likely anywhere from 3/1/0 to 5/2/2. As was just posted, Franklin becoming a MH wouldn't be that surprising. Ldub's highly successful career as a pure entertainer/troll stretches for two decades although even he/she can end up right at times due as much to luck as anything.
-
And at most wx forums, too. At this early stage, NE, especially SE MA/ME, is at some risk from this next week especially from the outer fringes per the 12Z ensembles. At higher risk in addition to the Caribbean are SE Canada, Bermuda, and the Bahamas.
-
Bell ringing day last year vs this year: Last year: very quiet despite moderate La Niña This year just about as many systems at one time as ever despite moderate El Niño:
-
Wow, OISST 1+2 anomaly cooled a whopping 0.5C in just 24 hours!!
-
Also, I should have specifically referred to this summer's warm bias of the BoM as having been in Nino 3.4, 3, and 4. I've never seen a BoM forecast for Nino 1+2.
-
Although the BoM has been much too warm this summer, it actually averaged a neutral bias the prior ten years with several significantly too warm but others significantly too cool to balance it out. So, despite the 10 year neutral bias, it might have a relatively high average error though I didn't calculate it and thus don't know how its error has been relative to other models.
-
With Emily, 2023 is at 6 storms to date. Regarding 1991-2020 averages: - 6th storm date 8/29: so ahead by 9 days despite El Niño - 2+ more storms are likely to be named by then, which would mean 8+ by 8/29. 8th storm average date isn't til 9/9. 9th not til 9/16. - 1st H forms 8/11 and 2nd forms 8/26. So, pretty close to average for that with a decent shot at the 2nd H of 2023 by 8/26. Invest 90L appears to be the best candidate for this right now. - 1st MH date 9/1. With the higher than normal # of systems for late August being monitored, there's a decent shot for the first MH by 9/1. Invest 90L may be the best candidate for this possibility, but we'll also need to see what the E MDR may produce. https://www.nhc.noaa.gov/climo/
-
The opposite was often said in years like 2020, naming too many. So, this may be an overreaction by the NHC to then.
-
Other than 4-5PM on Friday (due to monsoon, not Hilary), LV has had fairly light hourly rain rates for the most part to this point. Due to the continuous nature of the rain over many hours, rain amounts have been heavy for LV relative to climo. On Friday 8/18, they received 0.30". But that was due to the monsoon flow rather than Hilary. This was the third heaviest on record for the date (back to 1937). Looking more closely, it appears that they got ~0.26" 4-5PM on 8/18, which is quite heavy for just one hour. Edit: That is the heaviest hourly rainfall since at least 8/11/2022. Yesterday 8/19 they got 0.21", which was largely from Hilary and was a record for the date as the old record was 0.18" (2003). Also, their high was only 79, a record low high that was 24 BN. Old record was 81 (2003). So far today, they have received ~0.10", which already has broken the record for today. The old record had been 0.06" (1975). So, for the period since Friday, LV has already received ~0.61" due to a combo of the monsoon and Hilary (near even split) with quite a bit more expected today from Hilary. The three day period 8/18-20 averaged only 0.02" during the period 1937-2022.
-
-I have Aug JMA for DJF 22-23 -0.43 vs actual -0.67 for a miss of +0.24 -I have Aug JMA for DJF 21-22 -0.16 vs actual -0.97 for a miss of +0.81 (but admittedly still a big error) During last 10 years: -Avg Aug JMA miss when DJF <-0.5: +0.5 -Avg Aug JMA miss when DJF >-0.5: -0.2 If we were in/headed for another La Niña, I'd lean to this last JMA run being too warm. And it of course may be. But with it not La Niña and with all 7 major models now +2.0+, it is hard for me to lean that way considering the recent non-La Niña years as well as how earlier months this year have gone. So, I'm neutral on its latest of +2.18 for DJF, especially with it rising so much even with a much cooler OHC in July and only a tepid 3.4 SST rise in June/July.