

GaWx
-
Posts
18,764 -
Joined
Content Type
Profiles
Blogs
Forums
American Weather
Media Demo
Store
Gallery
Everything posted by GaWx
-
I thought maybe those, too. I told her that but she said they’re the size of a housefly. Maybe 1/4”. So they’re too small to be a cicada.
-
Does anyone have any idea what these are? My sis (in Atlanta) is asking me and I can’t tell from pics. She thought they were a bug but I’m not so sure. This one was in a spider web: These were in her garage (came off a car underneath where it was parked):
-
Traveled I-16 today from Dublin eastward. I saw a very large number of trees down on the sides with the heaviest concentration from ~10 miles E of Dublin to Metter in pockets. It was wild as I’ve never seen anything like it for so many miles (40-50)! This was from Hurricane Helene, which likely caused highest gusts in the 90s mph in this area and was a once in a lifetime tropical event of that strength in much of this area as a result of the combo of it coming ashore in FL as a cat 4, large size, and near record speed of movement. It was like a bunch of tornadoes over a 50 mile wide stretch! There were some cleanup crew trucks in spots.
-
No I don’t and yes I don’t trust the unreliable CFS. After all it still has an unrealistic record cooling from Nov to Dec in Nino 3.4 that no other model had in Nov. However, even though it could turn on a dime, I’d still rather the CFS show this persistent strong +AAM than show a -AAM. So, we’ll see if it happens to be “onto” something as opposed to “on” something. I did notice that the last 3 runs of the extended GEFS break down the SE ridge late month *fwiw* suggesting it may dominate for no more than 1-2 weeks.
-
Chris, IF the last few CFS ensemble runs were to verify pretty well, we’d be looking at a strong +AAM (El Ninoish) late in Dec and early in Jan. If so, any mid Dec SE ridge dominance could be shortlived:
-
Yesterday (12/1) had the first freeze at Gainesville, FL, (aka Hogtown) with an impressive 28. That’s 3 colder than KSAV’s coldest so far this season of 31. Those who follow Hogtown know that it can radiate with the best of the deep SE. @pcbjr
-
Natural gas is down 6% this evening, which is usually at this time of year indicative of reduced cold in the two week forecast, especially toward the end of week two.
-
Todays Euro Weekly at H5 for 1/6-12 looks pretty good:
-
KSAV, KATL, and KCHS saw their first freeze of the season yesterday while KSVN had its first this morning. Another fantastic day for outdoor activities is on the way for those areas today with afternoon temperatures mainly in the 50s and plenty of sun.
-
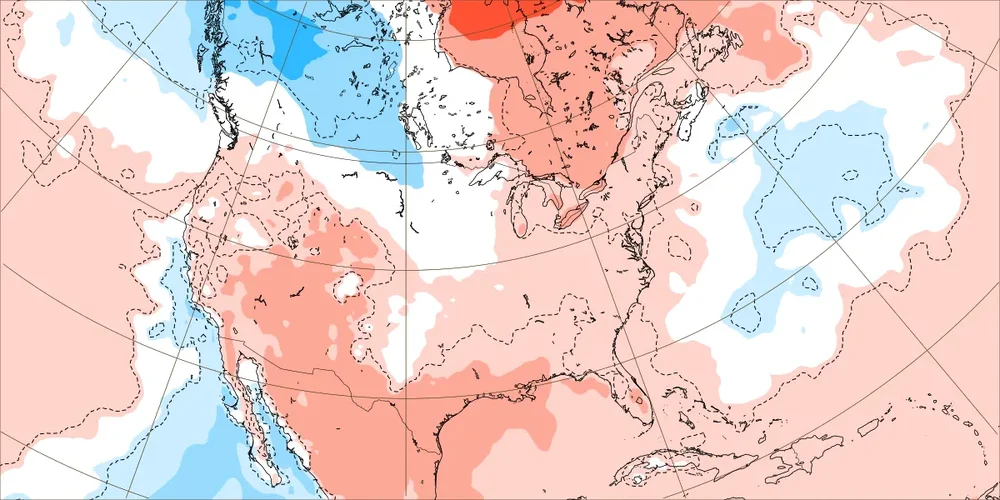
Latest model consensus continues suggesting BN temperatures dominating much of the 1st half of December in the SE US.
-
Latest AAM from CFS ensemble fwiw continues El Ninoish +AAM during the last half of Dec, something I like seeing as it may mean the SE ridge won’t become dominant anytime soon:
-
Thanks, Mitch. This is the 4th run in a row showing a Modoki El Niño developing next summer fwiw. I’d also love to see the NW Pacific cool off.
-
In ATL for the week and about to go walking with friends in beautiful upper 40s/light winds/sunny. This wx is fantastic. I hope it lasts for awhile. If not, I’m still glad we’re getting this!
-
Here was the Nov 15th run of the Euro Weeklies for 12/2-8: And the same run for 12/9-15:
-
Latest CFS ensemble AAM forecast: fairly similar to prior forecast with largely a moderate +AAM (El Ninoish). Most notable to me is that it hangs on and is even stronger at very late month although that’s a highly fwiw since these CFS forecasts aren’t the least bit reliable that far out: Prior forecast (from one week ago):
-
Bump. -# of NS is at 18, which is 5 below April CSU prediction. -# of NS days is at 78, which is way below the predicted 116 -ACE is at 162, which is way below the predicted 210. So, 2024 was still another extremely April CSU forecast that verified too active.
-
You don’t sound like you’re as much of a pure cold lover (SE brand of cold I mean) as me. It makes me want to go outside and enjoy it. Different strokes for different folks! Happy Thanksgiving, everybody!
-
If it were to end up only 5 days, I’d still be thankful for the 5 days. Any cold is good cold. But it appears to me like more than a total of 5 days is the most likely between now and 11/15 with these days over two different periods.
-
It looks to me like it will be close. Right now I have Nov MTD near the -2.9 to -3.3 range. My best guess is for -3.0 to -3.2. Jul and Aug were in the -2.9s. It appears that Nov was slightly more negative than those two, but the correlation of NOAA to WCS from month to month has been far from perfect. Thus, another in the -2.9s seems like a legit possibility even though I favor sub -3.0 right now. We’ll know pretty soon. If Nov is sub -3.0, it would be only the second time since 1851 for three sub -3 in a row. The only other time was in 1894.
-
NG is now down a whopping 7% since yesterday with a pretty steady drop the last 14 hours. It is now near session lows. Per a pro met friend: MUCH warmer overnight,…! -10 HDDs on the last 0z EPS vs the previous 12z run! Edit: NG closed down 8%! So, this market is seeing either less cold or potentially an earlier end to it.
-
There are still areas with peak autumn leaf color in the Atlanta area.
-
Natural gas (NG) has been down ~4.5-5% for the last few hours vs yesterday with most of drop from late last evening through early this morning. That makes me wonder if EPS and/or GEFS forecasted population weighted US HDDs has dropped notably vs yesterday’s runs.
-
I’m just happy to have the cold for late Nov and a good portion of the first half of Dec. Besides, wintry precip down here is rare and actually doesn’t occur most winters. Dry cold is so refreshing and is great for walking! So, I’m always happy with cold.
-
The EPO as expected dipped sharply to its lowest level in 13 months after being at its highest since June 4th just 5 days earlier: 2024 11 17 232.92 2024 11 18 182.78 2024 11 19 30.24 2024 11 20 -168.33 2024 11 21 -243.29 2024 11 22 -258.96 2024 11 23 -229.99
-
If the global tropics were averaging +4.5C but Nino was only at +2.3C, would you still be thinking of it as a super El Niño other than “in name”? Do you at least see my point?


