

beavis1729
-
Posts
2,570 -
Joined
-
Last visited
Content Type
Profiles
Blogs
Forums
American Weather
Media Demo
Store
Gallery
Everything posted by beavis1729
-
1/24-1/25 Major Winter Storm - S. IL, IN, and OH
beavis1729 replied to A-L-E-K's topic in Lakes/Ohio Valley
Come on everyone, it’s not a competition. The best outcome would be for the entire lower 48 to be covered by snow and ice. Then we’d all be happy. -
Looks like GRR bottomed out at -19, congrats and good call. Skies cleared just after sunset, then remained that way until clouding over again this morning…so things lined up about as well as can be expected re: radiational cooling during the overnight hours.
-
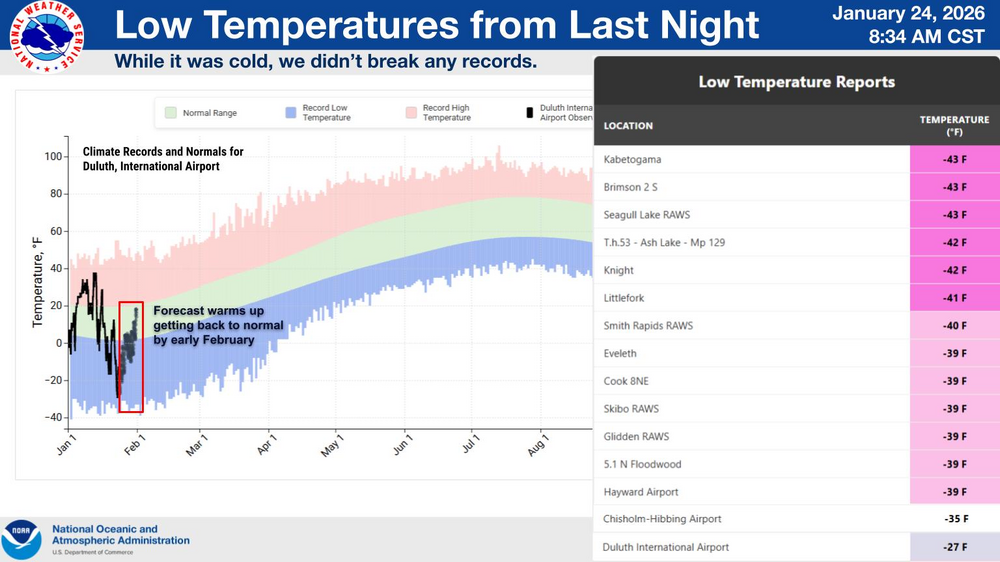
NWS Duluth
-
Nice. It dropped to -38 at Manitowish Waters, in the beautiful north woods of WI. I was there a couple weeks ago for my nephew’s outdoor hockey tournament.
-
Just saw in the NE forum cold thread that the Brunson, MN coop hit -43.
-
Yeah, temps tanked overnight up there where skies cleared with calm winds, much colder than forecast. Manitowish Waters WI hit -38, and Minocqua -34. Even as far south as Stevens Point, it was -25.
-
Winter 2025-26 Medium/Long Range Discussion
beavis1729 replied to michsnowfreak's topic in Lakes/Ohio Valley
Yep. Of course I’d prefer more snow, but beggars can’t be choosers. I go to northern WI a few times each winter for snowmobiling and relaxing. That’s my ideal climate - every winter, you can count on frozen lakes and ponds, plus constant snow cover for 2+ months…it’s just a matter of how much. And they don’t salt the roads to death. Plus, the summers are nice - warm, but not overly hot/humid. -
Cold and dry, maybe a few flurries over the weekend on the northern edge of the big storm. Dropped to -12 with WC around -30 this morning, and only made it up to -5 this afternoon after a midnight high around 0. A beautiful sunny day! Not much snow cover, but enough to cover the ground fully in the neighborhoods.
-
Winter 2025-26 Medium/Long Range Discussion
beavis1729 replied to michsnowfreak's topic in Lakes/Ohio Valley
Correct again. -
Winter 2025-26 Medium/Long Range Discussion
beavis1729 replied to michsnowfreak's topic in Lakes/Ohio Valley
Correct. -
1/24-1/25 Major Winter Storm - S. IL, IN, and OH
beavis1729 replied to A-L-E-K's topic in Lakes/Ohio Valley
Was a beautiful morning, -12 and windy...and crystal clear deep blue skies. Perfect for a jeb walk. I'd be in heaven if we had 4-6" of snow cover like in Detroit, but at least it looks and feels like winter imby...and I mean only literally in my backyard. There's 1-1.5" of snow cover, which itself is a bit annoying as it probably mitigated the impact of the arctic outbreak here and upstream, and there are bare spots on the roadways and other areas, like under trees. But as long as I'm actually looking out my window, it's all good. While I agree this has been a bit better winter than the past 3, the snow pack has been abysmal since the melt around Dec. 10th. The biggest problem to me was the non-white Christmas...which seemed like a good possibility after getting 15" of snow between late Nov. and 12/7 or so. Or, at least it should be. While it has been cold with small bouts of snow over the past few weeks, we shouldn't be happy with essentially zero days with 3"+ snow cover from Dec. 10th through Jan. 31st. That's the heart of winter, and a 3" snow pack isn't really asking for much. Still more time left...and as long as the most obnoxious winter pattern in history (the dreaded chinook pattern) is gone, things should hopefully get a bit more interesting soon. The chinook pattern cut off all return flow from the gulf, and the ridge out west was always lurking...so even when you got a bit of snow, 1-2 mild days would melt it. Unfortunately, that general pattern lasted for 4-5 weeks. I mentioned this elsewhere...but if I lived in MT, WY, CO, or SD, I would be going crazy. They've had no winter so far. At least we've had a little bit here. And I don't really pay attention to actual seasonal snowfall totals. What matters is the look and feel, measured by either SDDs or the # of wintry days (which are defined as days with 2"+ snow cover and a high temp in the 20s or colder). We haven't had very many, if any, wintry days since the melt in early Dec. If we had a decent snowpack built up over time, building off the great early start this season, then the delays between snow events would be more tolerable. -
-12 here. Rockford -14, wind chill -37, dew -28. Duluth -29, wind chill -57. INL -33, wind chill -51. Wausau (only a 3.5 hour drive from here) -25, wind chill -51, dew -35.
-
And a dew of -31. It’s amazing when you have an arctic airmass like this, and the normal diurnal swings are neutralized. H85 temps are near -40C in northern MN right now, an extremely rare occurrence.
-
Fosston, MN...not bad for 3pm local time. FOSSTON LGT SNOW -24 -36 51 NW21G33 30.36R WCI -54
-
1/24-1/25 Major Winter Storm - S. IL, IN, and OH
beavis1729 replied to A-L-E-K's topic in Lakes/Ohio Valley
Right, good point. Mainly, I was just surprised how cold it was at H85 that far southwest…which I didn’t expect to see. My hope is that strange things could happen with a gradient like that. -
1/24-1/25 Major Winter Storm - S. IL, IN, and OH
beavis1729 replied to A-L-E-K's topic in Lakes/Ohio Valley
Strong SE ridge and H85 low fairly far west. I know, probably grasping at straws. -
1/24-1/25 Major Winter Storm - S. IL, IN, and OH
beavis1729 replied to A-L-E-K's topic in Lakes/Ohio Valley
Yes sir…and why not, I’ll pile on. With a prog like this, one might think there’s room to go at least a bit further north.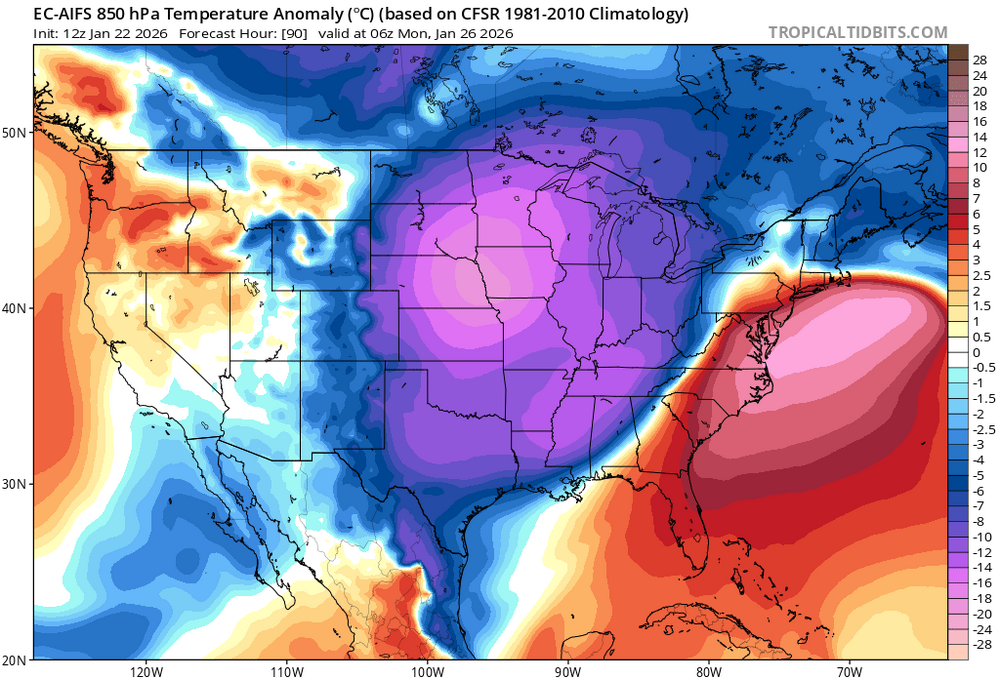
-
Here it comes...Bottineau ND is already down to -22 with NW winds at 23 mph, WC -53. It was -2 there at midnight, but will probably remain in the -20s for the rest of the day, even during peak heating. The ultimate "midnight high".
-
I could see -17 or -18 in GRR if everything goes right. Deep cold airmass, healthy snow cover, and minimal moderation from LM. So not quite the all-time record, but maybe the top 10 coldest on record?
-
Yeah, which is definitely unfortunate. The good news is there’s at least some snow cover, and there won’t be much modification of the airmass due to the upstream snowpack combined with the winds/advection. This will be one of those arctic outbreaks where the airmass is very impressive (which I define as -35C or colder at H85 somewhere in the lower 48), but the ground temps underperform relatively speaking. Still a decent arctic outbreak, but not what it could be. This is opposite of what occurred in January 2009, where the airmass wasn’t crazy cold but there were very low temps due to fresh deep snowpack and clear/calm conditions. Regardless, we may see the coldest temp here since January 2019.
-
Winter 2025-26 Medium/Long Range Discussion
beavis1729 replied to michsnowfreak's topic in Lakes/Ohio Valley
See the cold wave thread, if you want to post there for posterity. I’ll put some info in there soon. -
DLH Area Forecast Discussion National Weather Service Duluth MN 1248 PM CST Tue Jan 20 2026 .KEY MESSAGES... - Brutally cold temperatures are expected through the weekend, with multiple days below zero Thursday through Sunday. Low actual temperatures in the negative 30s to 40F, and minimum wind chills in the negative 30s to 50s. The coldest days will likely be Friday and Saturday. - A couple areas of light snow pass over the region this evening through the day Wednesday. Accumulations of an inch or less are expected. - Light lake effect snow and clouds may persist along the South Shore through the weekend. && .DISCUSSION... Issued at 1243 PM CST Tue Jan 20 2026 Relative to the last couple days and the coming days, today and tomorrow will be fairly "mild" (in a northern mid winter sense). High temperatures above zero are expected this afternoon and Wednesday - with some folks seeing afternoon temperatures in the teens tomorrow! This temperature moderation is occurring thanks to some WAA ahead of a couple passing upper level vort maxes spurring on some weak surface clippers. These will pass through this evening through Wednesday bringing a couple areas of light snow. The first passes through this evening, mostly from Brainerd to Hayward. The second should move across the area from northwest to southeast through the day Wednesday with a little wrap around snow lingering into Thursday morning. Total accumulations should be around an inch or less across the region. Behind the Wednesday clipper, a hefty cold air mass is expected to drop into the Northern Plains, Midwest, and Great Lakes region through the weekend with 850mb temperatures dropping into the -30s Celsius. This is expected to result in several days of some very cold surface temperatures beginning Wednesday evening through at least Sunday midday, when temperatures are unlikely to rise much above zero, if at all. The coldest days of this period are expected to be Friday and Saturday. Thursday and Friday, brisk northwest winds are expected which will lead to the coldest winds chills of this period Thursday night into Friday morning. Wind chill values of -40 to -50F are possible. The coldest actual air temperatures are expected Friday night into Saturday morning when widespread temperatures of -30 to -40F are forecast. There is a 5 to 10% chance that some of the local coldest spots could drop to -50F actual temperature on Saturday morning. With these cold temperatures and high confidence in them occurring, we`ve issued a plethora of cold weather headlines with this forecast update. For Wednesday evening into Thursday morning/midday, we`ve gone ahead and issued a Cold Weather Advisory for much of the area, with an Extreme Cold Warning along the far north. The Borderlands warning and the advisory along the Iron Range/North Shore continue through the day on Thursday as any diurnal warming is expected to be minimal. Thursday evening, the whole area falls into a Extreme Cold Watch through midday Saturday. Sunday and Monday mornings will likely feature more Cold Weather Advisories but shouldn`t be as brutally cold as Friday/Saturday. Looking ahead to next week it appears we`ll moderate slightly but still be below normal. There are little to no chances of snow after tomorrow`s clipper, outside of the South Shore possibly getting some on/off lake effect with the northwest winds and cold temperatures. Global models show a slight chance of snow returning mid next week as slightly warmer temperatures allow moisture back into the area.
-
NWS is forecasting 3 consecutive nights in the -30s at INL...and it will probably hit the -40s in the radiator spots of Tower and Embarrass if winds go calm. Wednesday A 40 percent chance of snow, mainly before noon. Mostly cloudy, with a high near 11. Light and variable wind becoming northwest 5 to 10 mph in the morning. Winds could gust as high as 20 mph. Wednesday Night Partly cloudy, with a low around -23. Wind chill values between -25 and -35. Northwest wind 5 to 10 mph, with gusts as high as 25 mph. Thursday Partly sunny and cold, with a high near -14. Northwest wind 5 to 10 mph, with gusts as high as 25 mph. Thursday Night Mostly cloudy, with a low around -30. Northwest wind 5 to 10 mph, with gusts as high as 20 mph. Friday Mostly sunny and cold, with a high near -14. West wind 5 to 10 mph, with gusts as high as 20 mph. Friday Night Partly cloudy, with a low around -38. West wind around 5 mph becoming calm in the evening. Saturday Mostly sunny and cold, with a high near -9. Calm wind becoming southwest around 5 mph. Saturday Night Partly cloudy, with a low around -30. Calm wind. Sunday Mostly sunny and cold, with a high near -2. Calm wind becoming west around 5 mph in the morning.
-
MKE URGENT - WEATHER MESSAGE National Weather Service Milwaukee/Sullivan WI 1240 PM CST Tue Jan 20 2026 WIZ046-047-051-052-056>060-062>072-210245- /O.NEW.KMKX.EC.A.0001.260123T0600Z-260124T1800Z/ Marquette-Green Lake-Fond du Lac-Sheboygan-Sauk-Columbia-Dodge- Washington-Ozaukee-Iowa-Dane-Jefferson-Waukesha-Milwaukee- Lafayette-Green-Rock-Walworth-Racine-Kenosha- Including the cities of Endeavor, Germantown, Benton, Markesan, Oxford, Shullsburg, Muskego, Cedarburg, Oostburg, Portage, Jefferson, Belmont, Waupun, Reedsburg, Columbus, Watertown, Waukesha, Berlin, Fond Du Lac, Dodgeville, Fort Atkinson, Madison, Beaver Dam, Princeton, Montello, Grafton, Argyle, Whitewater, Mequon, Barneveld, Baraboo, Darlington, Brookfield, Sheboygan Falls, Janesville, Beloit, Lake Geneva, Plymouth, Mayville, Menomonee Falls, Elkhorn, West Bend, Delavan, Lake Wisconsin, East Troy, Prairie Du Sac, Racine, Kenosha, Howards Grove, New Berlin, Sauk City, Monroe, Westfield, Milwaukee, Mineral Point, Lodi, Neshkoro, Hartford, Blanchardville, and Brodhead 1240 PM CST Tue Jan 20 2026 ...EXTREME COLD WATCH IN EFFECT FROM LATE THURSDAY NIGHT THROUGH SATURDAY MORNING... * WHAT...Dangerously cold wind chills as low as 40 below possible. * WHERE...Portions of east central, south central, and southeast Wisconsin. * WHEN...From late Thursday night through Saturday morning. * IMPACTS...The dangerously cold wind chills as low as 40 below zero could cause frostbite on exposed skin in as little as 10 minutes. PRECAUTIONARY/PREPAREDNESS ACTIONS... Dress in layers including a hat, face mask, and gloves if you must go outside.
-
January 2026 regional war/obs/disco thread
beavis1729 replied to Baroclinic Zone's topic in New England
Today's 12z Euro shows near -40C at H85 in NW Minnesota at 84 hours. That's the type of airmass that can produce -40F or colder surface temps in the typical radiator spots, like Tower and Embarrass, if skies clear and winds go calm or near calm. Probably the coldest airmass in that part of the world (and imby) since late January 2019?


