Go Kart Mozart
-
Posts
3,131 -
Joined
-
Last visited
Content Type
Profiles
Blogs
Forums
American Weather
Media Demo
Store
Gallery
Everything posted by Go Kart Mozart
-
Spooky Season (October Disco Thread)
Go Kart Mozart replied to Prismshine Productions's topic in New England
Jamaica has some significant mountains, right? -
Spooky Season (October Disco Thread)
Go Kart Mozart replied to Prismshine Productions's topic in New England
Send in the November clowns!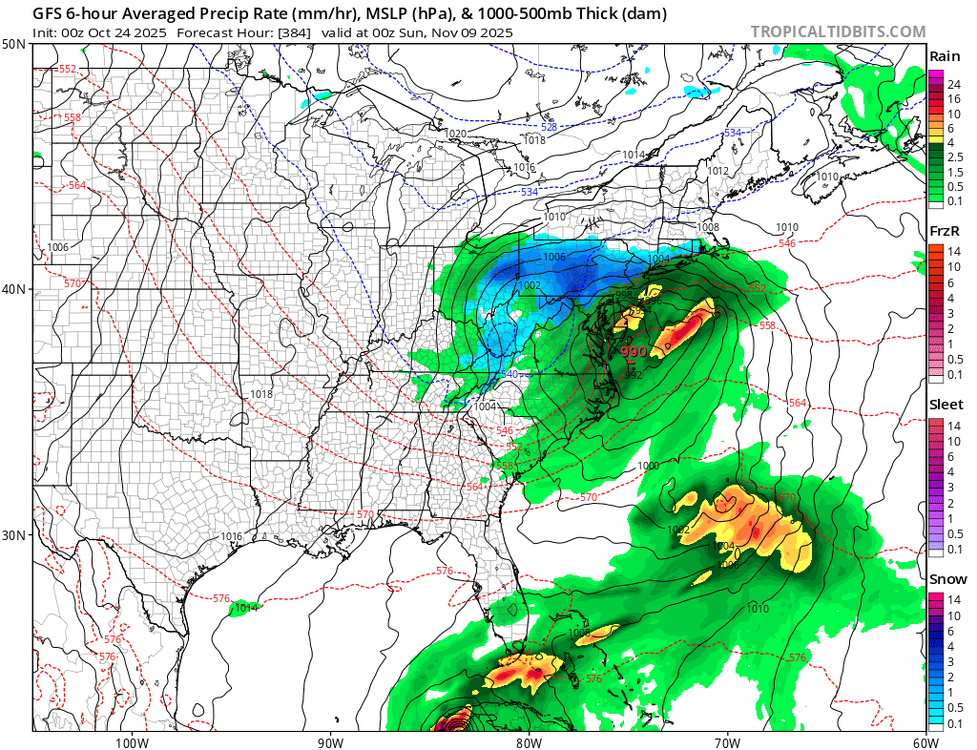
-
Spooky Season (October Disco Thread)
Go Kart Mozart replied to Prismshine Productions's topic in New England
I agree, not snow, but the end of the world as we know it.... -
If this were a snowstorm I would be as happy as a pig in shit:
-
RGEM and NAM are quite different.
-
I doubt we will see freezing rain.
-
You can find online videos of the Ohio State vs. Michigan game played during that storm, which was a full-on blizzard in Columbus. The teams were punting on first down. https://www.google.com/search?q=osu+michigan+1950&oq=osu+michigan+1950&gs_lcrp=EgZjaHJvbWUyBggAEEUYOdIBCjEwMjE2ajBqMTWoAgiwAgE&sourceid=chrome&ie=UTF-8#fpstate=ive&vld=cid:a7aac814,vid:S85War5TWRk,st:0
-
Spooky Season (October Disco Thread)
Go Kart Mozart replied to Prismshine Productions's topic in New England
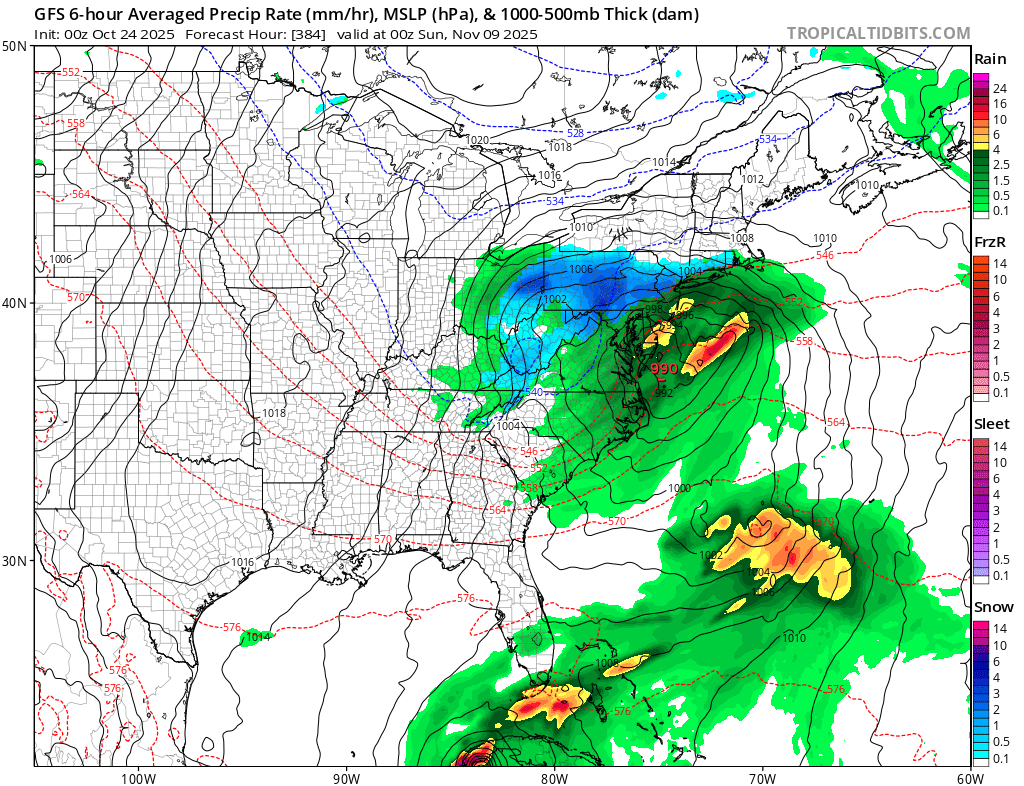
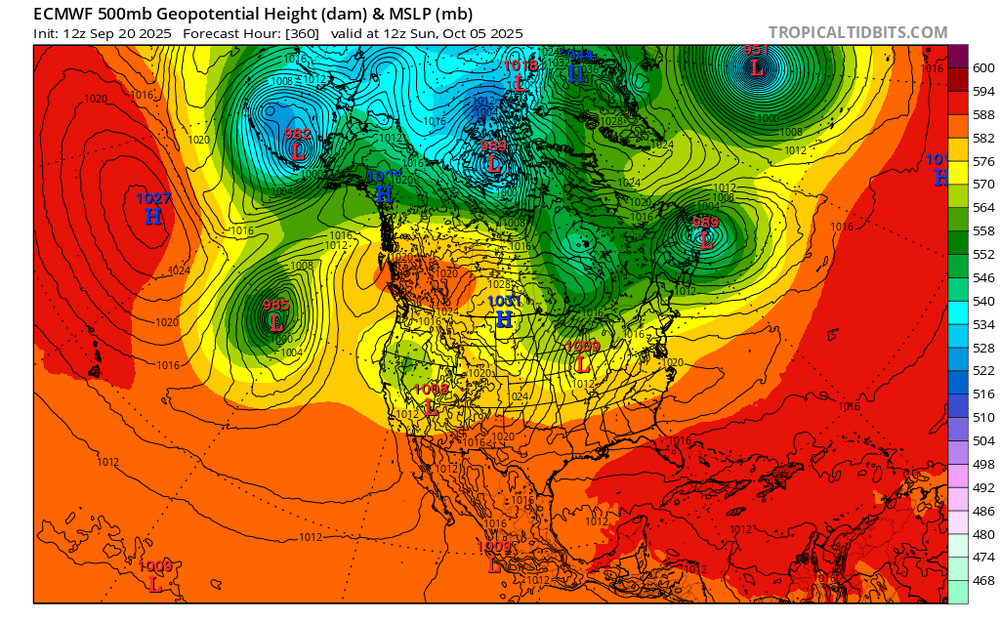
gfs has the low approach...then run away like it is afraid of us. -
Spooky Season (October Disco Thread)
Go Kart Mozart replied to Prismshine Productions's topic in New England
Groton. The icebox of CT. -
Spooky Season (October Disco Thread)
Go Kart Mozart replied to Prismshine Productions's topic in New England
No precip too. -
Spooky Season (October Disco Thread)
Go Kart Mozart replied to Prismshine Productions's topic in New England
lock it in....
-
Can we get this setup mid-winter, 72 hours out?
-
Even in this world of CC?
-
Great. I can't wait to see daily pics of Powderfreaks friggin snowstick.
-
Don't do it. I always tell my family, "heat is a Thanksgiving treat".
-
I think ORH has pointed out that the bright reds make people think it is all warm and juicy...but in reality, it is still friggin cold water.
-
ya, c'mon Wiz.
-
There will be water but it will be thick with sausages.
-
It looks like we will end August -2 or thereabouts. Seems like summers these days are one month of heat, then on to fall. I was so tempted to leave out the emoji and get the AWATT crowd all pissed off...
-
Alex, do you know what the typical first frost date is for you?
-
Well, that read woke me up. At least it sounds like another ratter is unlikely?
-
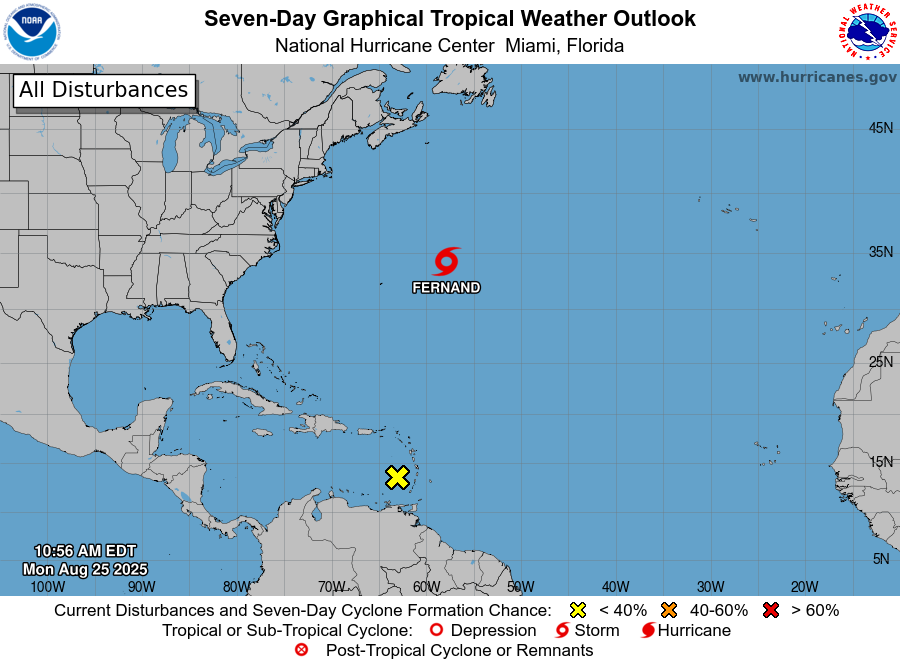
Gotta love TPC showing us that disturbance by the Windwards....then telling us it has a 0% chance of development.
-
Nothing lasts foreverAnd we both know hearts can changeAnd it's hard to hold a candleIn the cold November Rain. I'll start the November thread.
-
Yes, they hired the firm that advised InBev on Bud Light's glorious campaign.
-
How do you protect the whole operation from lightning damage?