

mitchnick
-
Posts
28,572 -
Joined
Content Type
Profiles
Blogs
Forums
American Weather
Media Demo
Store
Gallery
Everything posted by mitchnick
-
30 and freezing fog imby. York Airport, notoriously cold with its temp gauge in a low spot, at 22 degrees with freezing fog. They are right on Rt. 30 with a speed limit around 50mph. Wouldn't want to be driving there this morning.
-
Outta gas and Outta Time: Early March Winter Storm finale
mitchnick replied to Ji's topic in Mid Atlantic
I know it's not much, but Eps came around 30 miles south from 12z. Modest as it is, there still is plenty of time with this.
-
Oh no...I guess I'll be stuck just scratching dry skin.
-
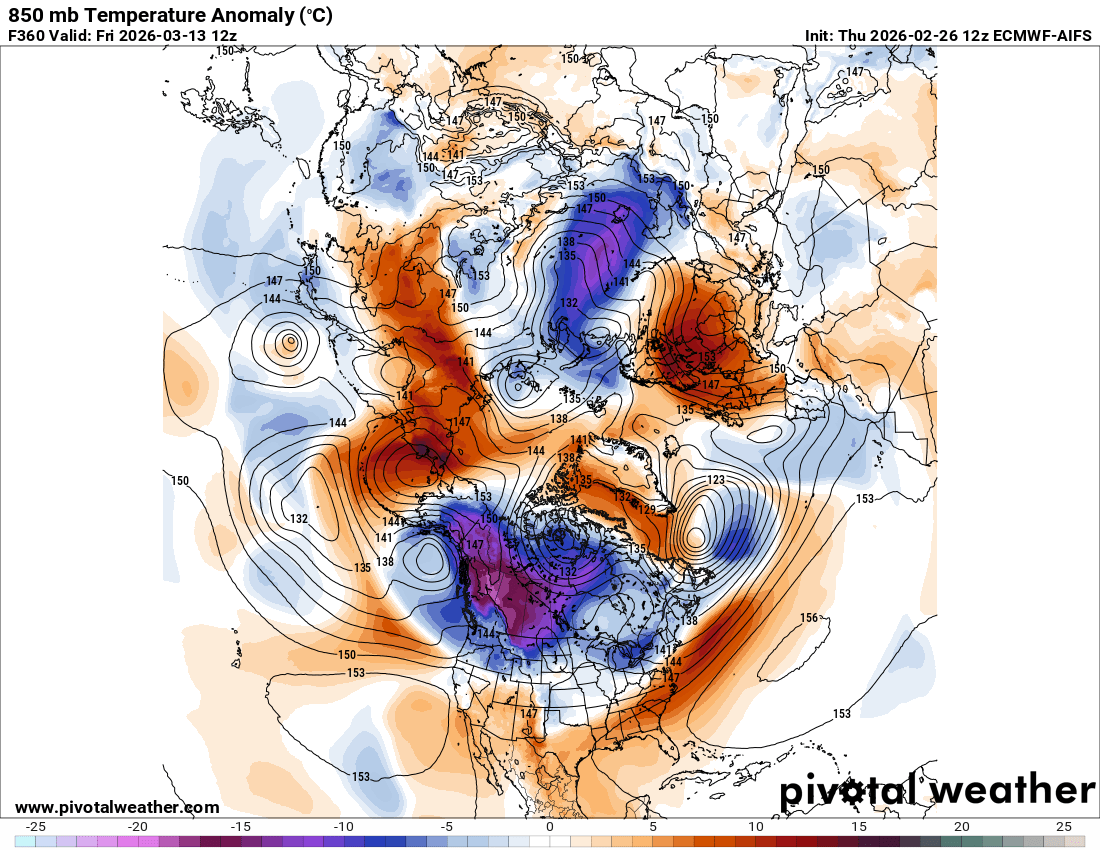
EUROAI insisting on the return to cold at the end of its runs.
.thumb.png.06be8fd364896362d44b672548cb9100.png)
-
Outta gas and Outta Time: Early March Winter Storm finale
mitchnick replied to Ji's topic in Mid Atlantic
The second event sorta merges right into the tail end of the 1st hit on the AI. It does mix or turn to rain with the 2nd one unfortunately. -
Outta gas and Outta Time: Early March Winter Storm finale
mitchnick replied to Ji's topic in Mid Atlantic
EuroAI another good hit per TT maps. -
Outta gas and Outta Time: Early March Winter Storm finale
mitchnick replied to Ji's topic in Mid Atlantic
Right...it's south. -
Outta gas and Outta Time: Early March Winter Storm finale
mitchnick replied to Ji's topic in Mid Atlantic
Gfs south again -
Looks like snow trying to mix in up here, but the end is near.
-
I'm hearing my raindrops, so I think there's some sleet mixed in up here.
-
Sleet aloft would be my guess.
-
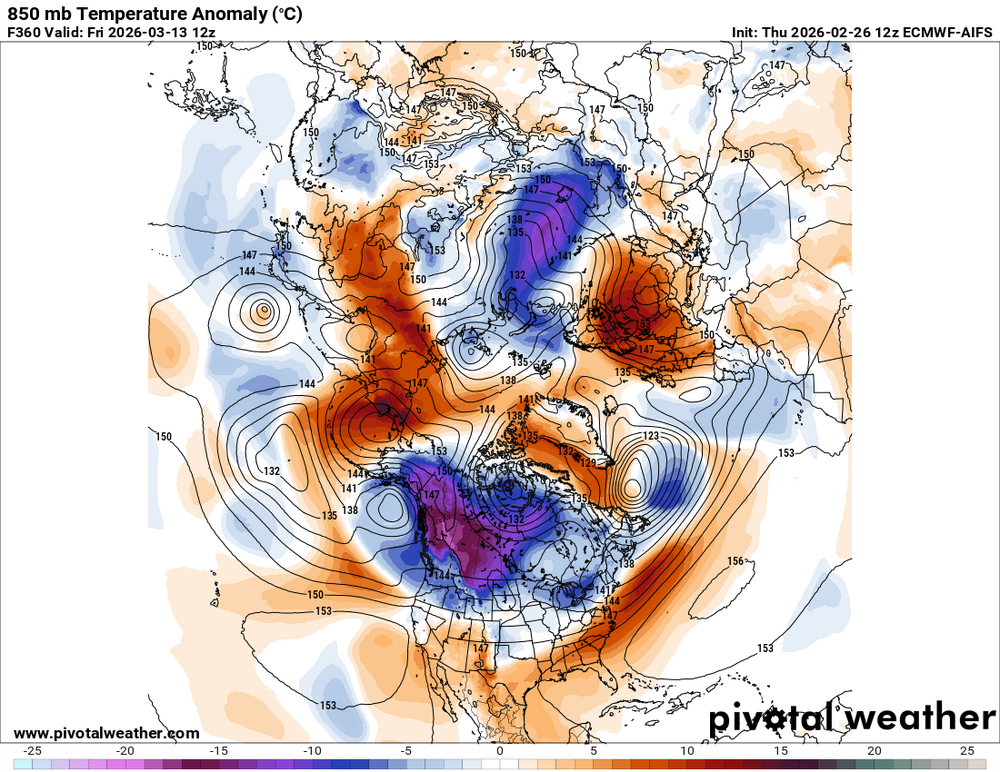
Euro AI says a cold dump is imminent before the end of March methinks. The SSW is flooding the Pole with high pressure and warm air. If I'm not mistaken, that anomalous High Pressure over the Black Sea region on this map is related to the SSW.
.thumb.png.650c9cc7dd49e7a9d23e6cf73e0d0517.png)
-
Outta gas and Outta Time: Early March Winter Storm finale
mitchnick replied to Ji's topic in Mid Atlantic
-
Outta gas and Outta Time: Early March Winter Storm finale
mitchnick replied to Ji's topic in Mid Atlantic
Eps look worse than 0z. -
Outta gas and Outta Time: Early March Winter Storm finale
mitchnick replied to Ji's topic in Mid Atlantic
Hopefully AI is right for all next week. 4-6" of snow on Monday and 70 and sun in spots come Friday. -
Outta gas and Outta Time: Early March Winter Storm finale
mitchnick replied to Ji's topic in Mid Atlantic
Off and on, though better "at times" imho. But you never know if this is one of those times. Would prefer the AI and operational to agree. -
Outta gas and Outta Time: Early March Winter Storm finale
mitchnick replied to Ji's topic in Mid Atlantic
.thumb.png.1f3c870d940995be48ec456348caf1d4.png)
-
Outta gas and Outta Time: Early March Winter Storm finale
mitchnick replied to Ji's topic in Mid Atlantic
EuroAI.thumb.png.058d59e98660ac974e56477be05d06e3.png)
-
Outta gas and Outta Time: Early March Winter Storm finale
mitchnick replied to Ji's topic in Mid Atlantic
Not out yet on Pivotal. -
Outta gas and Outta Time: Early March Winter Storm finale
mitchnick replied to Ji's topic in Mid Atlantic
It got old. -
Outta gas and Outta Time: Early March Winter Storm finale
mitchnick replied to Ji's topic in Mid Atlantic
Gefs(27).thumb.png.6a70de46bc0fd106f3ca73f056929675.png)
-
Outta gas and Outta Time: Early March Winter Storm finale
mitchnick replied to Ji's topic in Mid Atlantic
You can have this one. I'll take the one the first week of April. Lol -
Outta gas and Outta Time: Early March Winter Storm finale
mitchnick replied to Ji's topic in Mid Atlantic
It's headed back north with the last frame. -
Outta gas and Outta Time: Early March Winter Storm finale
mitchnick replied to Ji's topic in Mid Atlantic
GfsAi miss to the south -
Outta gas and Outta Time: Early March Winter Storm finale
mitchnick replied to Ji's topic in Mid Atlantic
Similar to 6z EuroAI


.png.2e21b88065026619ad3c384a8d30b9a0.png)


.png.8240e6df28b444768fa98786efdd6673.png)
.png.e375873637b4a3201fa94a760adc9ef6.png)
.png.101d2c9b061817e992156316402e6865.png)
(27).png.bdbcf7c14a539aabd0b94c04b97defdb.png)