bluewave
-
Posts
36,850 -
Joined
-
Last visited
Content Type
Profiles
Blogs
Forums
American Weather
Media Demo
Store
Gallery
Everything posted by bluewave
-
Yeah, at least the 100°+ heat has really been front-loaded during the 2020s. Monthly Highest Max Temperature for HARRISON, NJ May-September Click column heading to sort ascending, click again to sort descending. Mean 92 98 101 97 91 101 2020 87 96 98 97 91 98 2021 93 101 100 99 90 101 2022 96 98 102 101 92 102 2023 89 93 97 92 96 97 2024 88 100 101 100 86 101 2025 88 103 102 95 90 103 2026 100 97 106 M M 106 Monthly Number of Days Max Temperature >= 100 for HARRISON, NJ May-September Click column heading to sort ascending, click again to sort descending. Mean 0 1 2 0 0 3 2020 0 0 0 0 0 0 2021 0 1 1 0 0 2 2022 0 0 3 1 0 4 2023 0 0 0 0 0 0 2024 0 1 1 1 0 3 2025 0 3 3 0 0 6 2026 1 0 3 M M 4
-
2026-2027 Super El Nino
bluewave replied to Stormchaserchuck1's topic in Weather Forecasting and Discussion
1997 -1998 would be a case of the warmest departures for NYC occurring in January and February. The actual February average temperature was the warmest monthly temperature of the winter. Dec…38.2°….+2.0 Jan…40.0°…..+8.6° Feb…..40.6°….+7.0° 2023-2024 had the warmest departure in December and the 2nd warmest in February. Dec…44.6°…..+5.5° Jan….37.0°……+3.3° Feb….40.1°……+4.2° 2015-2016 was the most extreme front-loaded super El Niño for warmth with +13.3 in December. Dec….50.8°…..+13.3° Jan…..34.5°….+1.9° Feb…..37.7°……+2.4° -
2026-2027 Super El Nino
bluewave replied to Stormchaserchuck1's topic in Weather Forecasting and Discussion
Parts of the East had their lowest snowfall of the 1800s that winter. The big story during the 1877-1878 super El Niño was the warmth in the Upper Midwest. It’s an example how really strong El Niños can sometimes have their warmest departures in February. While we don’t have the 1841-1870 climate normals for MSP, I used the earliest available 30 year period. The departures for them that winter would have been like if December 2015 had run through February 2016 in the Northeast with no pattern reversal. MSP 1877-1878 DEC….+14.5 JAN…..+9.8 FEB……+15.8 Monthly Mean Avg Temperature for Minneapolis-St Paul Area, MN (ThreadEx) Click column heading to sort ascending, click again to sort descending. Mean 19.3 12.0 15.7 15.6 Max 33.8 1877 25.9 1880 31.9 1877 1872-1873 6.0 5.4 12.8 8.1 1873-1874 17.6 12.2 12.6 14.1 1874-1875 17.2 -3.4 -2.6 3.7 1875-1876 24.7 15.7 15.9 18.8 1876-1877 8.3 8.6 31.9 16.3 1877-1878 33.8 21.8 31.5 29.0 1878-1879 19.1 16.1 12.7 16.0 1879-1880 11.5 25.9 19.6 19.0 1880-1881 13.2 7.9 17.1 12.7 1881-1882 29.0 19.0 30.4 26.1 1882-1883 15.0 0.8 12.1 9.3 1883-1884 19.7 8.8 12.9 13.8 1884-1885 14.8 4.4 11.3 10.2 1885-1886 21.0 3.7 14.9 13.2 1886-1887 7.3 0.7 9.4 5.8 1887-1888 17.4 -0.4 13.1 10.0 1888-1889 25.2 20.7 10.6 18.8 1889-1890 28.8 10.6 19.2 19.5 1890-1891 24.4 21.6 11.8 19.3 1891-1892 30.1 13.5 22.9 22.2 1892-1893 16.8 7.3 12.0 12.0 1893-1894 14.0 12.3 15.7 14.0 1894-1895 28.1 7.0 12.0 15.7 1895-1896 22.5 16.8 22.3 20.5 1896-1897 24.4 10.6 20.0 18.3 1897-1898 15.3 23.0 20.6 19.6 1898-1899 14.1 13.7 7.8 11.9 1899-1900 21.4 21.3 8.6 17.1 1900-1901 21.0 15.2 12.3 16.2 1901-1902 15.9 18.7 18.2 17.6 -
2026-2027 Super El Nino
bluewave replied to Stormchaserchuck1's topic in Weather Forecasting and Discussion
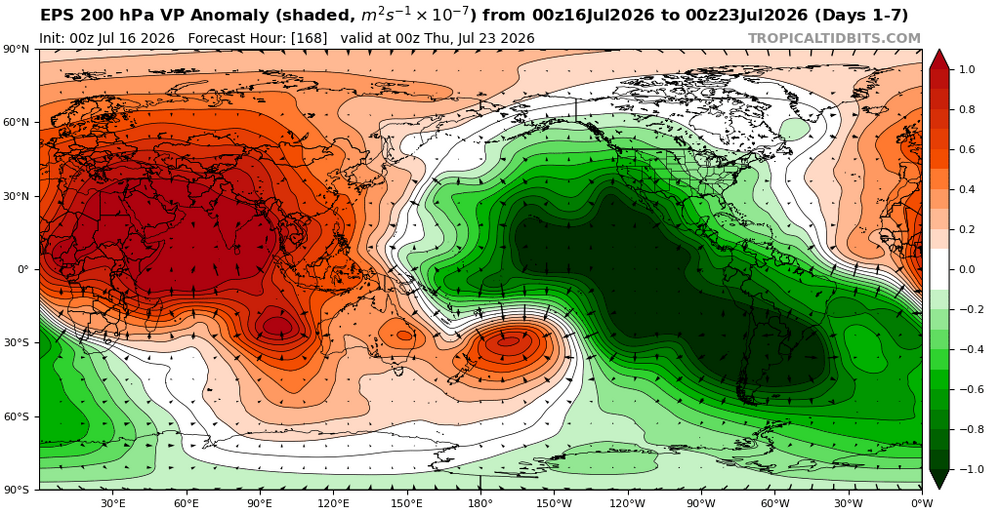
The variability we have been getting into mid-July is more a function of the mid-latitude wave pattern doing its own thing relative to the tropics through mid-July with the strong -PDO +AMO summer 2020s background pattern. It’s a first for the developing super El Niño composite including 2023, 2015, 1997, 1982, and 1972. The current forcing from 150E to 30W is more impressive than both 2015 and 1997 combined. This doesn’t rule out intervals of IO to MC forcing into the winter. But it could be an early sign than the -PDO +AMO mid-latitude enhanced ridge pattern could overlap with the super El Niño composite going into the winter.
-
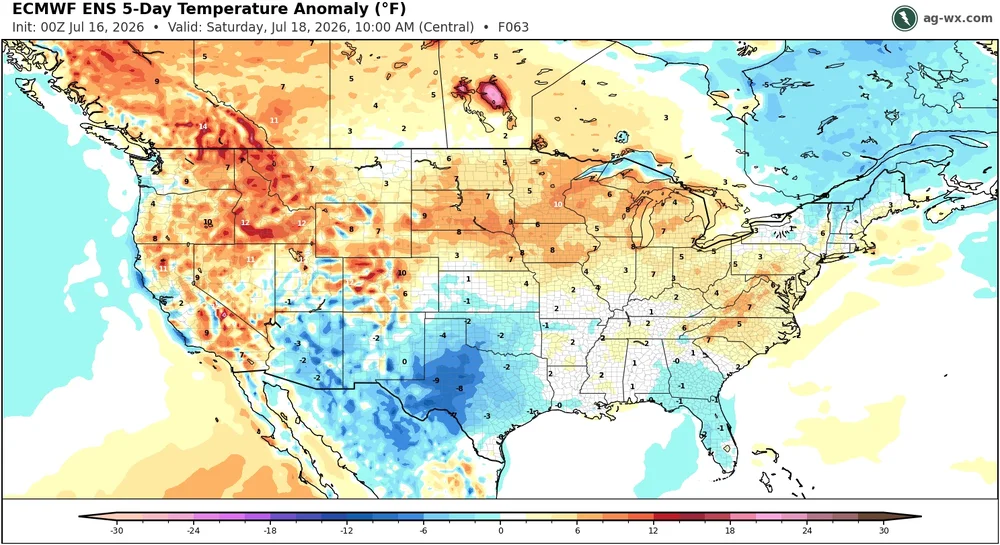
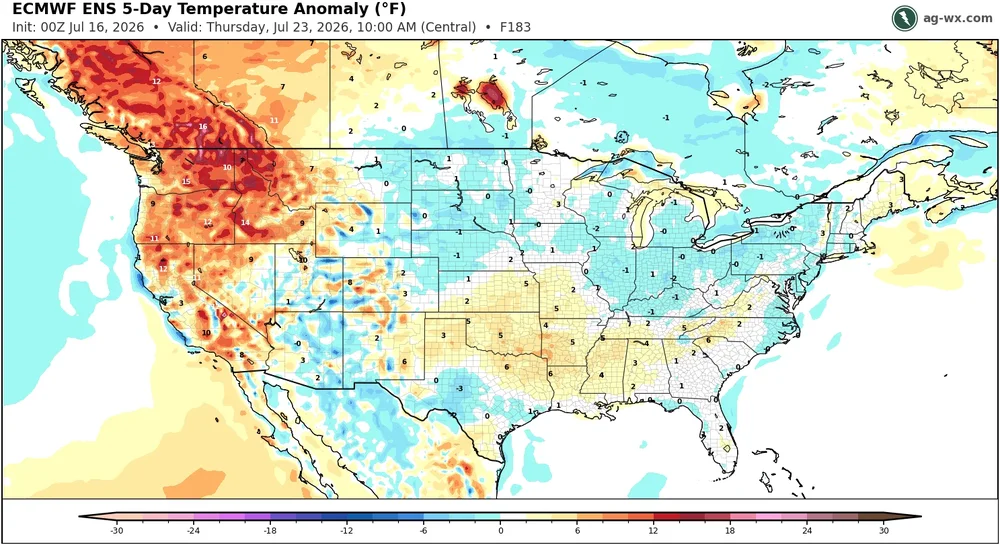
Looks like the heat shifts to Western CONUS heading into late July with more comfortable temperatures here.
-
This summer is following the 2020s theme of top 10 warmth from June 1st to July 15th. This has allowed several of the warm spots around the region to record 20+ days reaching 90°. Harrison is in 2nd place for the most 90° days by July 16th. Time Series Summary for NEW BRUNSWICK 3 SE, NJ Warmest June 1st to 15th Click column heading to sort ascending, click again to sort descending. 1 2024-07-15 76.1 0 2 2010-07-15 75.5 0 3 2026-07-15 74.9 0 4 2025-07-15 74.4 0 5 2013-07-15 74.3 0 - 2008-07-15 74.3 0 6 1994-07-15 74.2 0 7 2021-07-15 74.0 0 8 2020-07-15 73.8 0 9 2005-07-15 73.7 0 10 2012-07-15 73.4 0 Time Series Summary for POUGHKEEPSIE/HUDSON VALLEY REGIONAL AIRPORT, NY Click column heading to sort ascending, click again to sort descending. 1 2024-07-15 73.5 0 2 2025-07-15 73.3 0 3 2005-07-15 72.8 1 4 2020-07-15 72.4 0 5 2026-07-15 72.2 0 - 2013-07-15 72.2 0 6 1949-07-15 72.1 0 7 1973-07-15 71.9 0 8 2010-07-15 71.8 1 9 2016-07-15 71.7 0 10 2021-07-15 71.6 0 Time Series Summary for WESTCHESTER CO AP, NY Click column heading to sort ascending, click again to sort descending. 1 2024-07-15 73.8 0 2 1995-07-15 73.6 32 3 2025-07-15 73.5 0 4 2010-07-15 73.4 1 5 1966-07-15 73.2 0 6 1999-07-15 72.7 2 7 2026-07-15 72.6 0 8 2013-07-15 72.2 0 9 1994-07-15 72.0 1 10 2008-07-15 71.8 0 Time Series Summary for ISLIP-LI MACARTHUR AP, NY Click column heading to sort ascending, click again to sort descending. 1 2025-07-15 74.1 0 2 2010-07-15 74.0 0 3 2024-07-15 73.7 0 - 1999-07-15 73.7 0 4 1966-07-15 73.2 0 5 1994-07-15 73.1 0 6 2026-07-15 72.8 0 - 2013-07-15 72.8 0 7 2020-07-15 72.6 0 - 2008-07-15 72.6 0 8 2019-07-15 72.3 0 - 2014-07-15 72.3 0 9 2011-07-15 72.2 0 10 1993-07-15 72.0 0 Data for January 1, 2026 through July 16, 2026 #90° days Click column heading to sort ascending, click again to sort descending. ESTELL MANOR COOP 23 HARRISON COOP 23 TETERBORO AIRPORT WBAN 21 Atlantic City Area ThreadEx 21 ATLANTIC CITY INTL AP WBAN 21 NEWARK LIBERTY INTL AP WBAN 20 New Brunswick Area ThreadEx 20 TETERBORO AIRPORT COOP 20 Newark Area ThreadEx 20 NEW BRUNSWICK 3 SE COOP 20 Time Series Summary for HARRISON, NJ Most 90° days through July 16th Click column heading to sort ascending, click again to sort descending. 1 2024-07-16 24 0 2 2026-07-16 23 1 - 2010-07-16 23 17 3 2021-07-16 21 0 - 2018-07-16 21 0 4 2012-07-16 20 19 - 2002-07-16 20 5
-
2026-2027 Super El Nino
bluewave replied to Stormchaserchuck1's topic in Weather Forecasting and Discussion
This could be the first event that is still a super El Niño into March using Nino 3.4 -
Yeah, that area is closer to the wildfires. Probably a new record for them. From the study below it had the AQI in NYC getting above 480 back in June 2023. https://www.rmets.org/metmatters/worst-air-quality-world-wildfire-smog-smothers-new-york
-
-
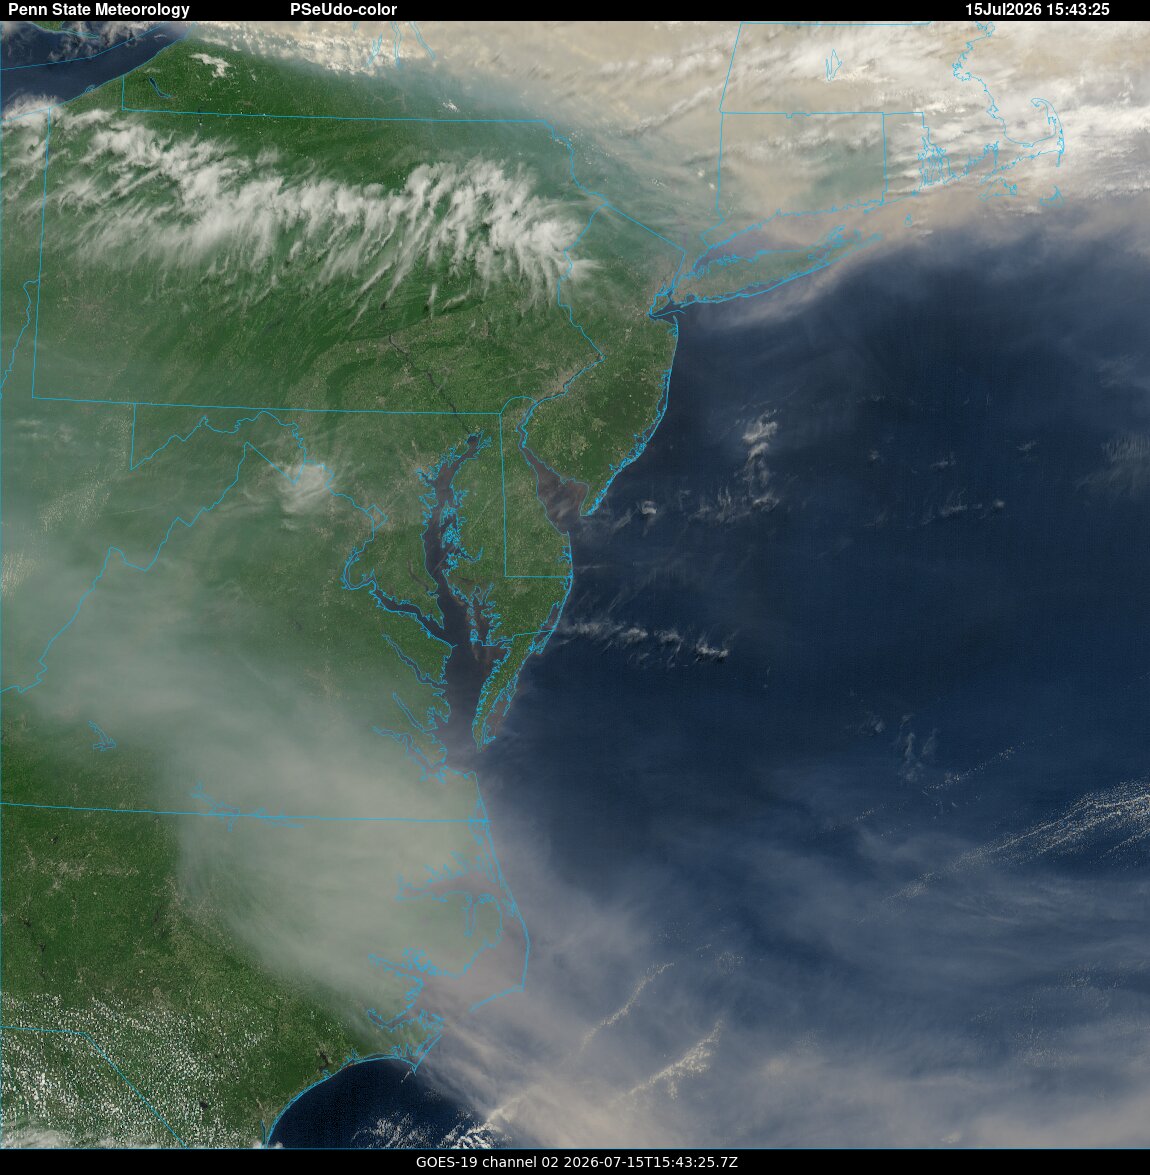
The maps haven’t updated yet to include the wildfires in Ontario that started on July 13th. Mark Parrington @mparrington.bsky.social Follow Analysis of 2026 Canada #wildfire emissions up to 9 July with the #CopernicusAtmosphere GFAS dataset shows more typical onset and magnitude following the previous three extreme years. Fires have been burning across the country from NWT to Newfoundland. @copernicusecmwf.bsky.social @ecmwf.int 10:19 AM · Jul 10, 2026 Everybody can reply 16 reposts 1 quote 29 likes 1 save 2 17 29 Mark Parrington @mparrington.bsky.social · 5d Total estimated wildfire emissions from NWT are currently similar to 2023 (&2014) so far with half of the summer still to come. Although at much smaller scale in terms of emissions, fires in southern regions of Nunavut are already at the highest level for the territory in the 24-year GFAS dataset. 1 2
-
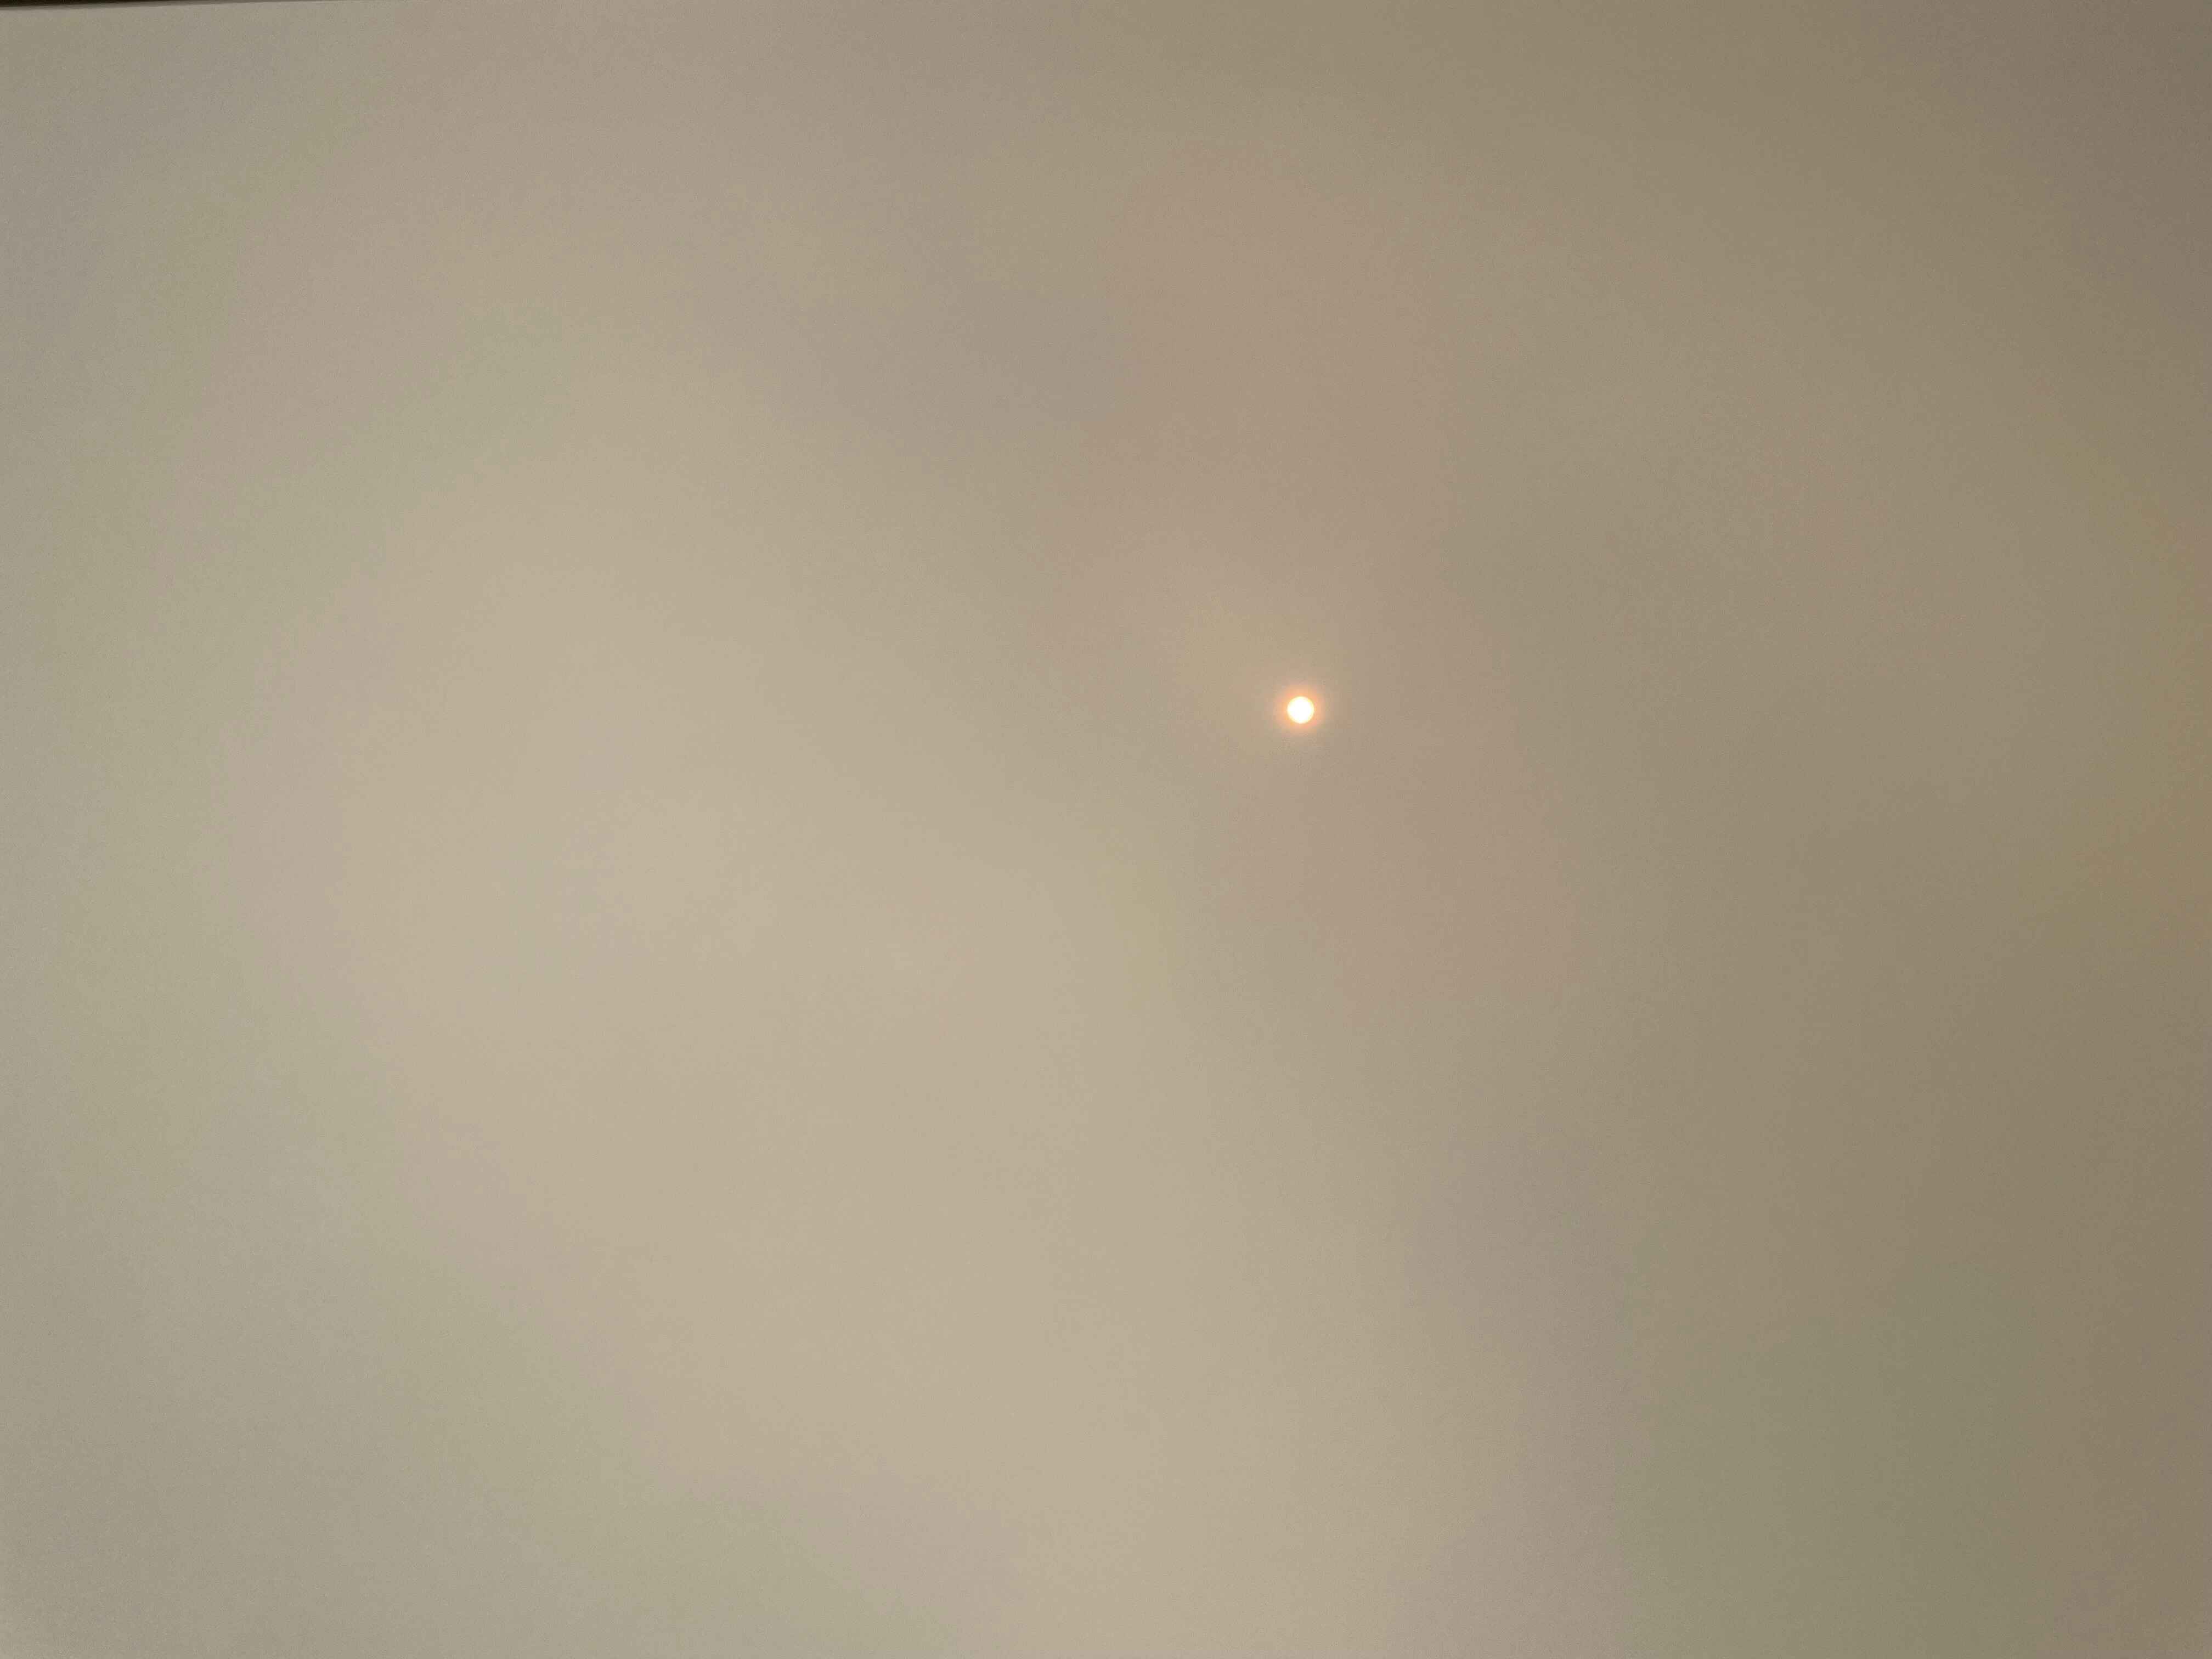
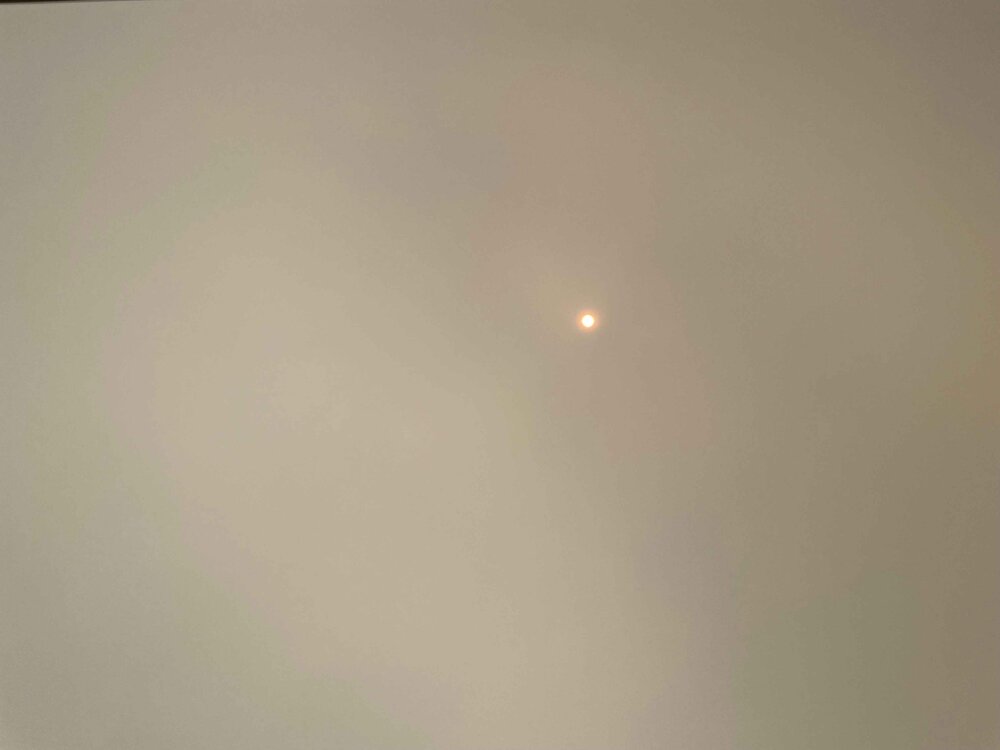
Easily the worst air quality since moving to the CT Shoreline and thickest wildfire smoke that I have experienced since June 2023. Very strong smell of smoke and anyone with even the slightest respiratory issues should stay indoors. Your eyes and throat start to sting after being outside for more than a few minutes.

-
Really extreme to see parts of France go +10° F for the first half of summer using the warmest 1991-2020 climate normals. With a +4.2°C deviation from the already warmed 1991-2020 baseline, the tally for the first half of the meteorological summer is eye-opening. The 2026 anomaly forces us to scale up the graph, to the point of literally compressing 2003 (+2.8°C "only"). ➡️From the Center-West to Burgundy, we're seeing unprecedented values of +5 to +6°C. ➡️The rainfall deficit is just as stark, ranging from -30% in the north to -100% in the Var. The Center-West, where the vegetation is already completely scorched, hovers between -60 and -80%. ➡️Over the past month, nearly every day has been spent above the heatwave threshold, with only a 4-day pause at the start of July. ➡️The third heatwave should wrap up this weekend. But in the southwest, temperatures will remain heatwave-level (34 to 38°C) for an indeterminate period. Given the hot air mass south of Europe, we're far from safe from a 4th heatwave later in the summer. France is dry and scorched. After already surpassing 2003 with the hottest day ever observed in France, the year 2026 now exceeds the droughts of 1976 and 2022. The soil moisture index reaches its lowest level ever measured for a July 9. And the situation continues to worsen. A new hairdryer effect is expected in the central west starting Sunday. From the sky, France appears literally burned: parched meadows, defoliation of forests, summer crops in great distress (corn, soy, sunflower), and early winter harvests contribute to this color. As if that weren't enough, we have just broken the NATIONAL RECORD for the hottest night ever observed with 30.6°C in Céret in the Pyrénées-Orientales at the "coolest" point of the morning. Photo from the NAOO-21 / VIIRS satellite (true color).
-
2026-2027 Super El Nino
bluewave replied to Stormchaserchuck1's topic in Weather Forecasting and Discussion
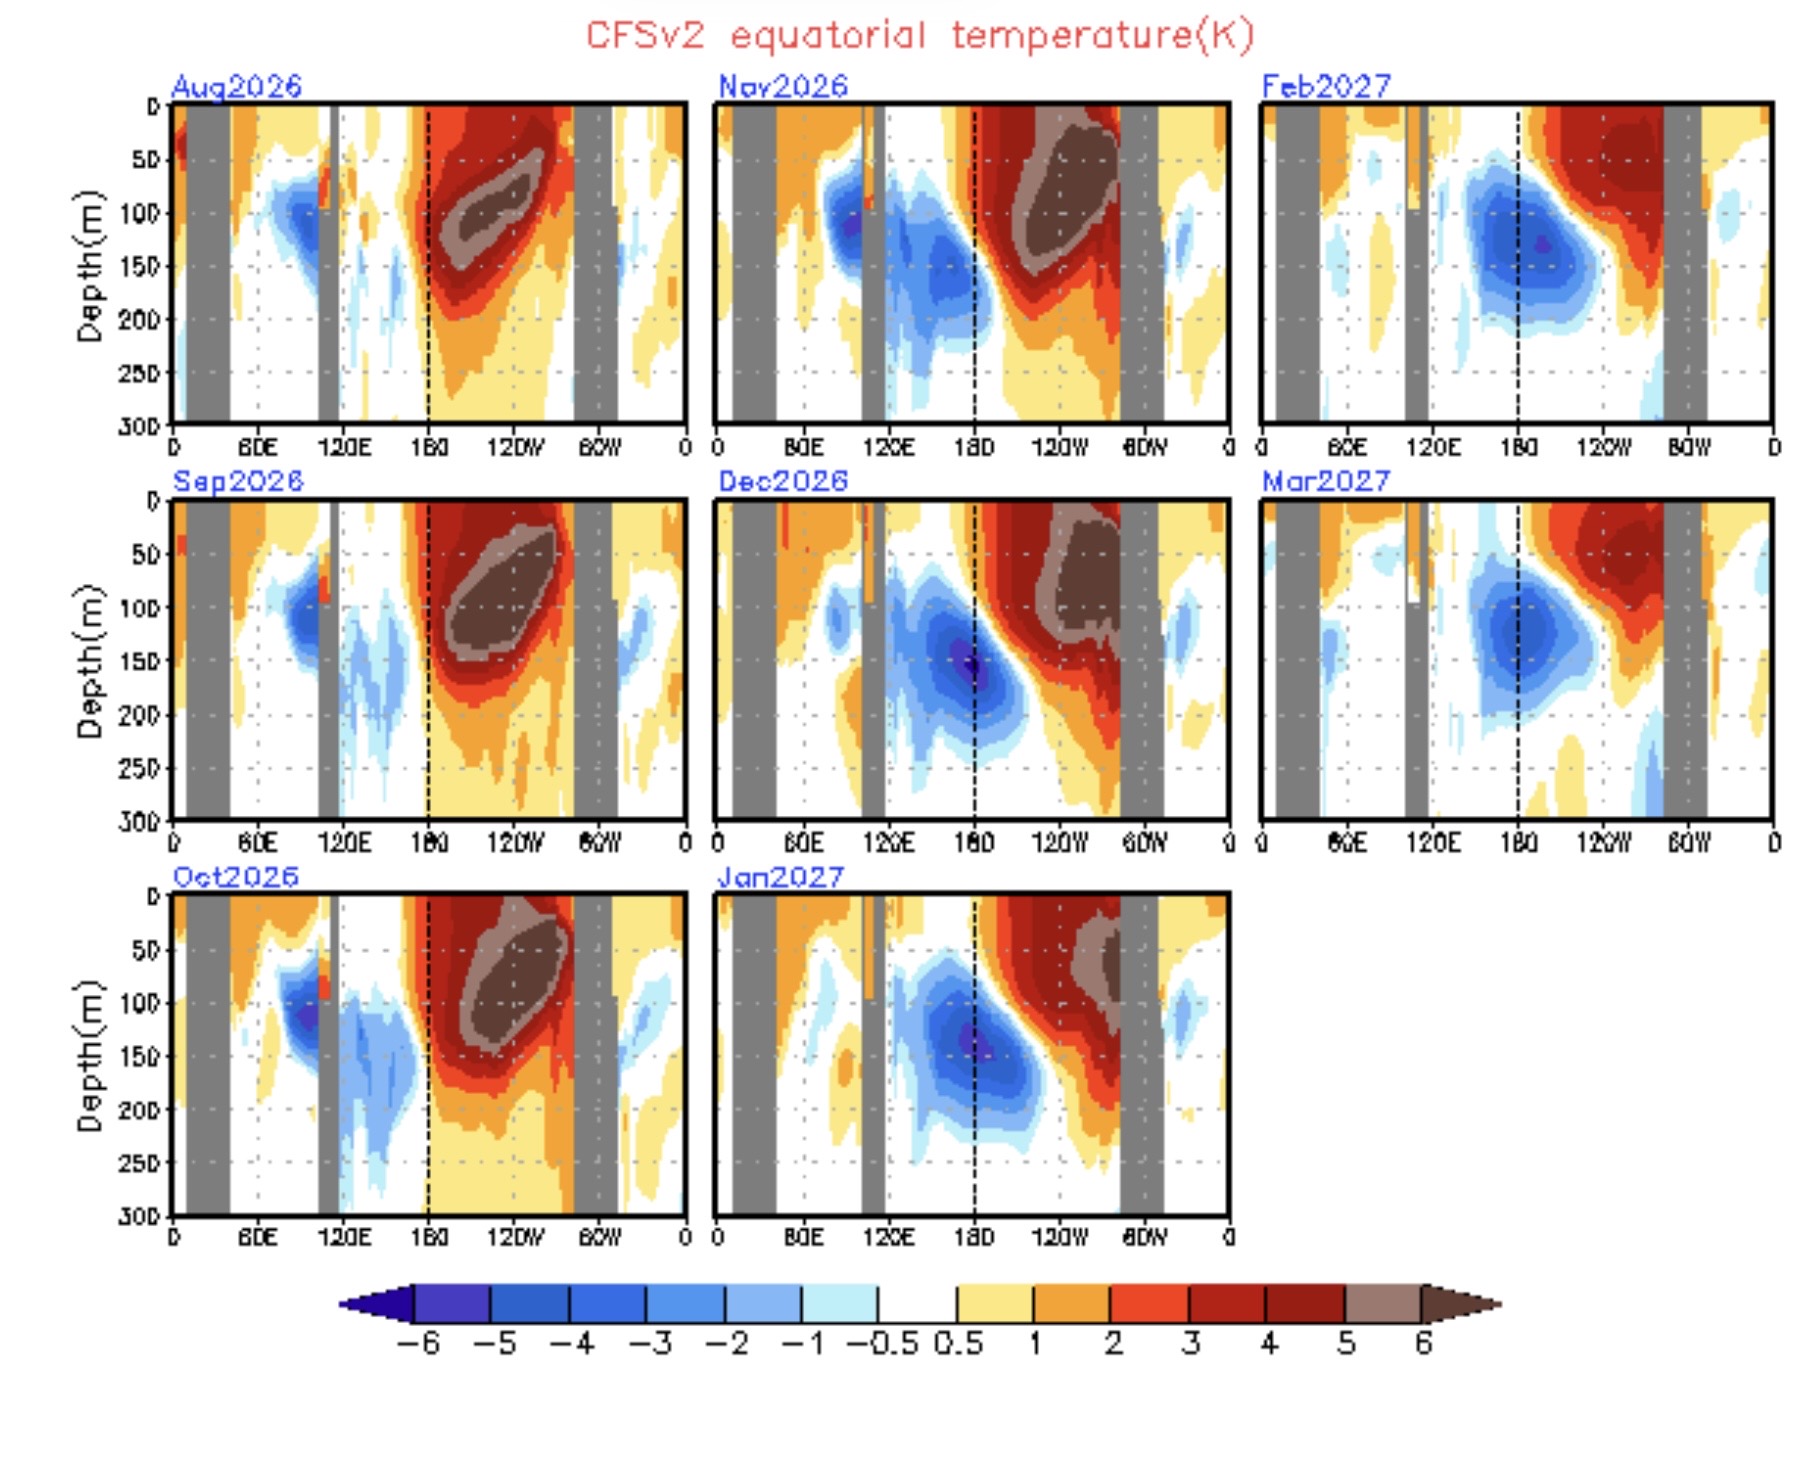
While these long range subsurface charts from the CFS can lose skill, it’s impressive that the El Niño is still going strong in Nino 1+2 by March. The model is trying to show this taking time to weaken due to how strong it gets. The developing cold pool to the west isn’t as strong as 1998 was.
-
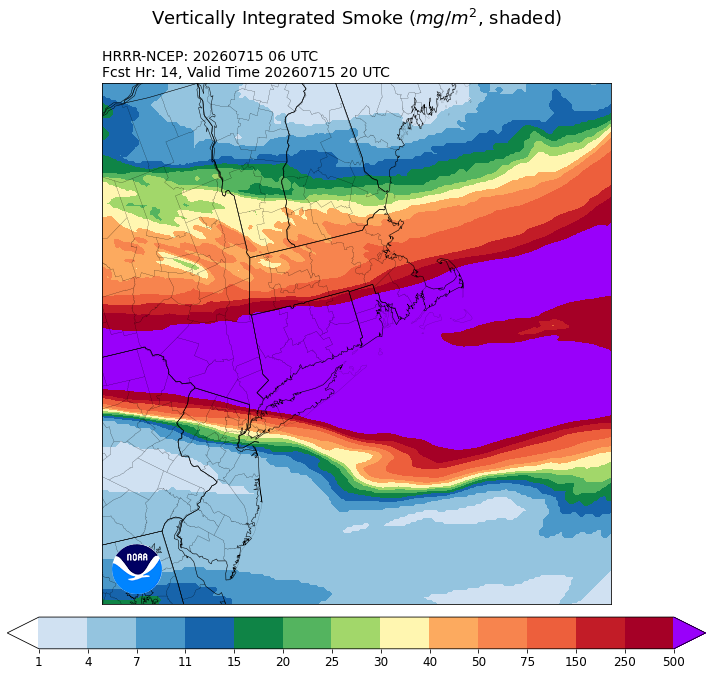
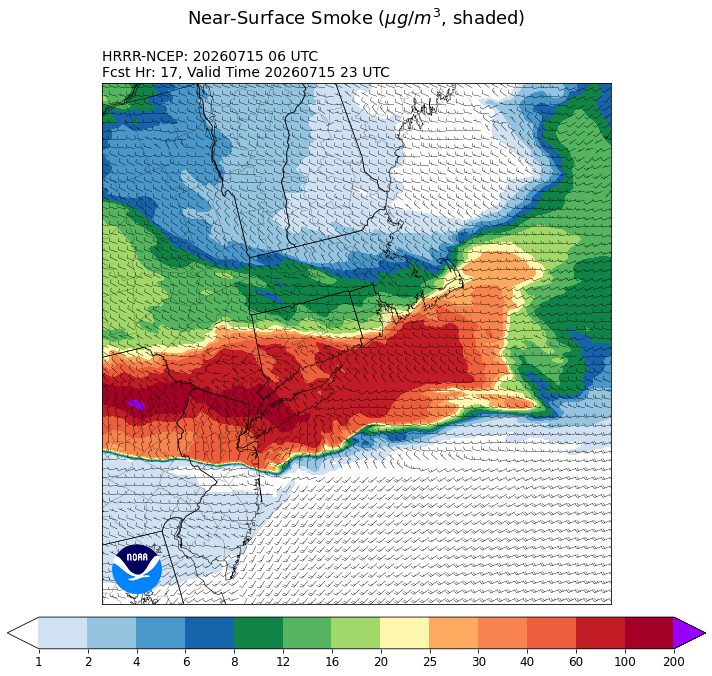
Unfortunately, the near surface smoke is forecast to get thicker later. https://rapidrefresh.noaa.gov/hrrr/HRRRsmoke/Welcome.cgi?dsKey=hrrr_ncep_smoke_jet&domain=NYC-BOS&run_time=15+Jul+2026+-+06Z
-
2026-2027 Super El Nino
bluewave replied to Stormchaserchuck1's topic in Weather Forecasting and Discussion
That relaxation of the ridge and heat has been the pattern since May following these periods of record heat and ridging. If the ridge returns again in early August, then we’ll know the pattern is continuing. But if the trough can hold on, then it would look more like a traditional developing super El Niño mid-latitude summer pattern in the East. It would be nice to get an extended break from these periods of record warmth and ridging. The shear across the Caribbean with this record breaking super El Niño is more like what they see in December. -
2026-2027 Super El Nino
bluewave replied to Stormchaserchuck1's topic in Weather Forecasting and Discussion
It would be interesting to see what is causing the delayed response this time in the mid-latitudes. Even by MJJ in 2023 with all that mid-latitude SST warmth and strong -PDO +AMO, the pattern was strongly El Niño in the mid-latitudes. While summer correlations are weaker with the larger El Niño grouping including weak and moderate, the developing super El Niño subset has been fairly strong. At least so far we are seeing something new from this one for MJJ. -
2026-2027 Super El Nino
bluewave replied to Stormchaserchuck1's topic in Weather Forecasting and Discussion
Getting very close in Nino 1+2 now to 1997 with 2026 leading in all other areas. https://www.cpc.ncep.noaa.gov/data/indices/ …….Nino1+2 Nino3 Nino34 Nino4 Week SST SSTA SST SSTA SST SSTA SST SSTA 08JUL2026 25.5 3.4 28.3 2.3 29.4 2.0 30.0 1.2 08JUL2015 24.7 2.5 27.8 1.8 28.7 1.3 29.8 1.0 09JUL1997 25.6 3.5 27.7 1.7 28.6 1.3 29.3 0.5 -
2026-2027 Super El Nino
bluewave replied to Stormchaserchuck1's topic in Weather Forecasting and Discussion
Yeah, I have been saying this for a while now. Once past the spring predictability barrier, the models like the Euro do a great job with ENSO SST plumes forecast. So the record breaking nature of this event isn’t in doubt. We can see the strong coupling with the atmospheric patterns in the tropics and the very high shear in the Caribbean. But the subtropics or mid-latitudes continue to do their own thing. It’s a very strong -PDO pattern north of the tropics rights now. If this mid-latitude pattern can continue to have some influence going into the winter, then the Aleutian low could split or end up in a different location than usual. It’s also possible the typical strong Nino ridge south of Hudson Bay could at least at times get displaced further to the south over the Eastern CONUS. This could mean that the heavily precipitation zones with the STJ may vary from the 1997-1998 locations like we saw in 2015-2016 and 2023-2024. -
2026-2027 Super El Nino
bluewave replied to Stormchaserchuck1's topic in Weather Forecasting and Discussion
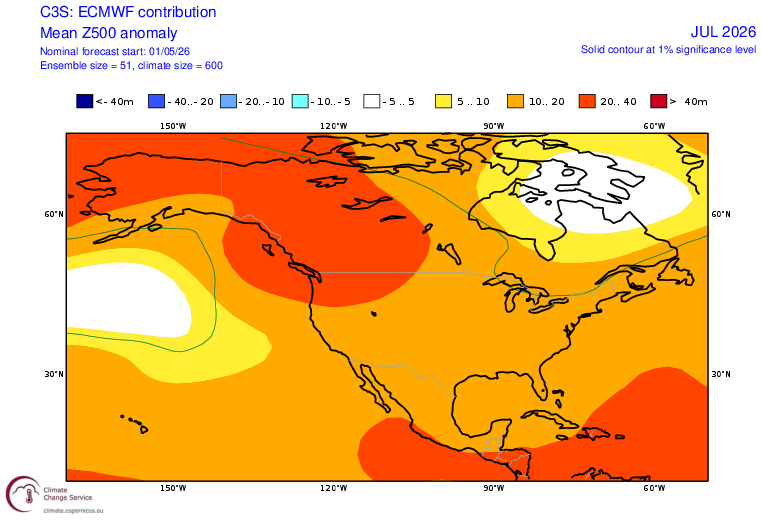
This is another example of how the models past 15 days really don’t have much skill other than general forecasts for ENSO SST plumes. Notice the locations of the ridges and troughs verifying are reversed from the seasonal forecast issued in May. Most of the time during the 2020s summers the long range models miss the strong -PDO and +AMO influence of these greatly expanded subtropical or mid-latitude ridges. July forecast issued in May Verification so far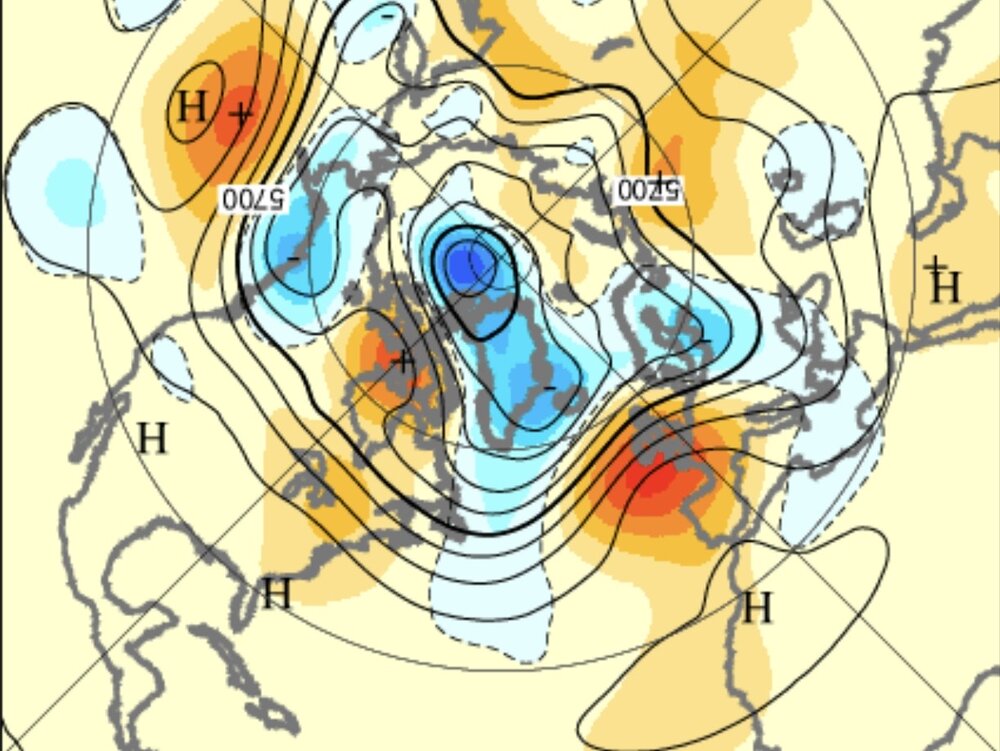
-
2026-2027 Super El Nino
bluewave replied to Stormchaserchuck1's topic in Weather Forecasting and Discussion
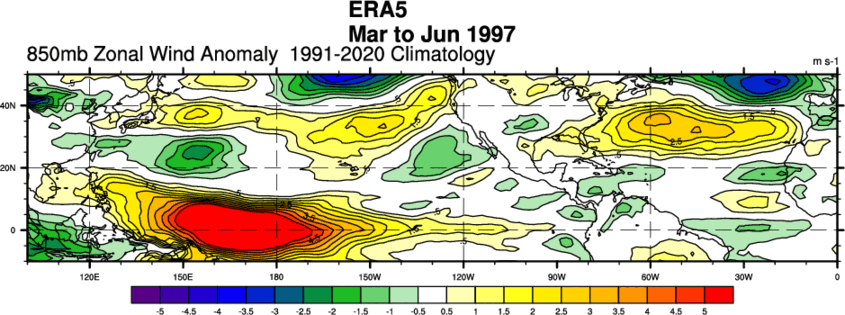
In the old days with super El Niños, the strong low level westerlies would extend north from the tropics into the mid-latitudes like in 1997. During the 2020s, the subtropical or mid-latitude ridges have grown to record levels. So the westerly flow is much weaker with the high pressure dominating. The warm pool from Japan to north of Hawaii is allowed to continue leading to the persistent -PDO. This prevents the strong +PDO response that was typical in 1997 and 2015. This is also why we have see strong to record heat domes across the CONUS since May from time to time instead of the cooler typical El Niño pattern this time of year.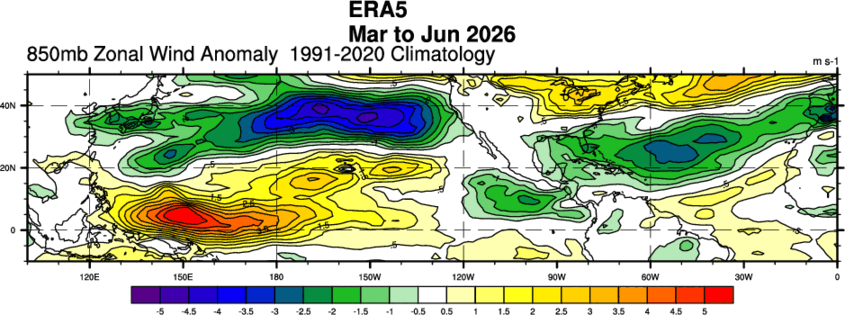
-
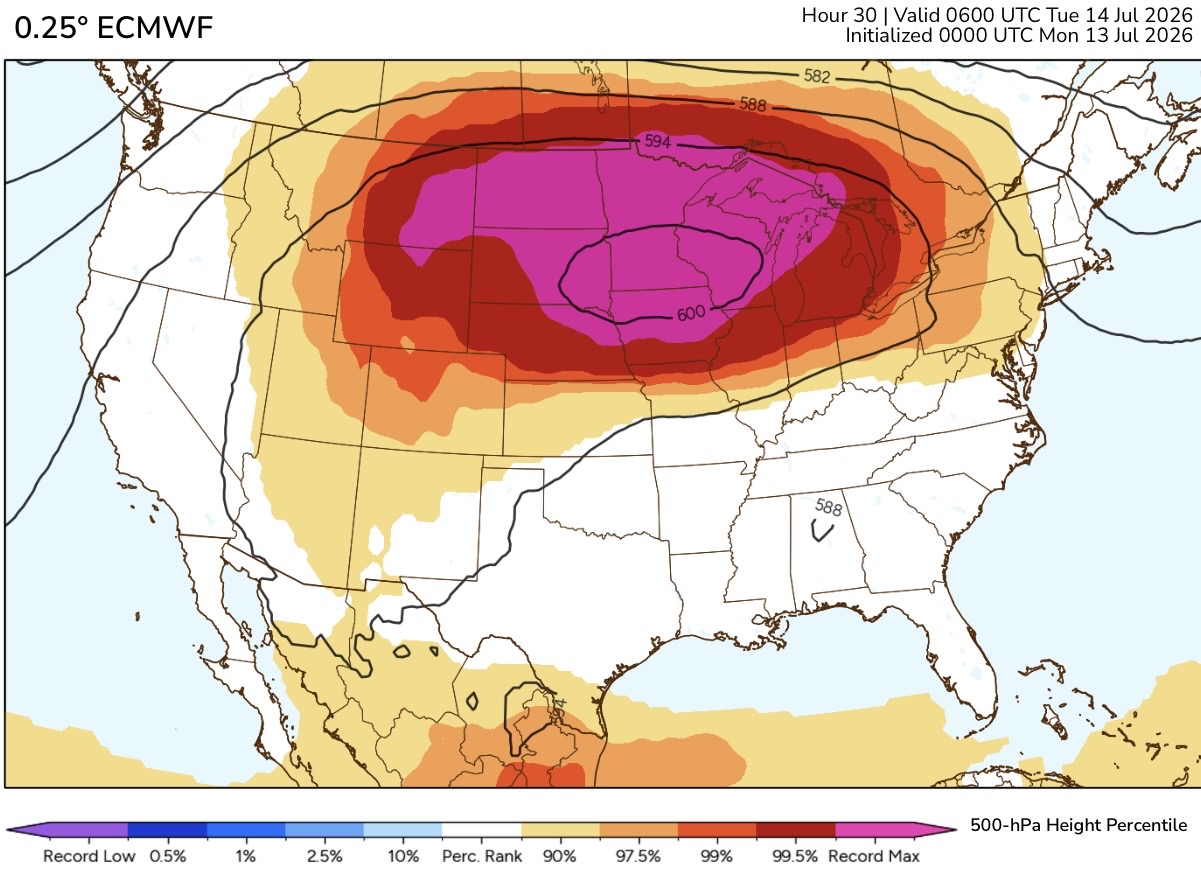
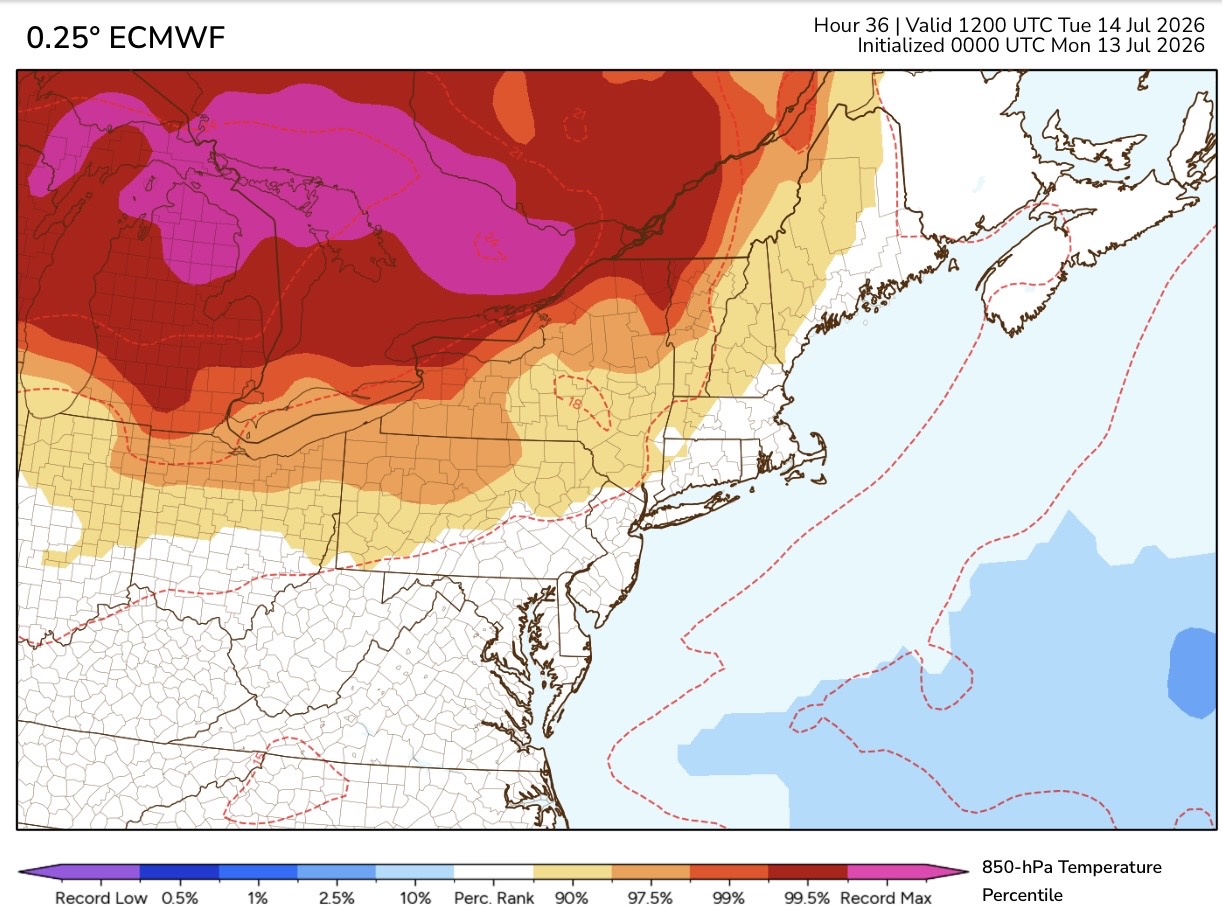
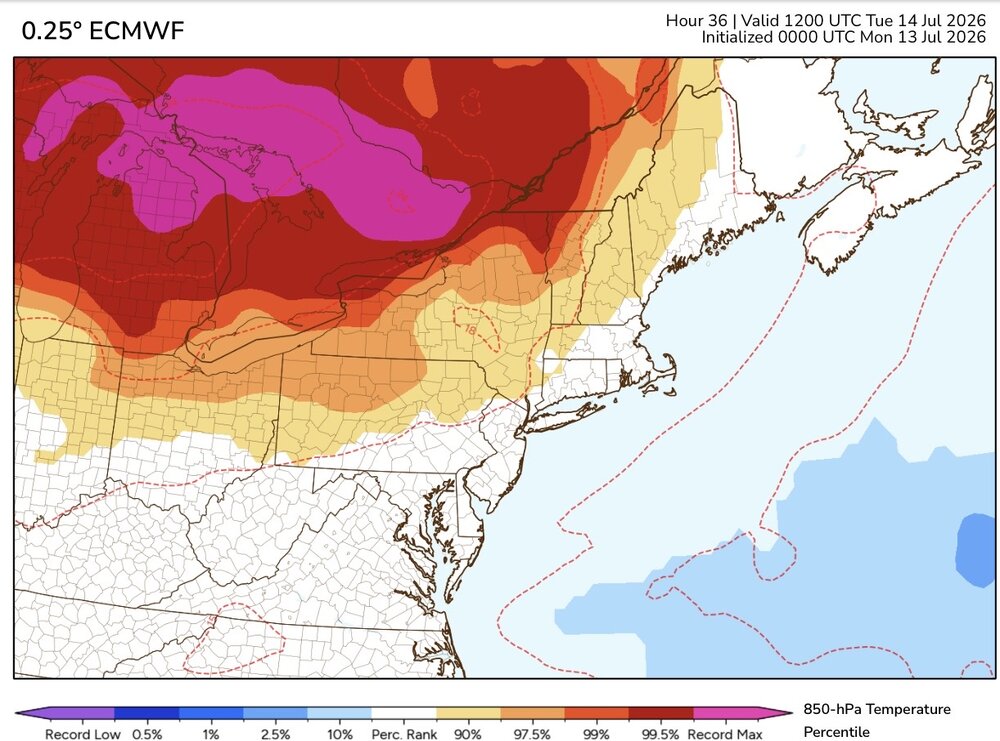
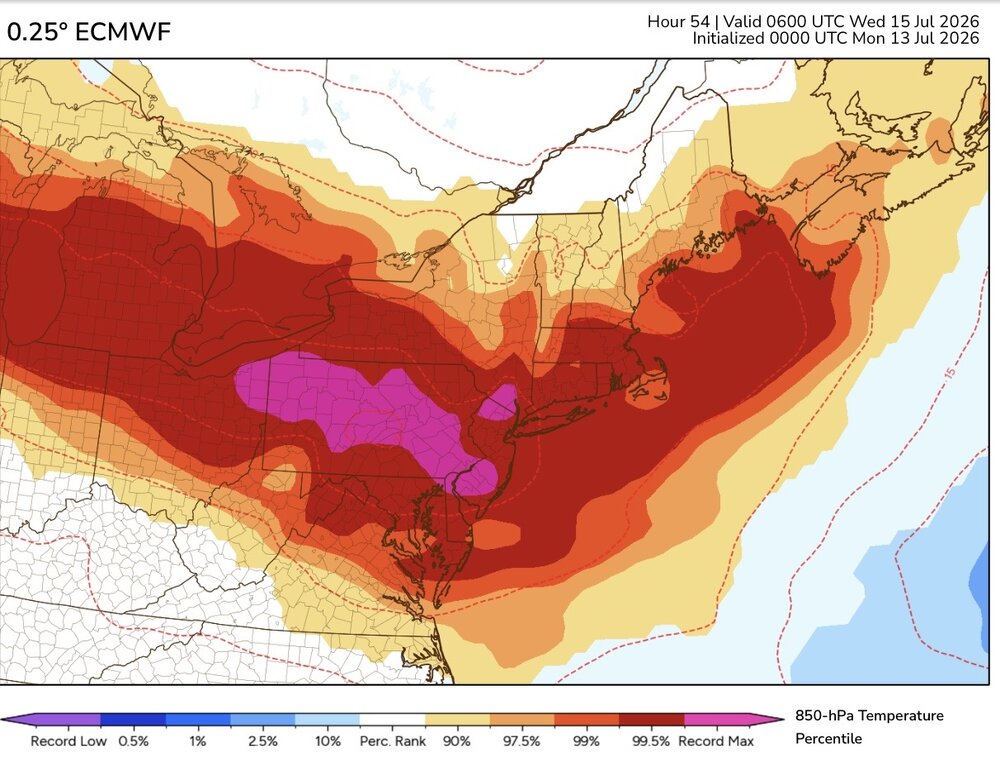
All-time record highs with this developing record 600 dm ridge. The 850 mb plume is forecast to set all-time warmest 850mb temperatures from Ontario into the Northeast. But the models have the 850 mb temperatures peaking at night. So they actually begin coming down a bit during Wednesday afternoon. The Euro and GFS both have 100°-103° at the warmest spots across the region Wednesday. RECORD EVENT REPORT NATIONAL WEATHER SERVICE BILLINGS MT 506 PM MDT SUN JUL 12 2026 ...RECORD HIGH TEMPERATURES ACROSS THE REGION TODAY... HERE IS A SUMMARY OF DAILY RECORDS AND ALL-TIME RECORDS TIED OR BROKEN SO FAR TODAY, SUNDAY, JULY 12TH. DAILY RECORDS BROKEN SITE HIGH TEMP PREVIOUS RECORD PERIOD OF RECORD BEGINS BILLINGS 111 107 (2002) 1934 LIVINGSTON 105 103 (2002) 1948 MILES CITY 115 104 (1954) 1937 SHERIDAN 109 104 (2002) 1907 BAKER 110 103 (2006) 1998 ALL-TIME RECORDS TIED OR BROKEN SITE HIGH TEMP PREVIOUS ALL-TIME RECORD PERIOD OF RECORD BEGINS BILLINGS 111 108 (7/14/2002) 1934 LIVINGSTON 105 105 (8/5/1961) 1948 MILES CITY 115 111 (6/26/2012) 1937 SHERIDAN 109 107 (7/27/2021) 1907 BAKER 110 109 (7/25/2024) 1998 AN UPDATED SUMMARY OF DAILY AND ALL-TIME RECORDS WILL BE SENT AT THE END OF THE DAY IF NEEDED.

-
2026-2027 Super El Nino
bluewave replied to Stormchaserchuck1's topic in Weather Forecasting and Discussion
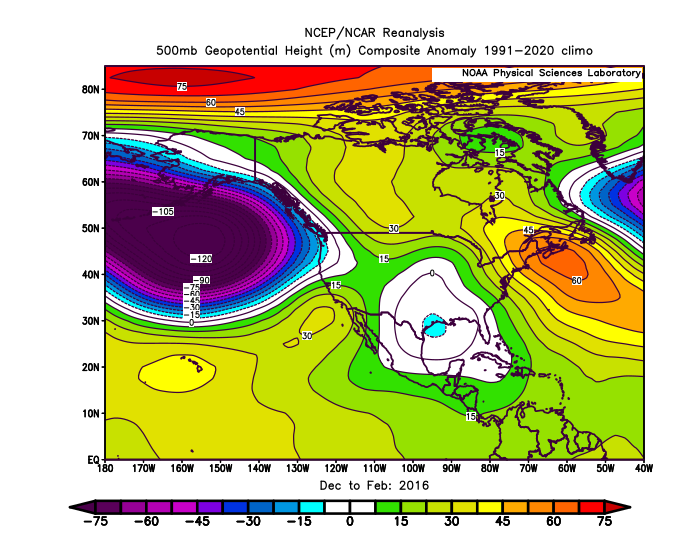
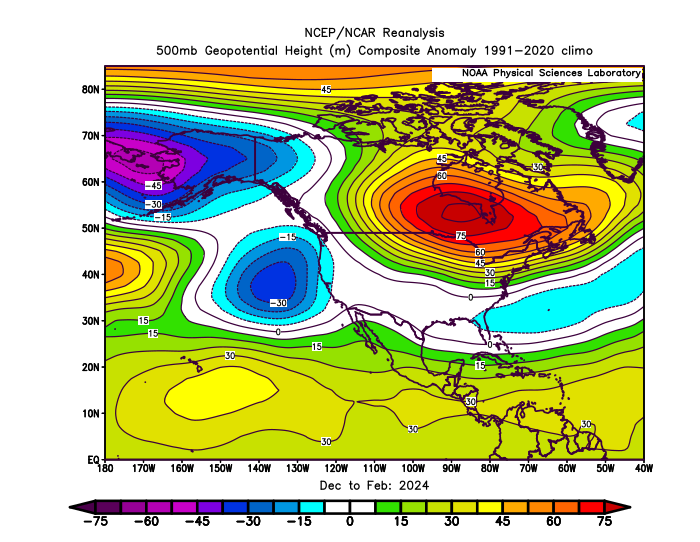
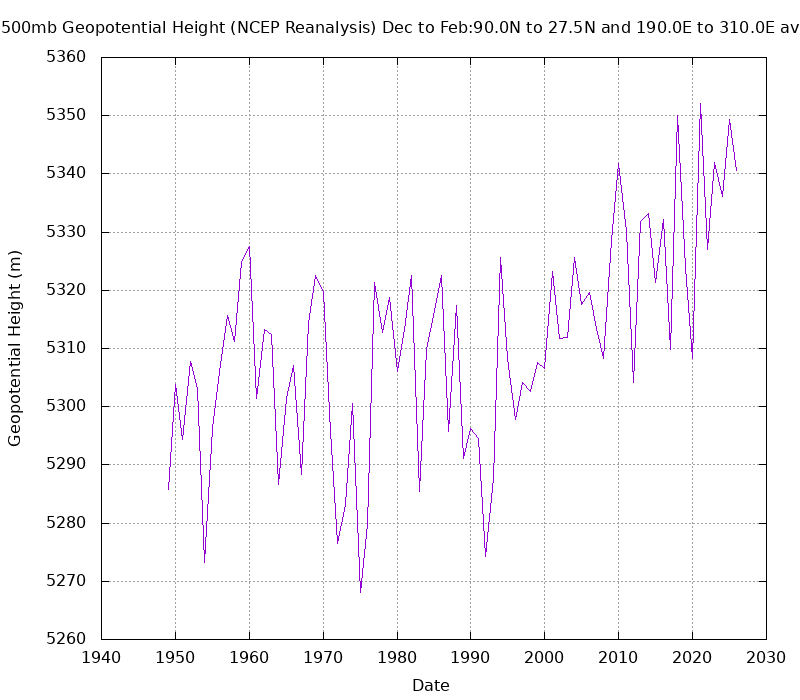
I realize that and was talking more generally about the DJF means. 1997-1998 had the strongest connection between the Aleutian low and the low across the Southern Tier of the CONUS. There is always going to be variability from month to month and season to season between different super El Ninos. By 2015-2016 the Aleutian low was weaker along with the low in the Southeast even with the strong +PDO. 2023-2024 also had a weaker Aleutian low that split into two pieces. So the low across the Southeast was weaker than 1997-1998 also in the means. It’s also possible that the warming climate leading stronger and more extensive ridges and weaker troughs is playing a role also. The chart below shows the rising 500mb heights over North America and the adjacent oceans during DJF.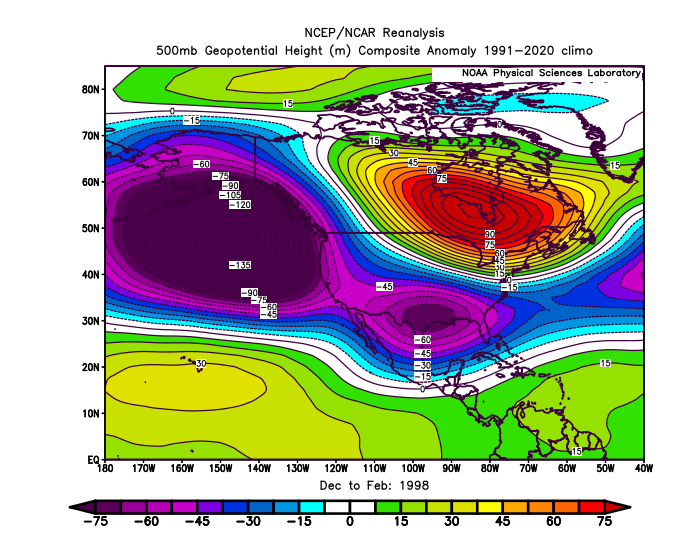
-
2026-2027 Super El Nino
bluewave replied to Stormchaserchuck1's topic in Weather Forecasting and Discussion
Yeah, 1997-1998 was the last canonical super El Niño. The La Niña-like influence in December 2015 merging with the Nino standing wave was through the MJO 5. The precipitation impacts were also different from previous super El Niños. In 2023-2024 we saw another MJO excursion through the IO and MC during January when the Southeast ridge emerged. The pattern since May has seen the strongest heat and ridging across the CONUS outside a neutral or La Niña summer with a strong -PDO influence. The summer -PDO drop and +AMO increase has been a common feature during the 2020s. So there are multiple ways for competing or overlapping marine heatwaves to interact with an El Niño. This summer is the most extreme example of a dominant -PDO pattern across the CONUS at the same time a record super El Niño is strengthening. The 2015-2016 and 2023-2024 super El Niños showed that the interaction actually resulted in warmer winters conditions than 1997-1998. Both winters featured the El Niño ridge south of Hudson Bay building down further into the Eastern U.S. than normal. But even if this event found a way to have the canonical 1997-1998 response, a +3.9 event alone without any -PDO or MC forcing influence could easily surpass 1997-1998 in spots for warmth. Ridges have been getting stronger than troughs regardless of whether we have an El Niño or La Niña.