-
Posts
36,141 -
Joined
-
Last visited
Content Type
Profiles
Blogs
Forums
American Weather
Media Demo
Store
Gallery
Everything posted by bluewave
-
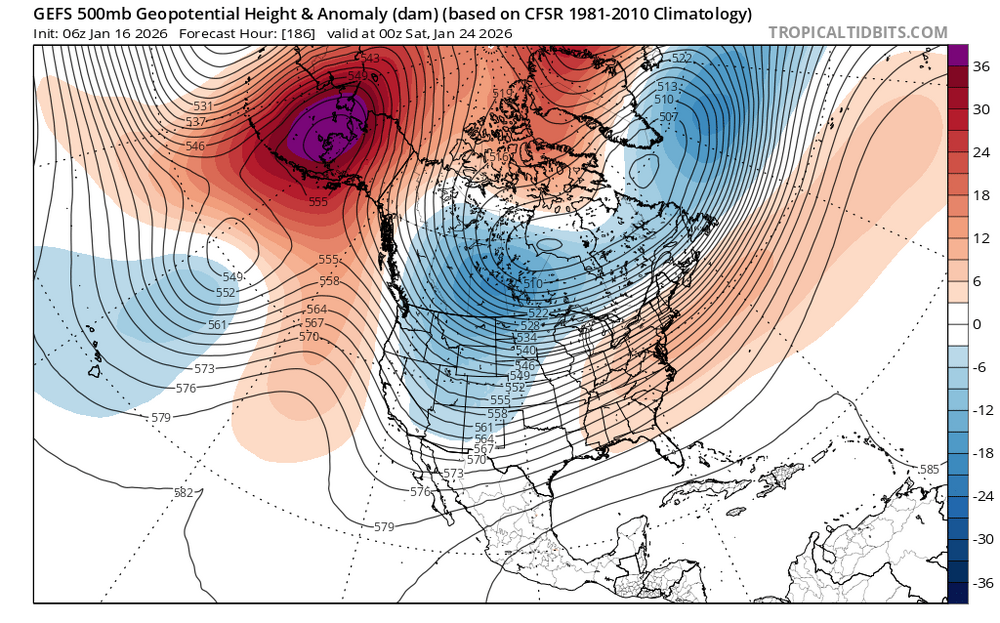
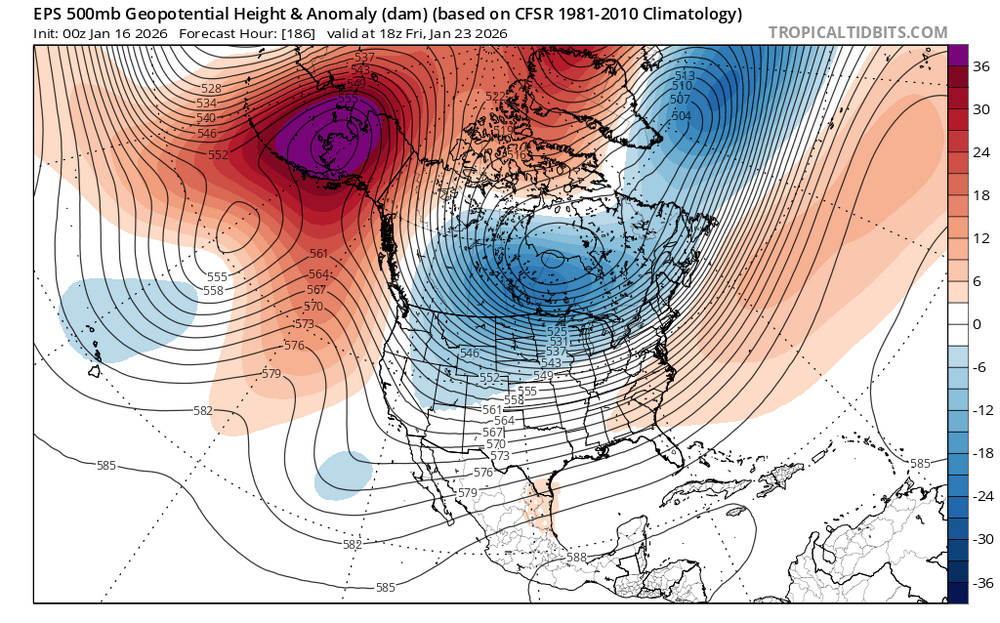
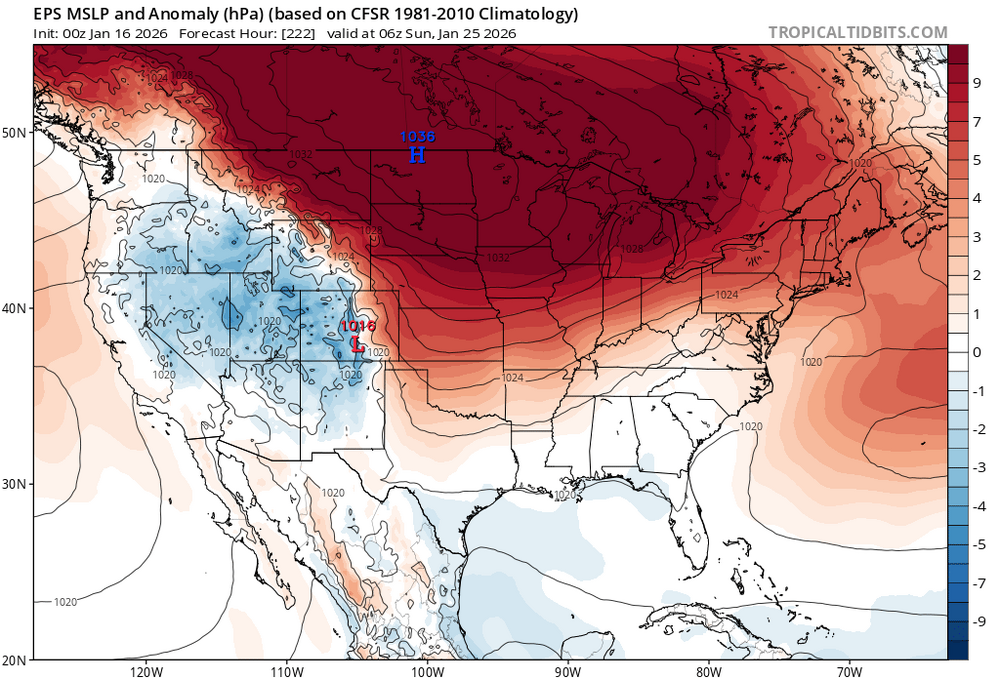
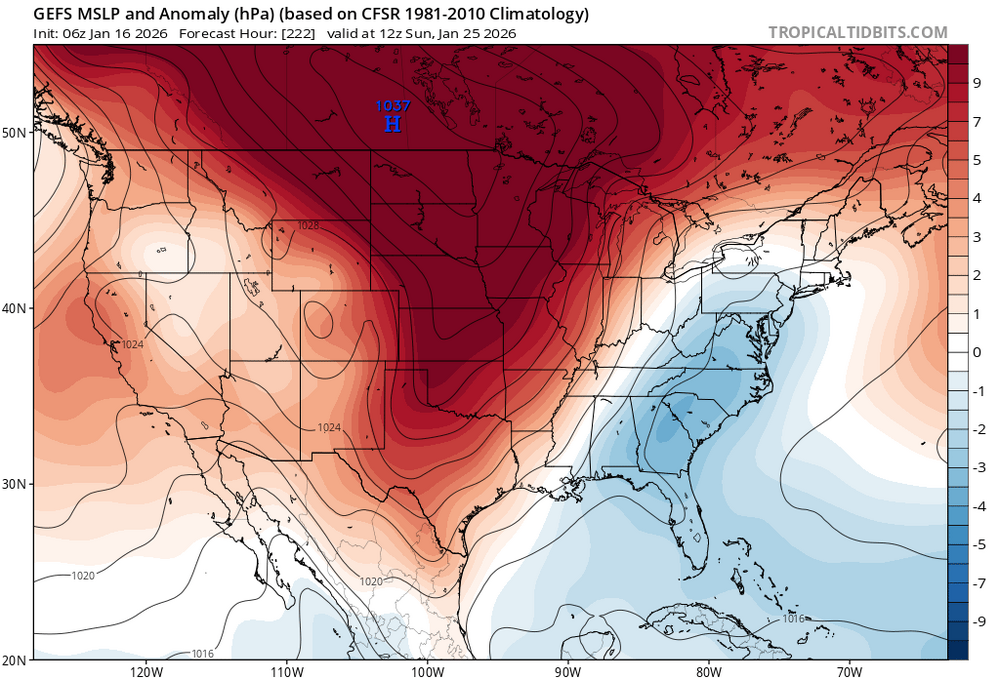
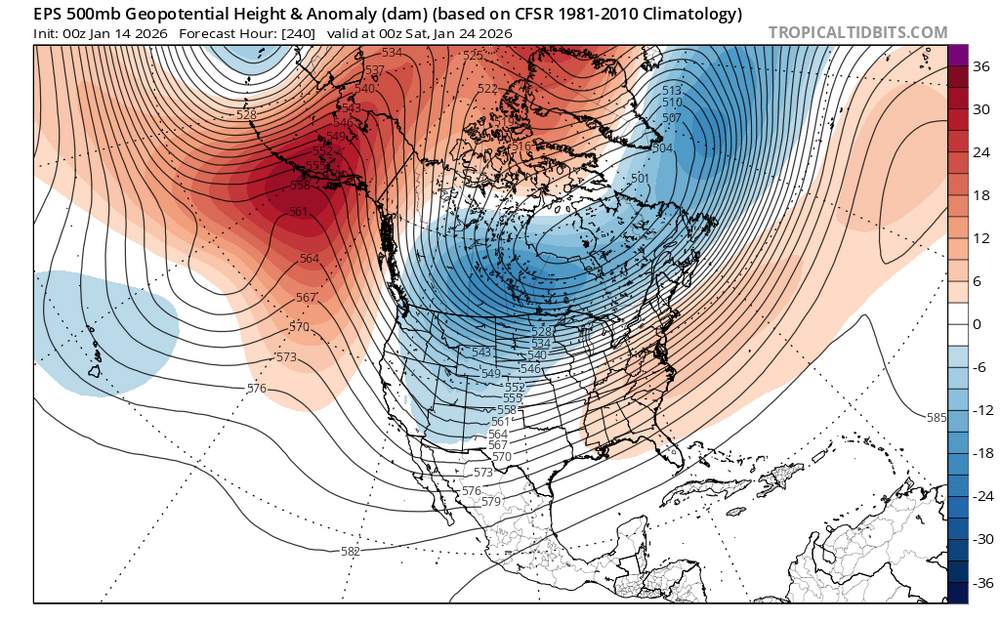
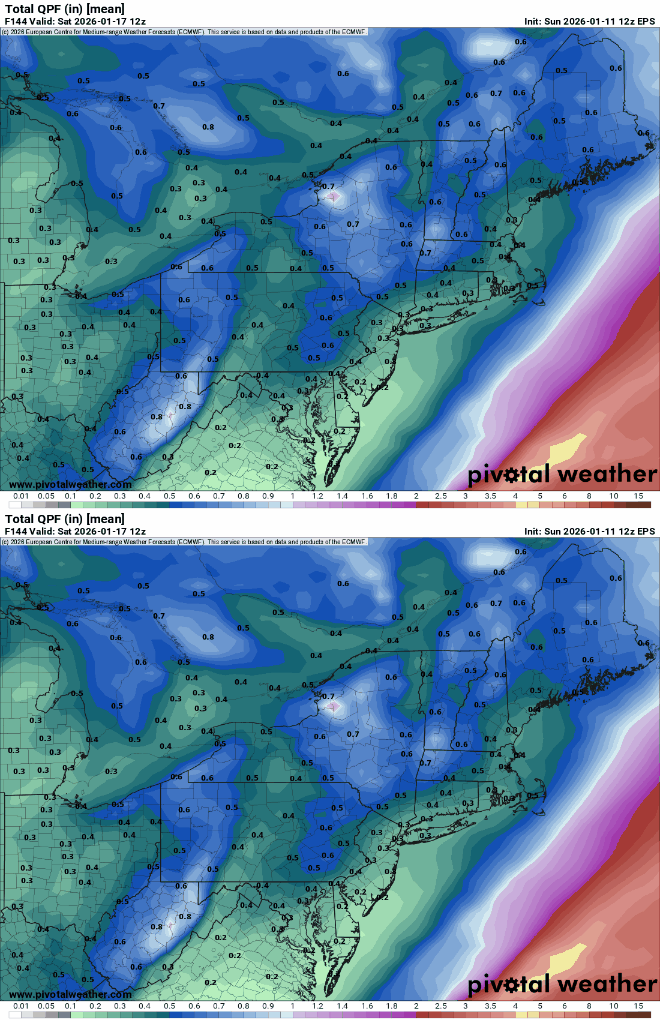
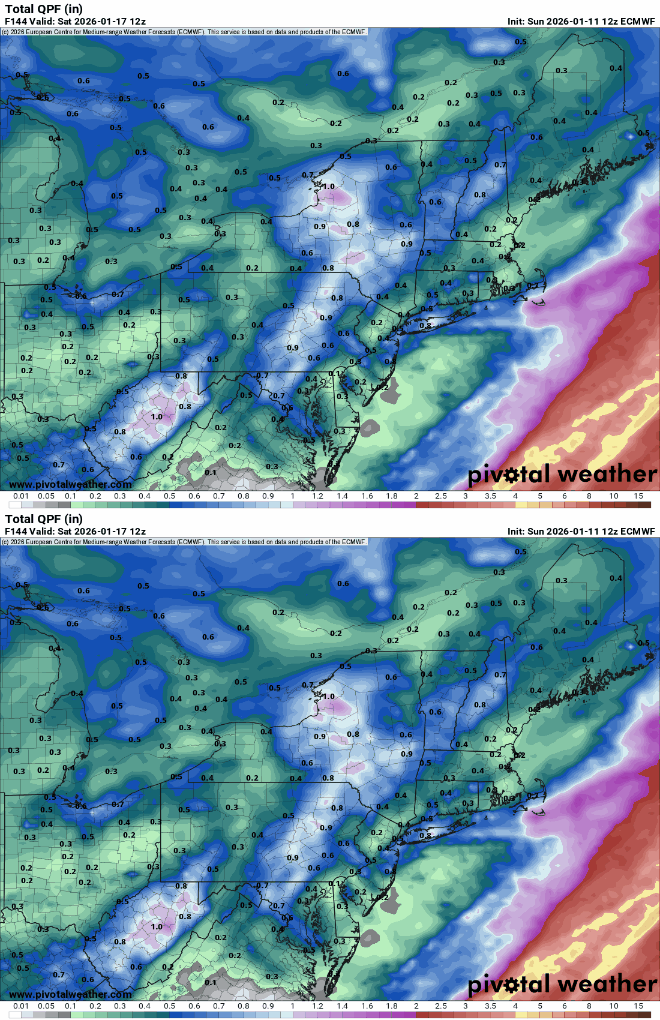
I think the key next week will be how deep a trough we can get out West. All winter long the models have been too aggressive in digging those troughs beyond 168 hrs. We actually need the Southeast ridge to put up some resistance so the overrunning doesn’t get suppressed. The EPS doesn’t dig as much energy into the west so it’s less amped up with the overrunning in the East. It’s been a while since once of these overrunning set ups produced more than 4” from EWR to ISP. But we saw how back in December we finally got two clippers to work out for 4”+. Maybe it’s possible we can finally get a decent overrunning event here. But it’s still way too early to know for sure exactly where the nest overrunning zone sets up. We really want to get to within the 120hr mark for the details to come into clearer focus. At least the potential is there. Whether the potential gets realized is another story. EPS diggs less energy west so overrunning is further south than GEFS
-
It’s interesting how sensitive the winter atmospheric ENSO state is to what occurs in the fall. In 2018-2019 and 2019-2020 we had the strong fall La Nina back background state prevent the El Nino atmospheric state from coupling during the winters. So we got two very La Nina-like winters. Plus the WPAC warm pool is boosting the RONI beyond what Nino 3.4 SSTs might suggest. Another very interesting case study was the fall into winter 2012-2013 atmospheric patterns. We had a weak El Nino develop around Labor Day only to fade several weeks later. But the 500 mb atmospheric response and jet stream patterns from October on were more El Niño-like. Then the very warm El-Nino-like December into mid-January. This was followed by the Southern Stream phasing in with the Northern Stream for the historic Nemo in February which followed the El Niño backloaded scenario. Those were the days before the WPAC warm pool became so dominant. So weak El Niño atmospheric states had no trouble coupling. I agree with you that a change in winter Nino 3.4s usually don’t shift the atmospheric state until we get into the spring and summer due to the atmospheric lag. Plus we saw how Niña-like influences persisted into the 2023-2024 very strong El Niño leading to the stronger Southeast Ridge and weaker STJ and lack of a Nino trough in the East leading to the record warmth. So we will have to monitor this developing El Niño for the hybrid Niña traits that occurred with our last El Niño. It would be nice to just get a clean El Niño translation. But even the seasonal models are lingering the warm pool near Japan as the Nino regions warm. So the next few years will be a test case if we can try and weaken that warm pool.
-
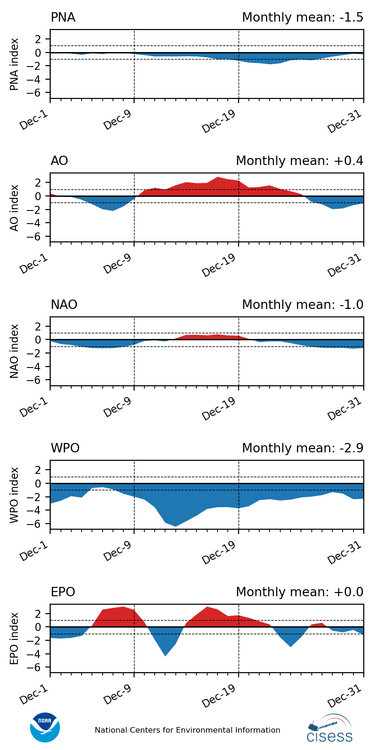
The Euro and EPS have done a better job with the Northern Stream this winter than the other guidance. All the Northern Stream kickers have prevented the Southern Stream disturbances from developing into KU heavy benchmark coastal snowstorm tracks. December was a unique case where we were able to get a few moderately snowy clippers tracking to our south. But this month so far we lost the record -WPO which combined with the -NAO for those two favorable tracks.
-
The record breaking Northern Stream of the Pacific Jet continues to be a big story.
-
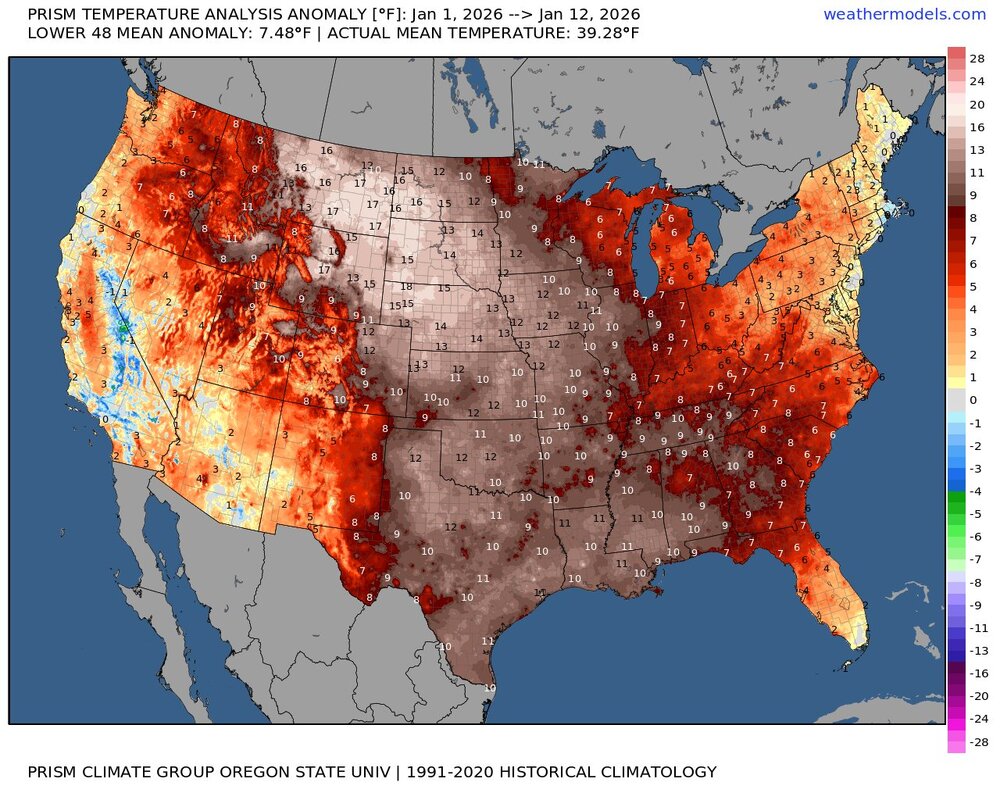
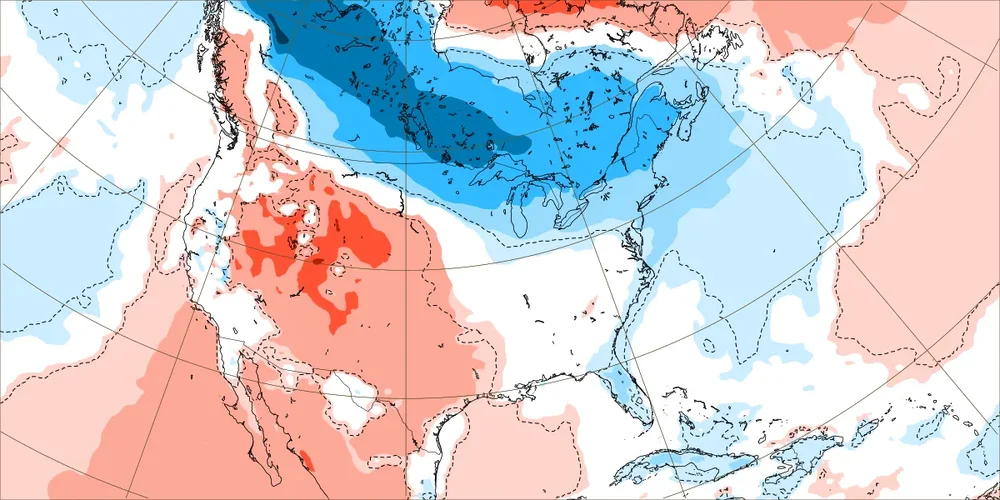
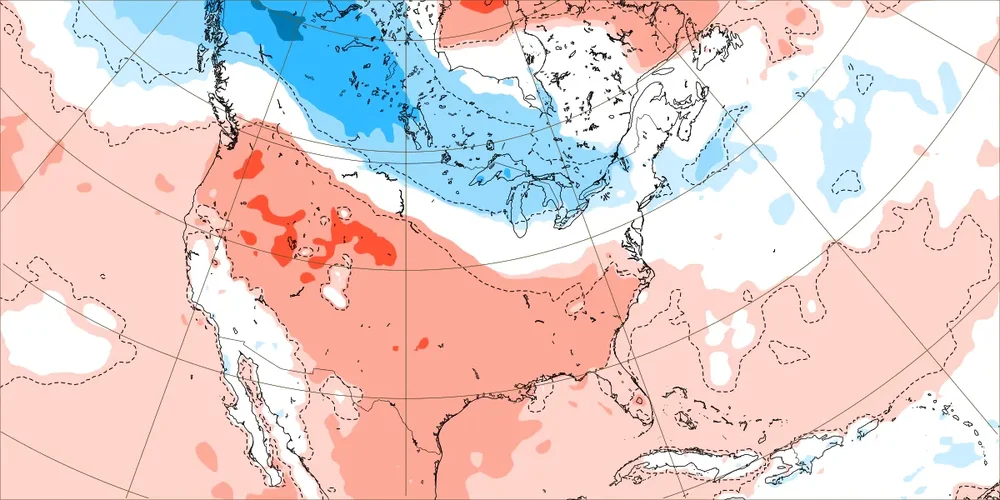
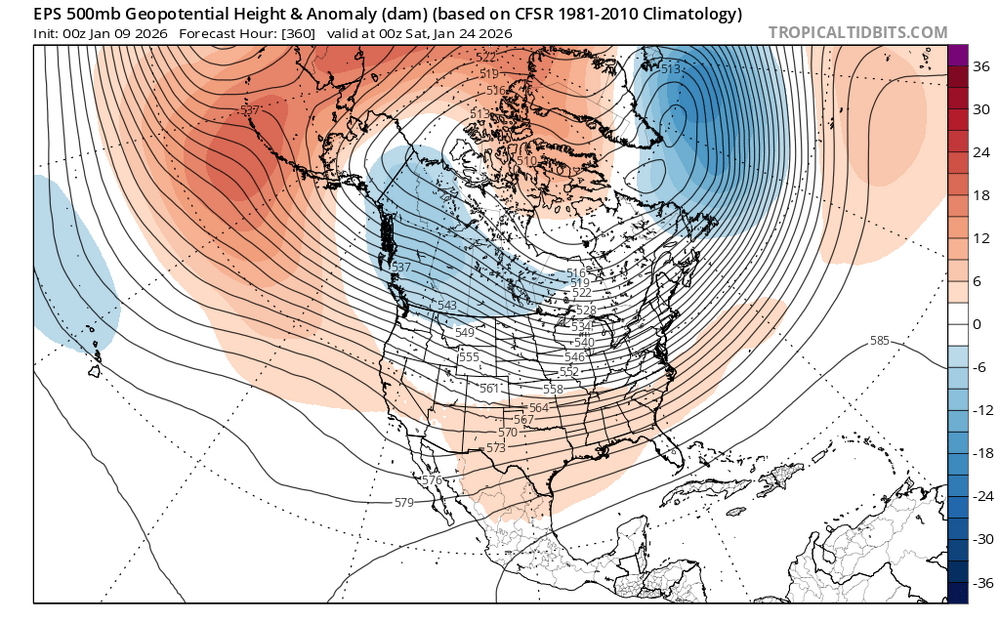
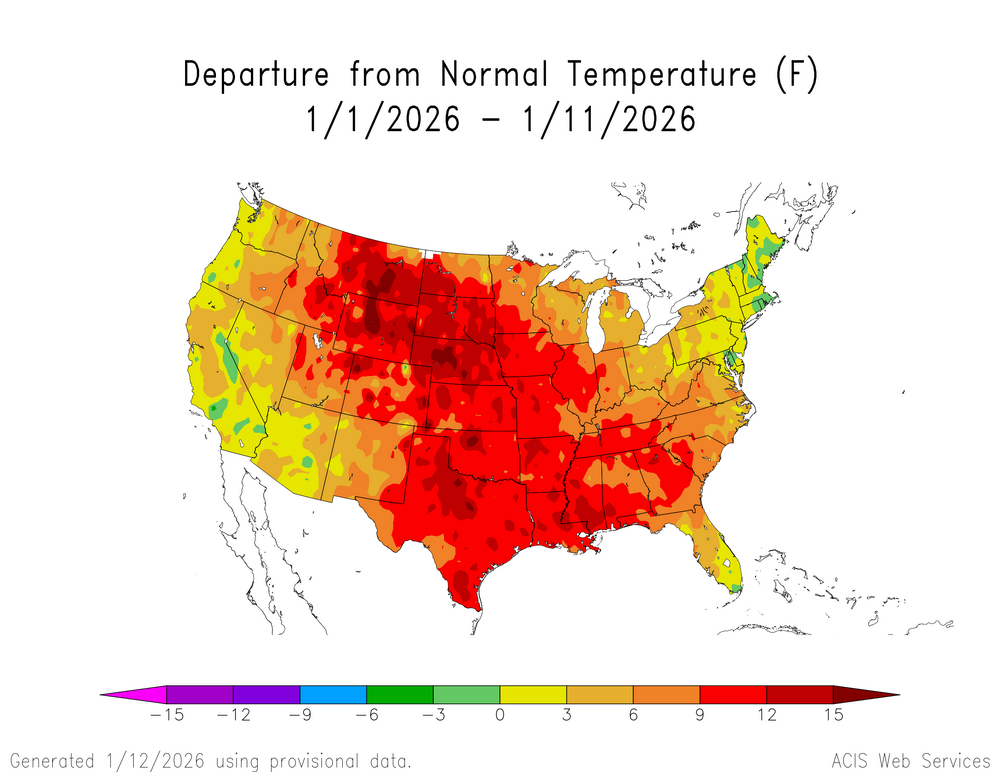
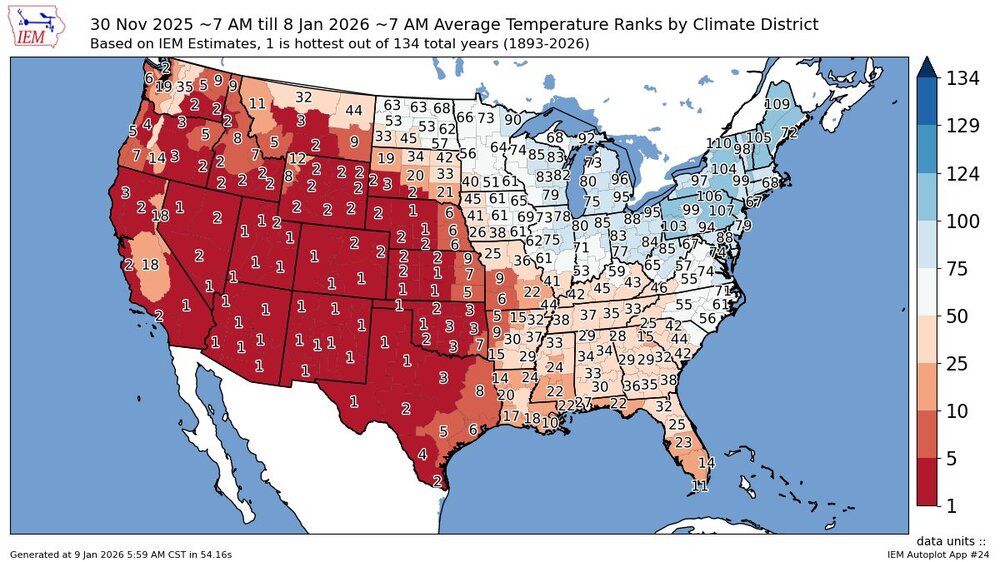
Yeah, numerous spots out West and in the Plains are over +10 so far. This was a pretty big miss from the model forecasts issued around Christmas. Models have really been underestimating the ridge from the West into the Plains this winter beyond 7 days out. EPS forecasts from 12-25-25 Dec 29 to January 5th Jan 5 to 12
-
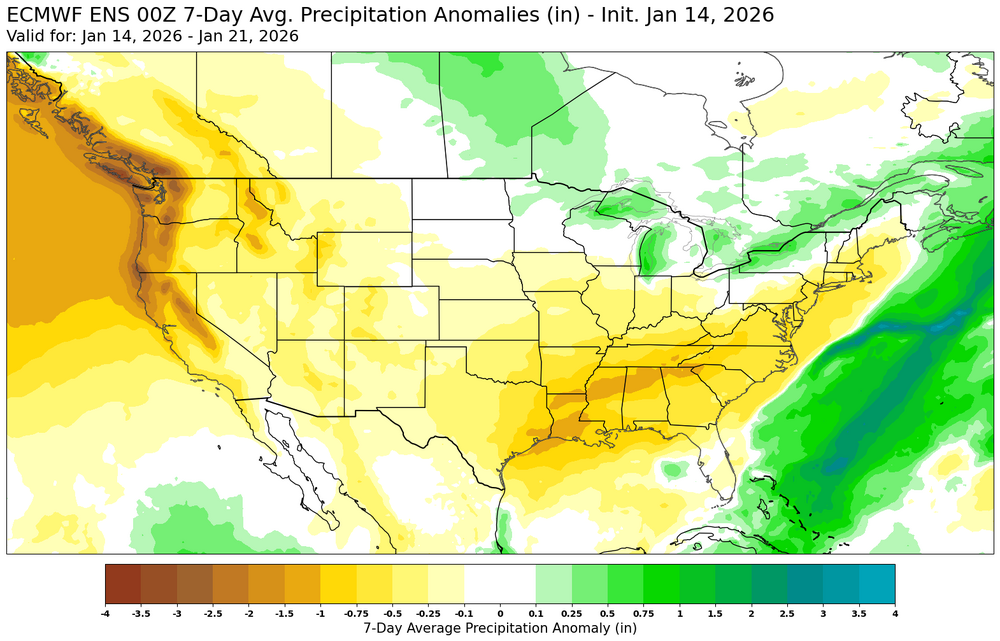
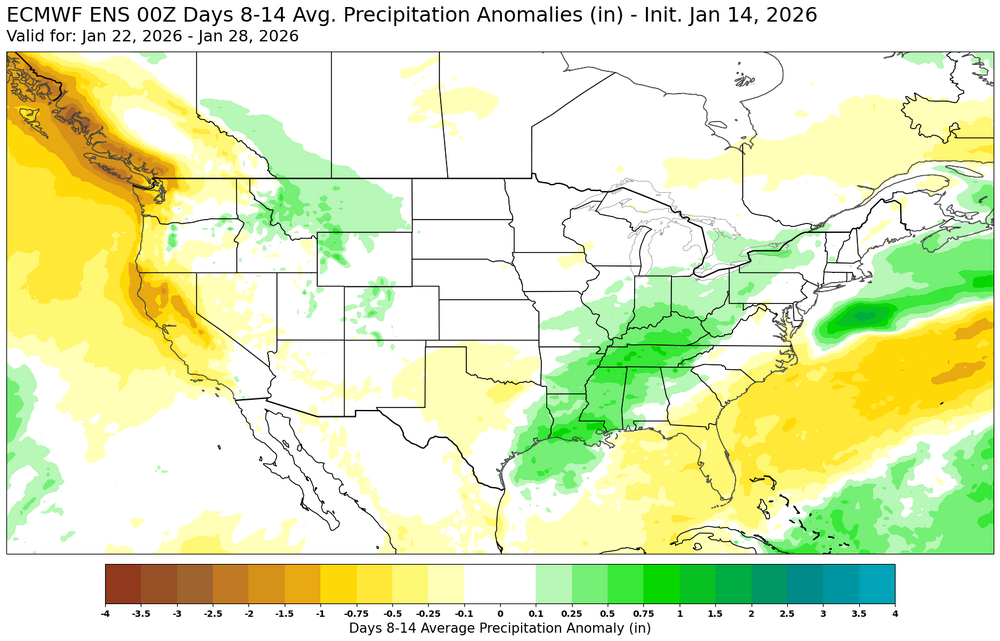
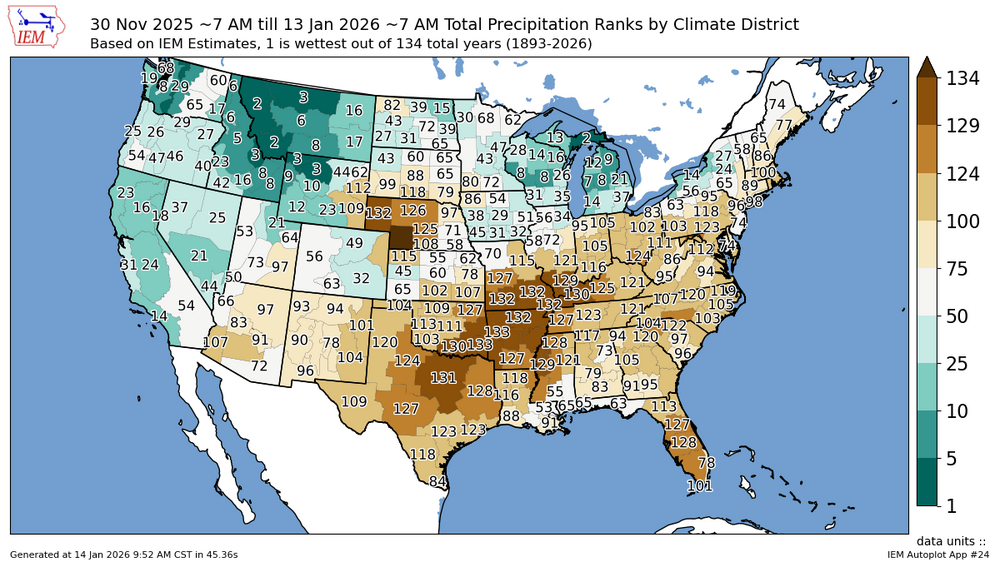
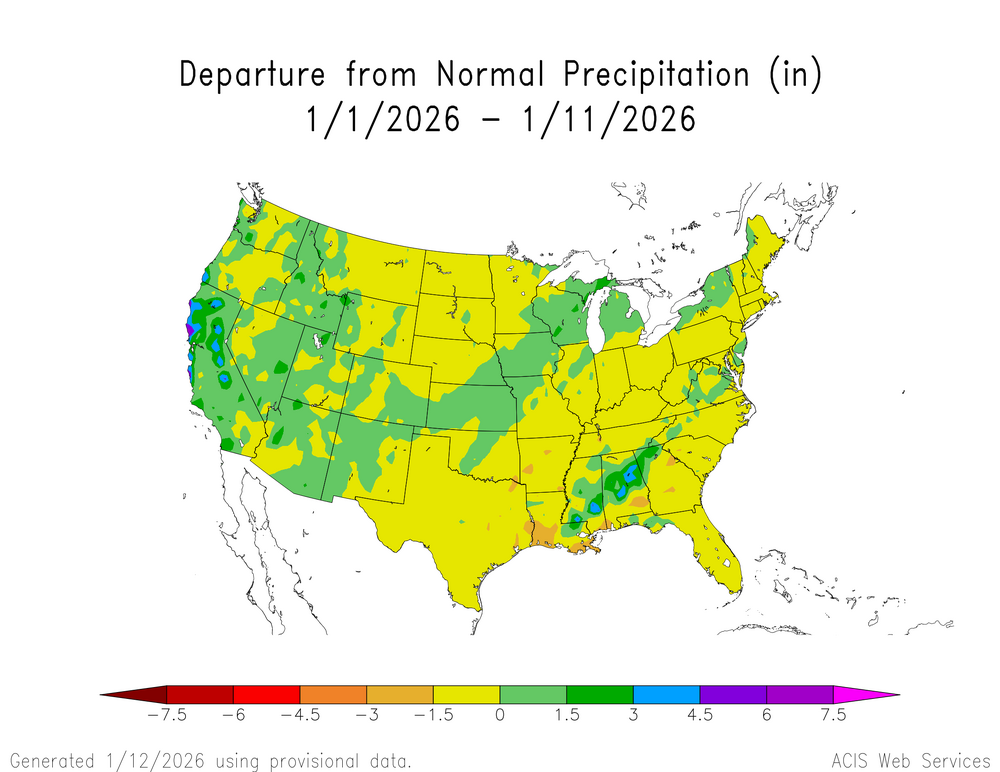
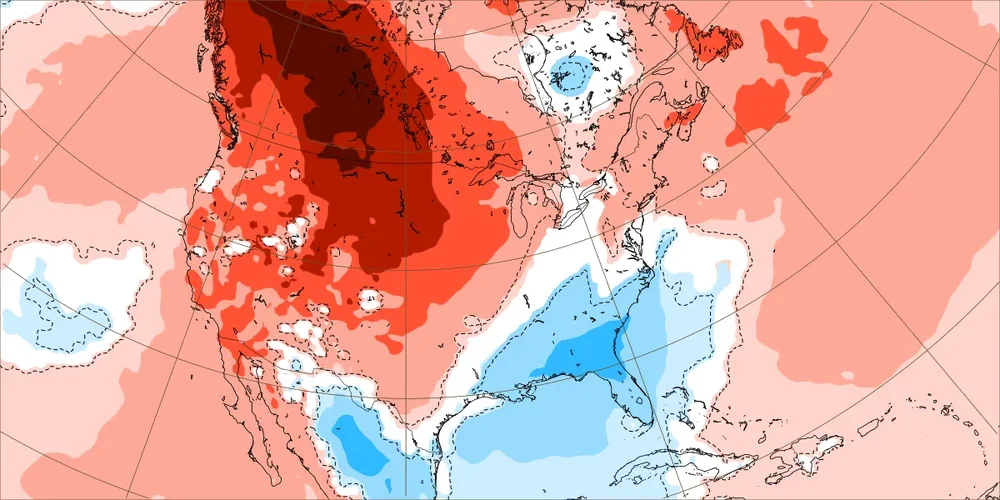
It will be interesting to see if we can finally drop a trough into the West around 10 days out. The record ridge through the first half of the winter is one of the reasons that a large portion of the nation has been so dry. Generally with La Ninas the Western trough is most prominent during February. But who knows this year for sure with how dominant this dry ridge has been. New run Old run Some possible improvement in dry pattern late January?
-
My guess is that we will need at least one KU benchmark snowstorm of 12”+ in a wide enough area before the season is done for most of the major sites of EWR,NYC, LGA,JFK, and ISP to reach 25”+ on the season. But we are still getting no indication of a benchmark coastal snowstorm track in the near term. We haven’t had any seasons reach 25”+ since 1995-1996 without at least one 12”+ snowstorm. Since our snowy patterns since the mid 90s haven’t lasted long enough for a series of small to moderate events to get us to the 25”+ mark. So we needed to maximize our active snowy periods before we shifted out of the snowy intervals. But even if we do eventually get one 12”+ event, it’s not a guarantee that the 5 major sites will all reach 25”. This is what happened back in 2022 with the KU events favoring eastern sections like ISP and not EWR. During this record strong Northern Stream of the Pacific Jet era since 2018-2019, there have only been 4 snowstorms near the 40/70 benchmark with a least one spot in the OKX Zones reaching 12”+. This is why we are at 7 year record low for snowfall across the area. Our last benchmark KU was at the end of January 2022. From 2010 to 2018 there were 27 snowstorms closer to the benchmark with relatively good coverage of 12”+ across multiple sites often with numerous counties involved. The tracks which were west of the benchmark favored interior zones. Tracks near or to the east of the benchmark favored the coastal zones. Widespread 12”+ snowstorms since 2009-2010 with the maximum snowfall total in the OKX Zones. 2022 Jan 28-29….Islip….24.7 2021 Jan 31-Feb 2....Blomingdale, NJ.....26.1 2020 Dec 16-17 East Tremont, NY....12.4 2019 Mar 3-4...Monroe, CT....12.0 2018 Nov 15....Mount Hope, NY.......18.3 Mar 21-22...Patchogue, NY......20.1 Mar 13...Southampton,NY.....18.3 Mar 8....New Farfield, CT..........26.8 Mar 2...Monroe, NY.................14.0 Jan 4...Islip, NY.......................15.8 2017 Mar 14...Montgomery, NY.......23.5 Feb 9...Selden, NY...................16.0 Jan 7...Orient, NY....................12.5 2016 Feb 5...Setauket, NY................12.0 Jan 23..JFK,NY.........................30.5 2015 Feb 2..New Faifield, CT............12.0 Jan 26-27....Orient,NY.............28.5 2014 Feb 13-14...Roselle, NJ............16.7 Jan 21-22....Centerreach,NY....14.0 Jan 2-3......Lindenhurst, NY.....12.5 2013 Mar 8....Harriman,NY..............15.0 Feb 8....Upton, NY..................30.9 2012 Nov 7-8.....Monroe, CT..........13.5 Jan 21......North Haven, CT....12.0 2011 Oct 29.....Harriman, NY.........16.0 Jan 26-27...NYC................... 19.0 Jan 11-12.......Meriden, CT....29.0 2010 Feb 25-26...Mount Hope, NY...27.5 Dec 26........Elizabeth, NJ........31.8 Feb. 10.....Sound Beach, NY....16.2 2009 Dec 19-20....Upton, NY..........26.3
-
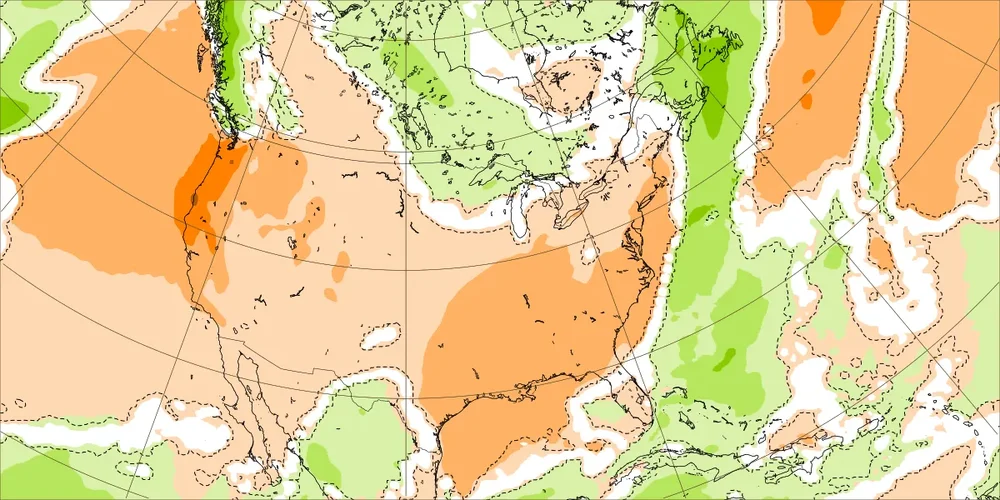
Looks like a continuation of the milder and dry pattern through the next week. EPS January 12 to 19 forecast
-
One evening back in the 1990s I stopped into the old Tower Records in Carle Place up near Roosevelt Field. There was a guy behind a few tables signing some books that he had written. Wasn’t really much of a crowd and it didn’t look like they promoted the event very well. I walked over to the tables and I couldn’t believe that it was Mickey Hart. Only around a dozen people were there and others were shopping in the record section and not taking notice. He was very down to earth and just a casually talking with people who he was signing books for. It’s funny since every time those guys placed the Nassau Coliseum there was a whole community of campers in the parking lot with festivities following them around the country. A friend of mine from my college days spent nearly a year following them around the country. If the book event was promoted better, there probably would have been a line around the block to get in.
-
I got a look at all the EPS members and under 20 show some type of Norlun. But the locations are pretty variable. So the mean is an average of many more members which don’t really show a focused Norlun signal.
-
The OP Euro is trying to show a Norlun trough which seldom works out for our area. The EPS means don’t show it. But it’s always possible a narrowly focused Norlun develops somewhere between ACY and Boston with the UL. It would probably be a nowcasters special for the short term higher res models since they are never well forecast much in advance.
-
The GFS upgrade back in 2019 caused it to incorrectly forecast KU snowstorms at times when there was no other model support. This problem still hasn’t been addressed since it may just be an inherent model bias. We are coming up on the 1st anniversary of its 964mb benchmark blizzard that never occurred last January 12th which the Euro forecast correctly showed was a GFS model error. https://www.wired.com/story/the-governments-new-weather-model-faces-a-storm-of-protest/ For the past few weeks, the National Weather Service has been forecasting snowfall that ends up disappearing, according to Doug Kammerer, chief meteorologist at WRC-TV in Washington, DC. “It’s just not performing well,” Kammerer says. “It has continued to show us getting big-time snowstorms in this area, where the European model will not show it.”
-
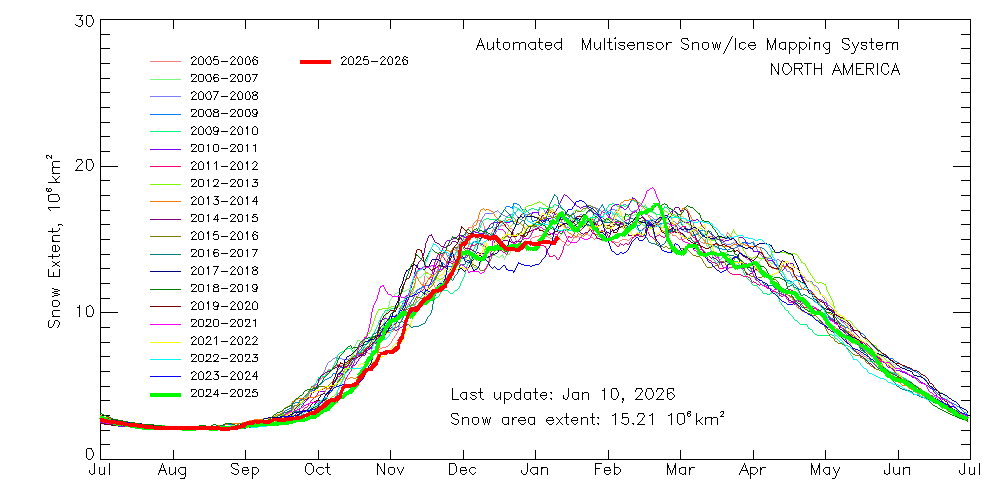
The best snow cover extent relative to the means so far this winter was back in late November and early December prior to the big warm up for much of the CONUS outside the Northeast and Great Lakes.
-
That was the most accurate 168 hr Euro control run of all time. https://www.weather.gov/okx/Blizzard_Jan42018
-
This is why you have to use the ensemble means which never really showed a big snowstorm threat here. What happens in the age of social media is that someone takes a random outlier model run and uses it to justify that there is going to be a big disruptive snowstorm. I like a big snowstorm as much as anyone. So it’s very disappointing to turn on YouTube and see multiple videos with over the top big snowstorm titles when the ensemble means have much less dramatic solutions. Part of this is conditioning from the 2010 to 2018 era when it seems like every time we had a ridge out West and a trough in the East there was a major East Coast KU snowstorm. But that era was defined by a weaker Northern Stream of the Pacific Jet that allowed the Southern Stream to take the lead. So jet stream dynamics have changed since 2018-2019 making it harder to get big snowstorms over 12” for at least some portion of the area.
-
Very difficult to pull off a phase like that with such a dominant Northern Stream pattern and lack of cold high pressure in place.
-
That is probably due to the old weather instruments being in a warmer area with less cold air drainage than where the current FOK ASOS is located.
-
Our area generally doesn’t get big East Coast snowstorms when there is a strong kicker coming through the Great Lakes and a weak cold high pressure in between.
-
The 1960s had the best Long Island and surrounding area radiational cooling following the big snowstorms of that era. for January 21, 1961 through January 31, 1961 Click column heading to sort ascending, click again to sort descending. NY SHRUB OAK COOP -25 NY CARMEL COOP -24 NJ CANOE BROOK COOP -21 CT WESTBROOK COOP -21 NY PORT JERVIS COOP -20 CT WATERBURY RADIO WBRY COOP -19 NJ CHARLOTTEBURG RESERVOIR COOP -18 CT STAMFORD 5 N COOP -18 CT MOUNT CARMEL COOP -17 NY SUFFERN COOP -16 CT DANBURY COOP -16 NY BEDFORD HILLS COOP -16 NY STEWART FIELD WBAN -15 NJ WANAQUE RAYMOND DAM COOP -14 CT GROTON COOP -14 CT NORWICH PUBLIC UTILITY PLANT COOP -13 NY PATCHOGUE 2 N COOP -12 CT COLCHESTER 2 W COOP -12 NJ LITTLE FALLS COOP -11 NY MIDDLETOWN 2 NW COOP -10 NY SCARSDALE COOP -10 NY WESTCHESTER CO AP WBAN -10 NJ ELIZABETH COOP -10 CT MIDDLETOWN 4 W COOP -10 NY WEST POINT COOP -7 CT NORWALK GAS PLANT COOP -7 NJ PLAINFIELD COOP -7 CT NEW HAVEN TWEED AP WBAN -7 NY HEMPSTEAD GARDEN CITY COOP -2 NY SETAUKET STRONG COOP -2 NY RIVERHEAD RESEARCH FARM COOP -2 NY BRIDGEHAMPTON COOP -2 CT IGOR I SIKORSKY MEMORIAL AIRPORT WBAN -1 NJ PATERSON COOP -1 NY WESTHAMPTON GABRESKI AP WBAN -1 Monthly Snowfall Data for January 1961 for Upton NY NWS CWA Click column heading to sort ascending, click again to sort descending. NY WARWICK COOP 45.2 NY GARDNERVILLE COOP 44.0 NJ GREENWOOD LAKE COOP 37.6 NY PORT JERVIS COOP 37.2 NY WEST POINT COOP 35.9 CT WOLCOTT RESERVOIR COOP 33.5 NY DOBBS FERRY-ARDSLEY COOP 32.7 NJ PATERSON COOP 32.5 NJ MAHWAH COOP 32.0 NY WESTCHESTER CO AP WBAN 31.1 NJ MIDLAND PARK COOP 31.0 NJ CHARLOTTEBURG RESERVOIR COOP 31.0 NY SCARSDALE COOP 30.9 NY CARMEL COOP 30.0 NJ CANOE BROOK COOP 29.0 NY STEWART FIELD WBAN 28.0 NY BEDFORD HILLS COOP 27.7 NJ RINGWOOD COOP 27.5 NY SHRUB OAK COOP 27.5 NY BRIDGEHAMPTON COOP 27.4 CT STAMFORD 5 N COOP 27.0 CT MIDDLETOWN 4 W COOP 26.2 CT COCKAPONSET RANGER STA COOP 25.0 NJ WANAQUE RAYMOND DAM COOP 24.0 NJ LITTLE FALLS COOP 22.8 CT WATERBURY RADIO WBRY COOP 22.5 NJ NEWARK LIBERTY INTL AP WBAN 22.2 NY PATCHOGUE 2 N COOP 21.6 NY NY WESTERLEIGH STAT IS COOP 21.5 NY WESTHAMPTON GABRESKI AP WBAN 21.5 NJ CEDAR GROVE COOP 21.0 NY SUFFERN COOP 20.6 NJ PLAINFIELD COOP 20.5 NJ IRVINGTON COOP 20.5 NY HEMPSTEAD GARDEN CITY COOP 20.5 CT COLCHESTER 2 W COOP 20.2 NY NEW YORK LAUREL HILL COOP 20.0 NY MINEOLA COOP 20.0 CT DANBURY COOP 20.0 CT NEW HAVEN TWEED AP WBAN 20.0 CT GROTON COOP 20.0 Data for February 7, 1967 through February 14, 1967 Click column heading to sort ascending, click again to sort descending. NY STEWART FIELD WBAN -20 NY SHRUB OAK COOP -16 NY MIDDLETOWN 2 NW COOP -16 CT COLCHESTER 2 W COOP -15 CT WESTBROOK COOP -15 NY ISLIP-LI MACARTHUR AP WBAN -14 NY CARMEL COOP -12 CT MOUNT CARMEL COOP -12 CT STAMFORD 5 N COOP -11 CT DANBURY COOP -10 CT MIDDLETOWN 4 W COOP -10 NJ CHARLOTTEBURG RESERVOIR COOP -10 NY PORT JERVIS COOP -10 CT GROTON COOP -9 CT NORWICH PUBLIC UTILITY PLANT COOP -9 NJ CANOE BROOK COOP -9 NY SUFFERN COOP -8 CT NORWALK GAS PLANT COOP -7 NY SCARSDALE COOP -6 NY WESTCHESTER CO AP WBAN -6 NY YORKTOWN HEIGHTS 1W COOP -5 NY WESTHAMPTON GABRESKI AP WBAN -5 NY BEDFORD HILLS COOP -4 NJ WANAQUE RAYMOND DAM COOP -4 NY WEST POINT COOP -4 NY PATCHOGUE 2 N COOP -4 CT NEW HAVEN TWEED AP WBAN -3 CT IGOR I SIKORSKY MEMORIAL AIRPORT WBAN -2 NJ PLAINFIELD COOP -2 NJ LITTLE FALLS COOP -2 NY HEMPSTEAD GARDEN CITY COOP -1 Monthly Snowfall Data for February 1967 for Upton NY NWS CWA Click column heading to sort ascending, click again to sort descending. CT WOLCOTT RESERVOIR COOP 34.2 CT COLCHESTER 2 W COOP 33.2 CT EASTON RESERVOIR COOP 32.5 CT COCKAPONSET RANGER STA COOP 32.3 NY STEWART FIELD WBAN 32.1 NY WARWICK COOP 32.1 CT DANBURY COOP 31.6 NY BRIDGEHAMPTON COOP 30.5 NY SCARSDALE COOP 30.5 NY WESTCHESTER CO AP WBAN 29.6 NY NY WESTERLEIGH STAT IS COOP 29.5 CT TRAP FALLS RESERVOIR COOP 29.5 NJ PLAINFIELD COOP 29.1 NJ CHARLOTTEBURG RESERVOIR COOP 28.6 NY BEDFORD HILLS COOP 28.5 NY DOBBS FERRY-ARDSLEY COOP 28.1 NY MINEOLA COOP 28.0 NY PATCHOGUE 2 N COOP 27.8 NY NEW YORK LAUREL HILL COOP 27.7 CT WESTBROOK COOP 27.6 NJ MIDLAND PARK COOP 27.5 NY WESTHAMPTON GABRESKI AP WBAN 27.3 NJ CANOE BROOK COOP 27.0 NY CARMEL COOP 27.0 NJ PATERSON COOP 26.8 NJ WANAQUE RAYMOND DAM COOP 26.6 NY WEST POINT COOP 26.3 NY YORKTOWN HEIGHTS 1W COOP 26.0 NY SHRUB OAK COOP 25.5 NJ NEWARK LIBERTY INTL AP WBAN 25.4 CT NEW HAVEN TWEED AP WBAN 25.3 CT MIDDLETOWN 4 W COOP 25.3 CT STAMFORD 5 N COOP 25.3 NY GARDNERVILLE COOP 25.0 CT MOUNT CARMEL COOP 24.6 NY RIVERHEAD RESEARCH FARM COOP 24.3 CT NORWALK GAS PLANT COOP 24.3 NY NEW YORK AVE V BROOKLYN COOP 24.0 CT IGOR I SIKORSKY MEMORIAL AIRPORT WBAN 24.0 NY HEMPSTEAD GARDEN CITY COOP 23.8 NY PORT JERVIS COOP 23.7 NY NY CITY CENTRAL PARK WBAN 23.6 NJ GREENWOOD LAKE COOP 20.5 NY LAGUARDIA AIRPORT WBAN 20.0
-
Same to you.
-
At least Eurasia is trying to bounce off their record low snowcover extent as North America approaches record lows for mid-January with this current warm up.
-
Yeah, EPS has a transition back to colder again following this warmer pattern.
-
Yeah, the average temperatures at the major reporting stations from EWR to ISP so far this winter are in the 33° to 34° range. We finished December at -4.6° for the 7 station average. Sometimes based on the earlier climate periods we can get similar temperatures at the stations but there can be more departure variability. This is why I focus more on rankings and actual temperatures since departures are based on a rising mean each new 10 year update. Time Series Summary for NEWARK LIBERTY INTL AP, NJ Click column heading to sort ascending, click again to sort descending. 2026-01-08 33.4 0 2025-01-08 36.9 0 2024-01-08 43.0 0 2023-01-08 40.4 0 2022-01-08 42.5 0 2021-01-08 37.9 0 2020-01-08 38.1 0 2019-01-08 39.4 0 2018-01-08 31.0 0 Time Series Summary for NY CITY CENTRAL PARK, NY Click column heading to sort ascending, click again to sort descending. 2026-01-08 33.9 0 2025-01-08 37.0 0 2024-01-08 43.0 0 2023-01-08 40.4 0 2022-01-08 42.2 0 2021-01-08 38.8 0 2020-01-08 38.7 0 2019-01-08 40.1 0 2018-01-08 31.4 0 Time Series Summary for LAGUARDIA AIRPORT, NY Click column heading to sort ascending, click again to sort descending. 2026-01-08 34.3 0 2025-01-08 37.9 0 2024-01-08 42.9 0 2023-01-08 40.4 0 2022-01-08 43.5 0 2021-01-08 40.6 0 2020-01-08 39.2 0 2019-01-08 40.6 0 2018-01-08 32.5 0 Time Series Summary for JFK INTERNATIONAL AIRPORT, NY Click column heading to sort ascending, click again to sort descending. 2026-01-08 33.4 0 2025-01-08 38.2 0 2024-01-08 41.4 0 2023-01-08 39.2 0 2022-01-08 41.8 0 2021-01-08 38.3 0 2020-01-08 38.6 0 2019-01-08 39.9 0 2018-01-08 31.3 0
-
Colder start to winter than recent years but not as cold as 17-18 was through January 8th. Time Series Summary for ISLIP-LI MACARTHUR AP, NY December 1st through January 8th Click column heading to sort ascending, click again to sort descending. 2026-01-08 34.1 0 2025-01-08 35.8 0 2024-01-08 40.7 0 2023-01-08 38.6 0 2022-01-08 40.3 0 2021-01-08 36.9 0 2020-01-08 37.3 0 2019-01-08 38.2 0 2018-01-08 30.3 0
-
Significant increase in high tide or sunny day flooding across the areas in Florida which have experienced the greatest sea level rise. https://southeastfloridaclimatecompact.org/initiative/climate-indicators-high-tide-flooding/


