donsutherland1
-
Posts
23,748 -
Joined
Content Type
Profiles
Blogs
Forums
American Weather
Media Demo
Store
Gallery
Everything posted by donsutherland1
-
I don’t have the calculation, but there are some papers that suggest that it is more accurate than the mean, because it addresses ensemble member bias.
-
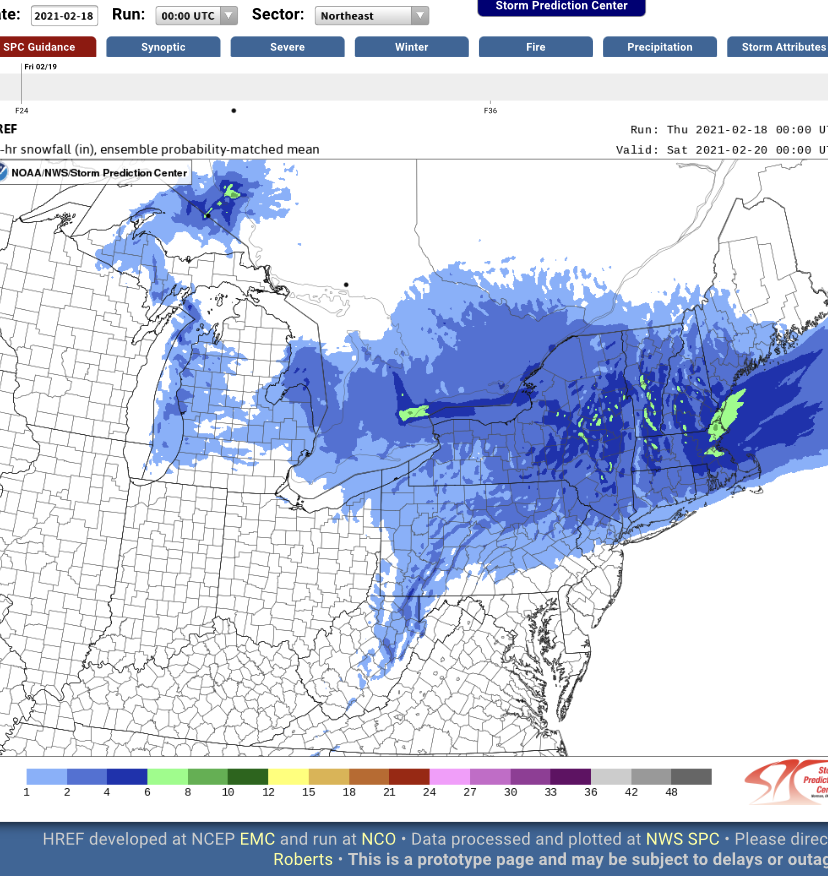
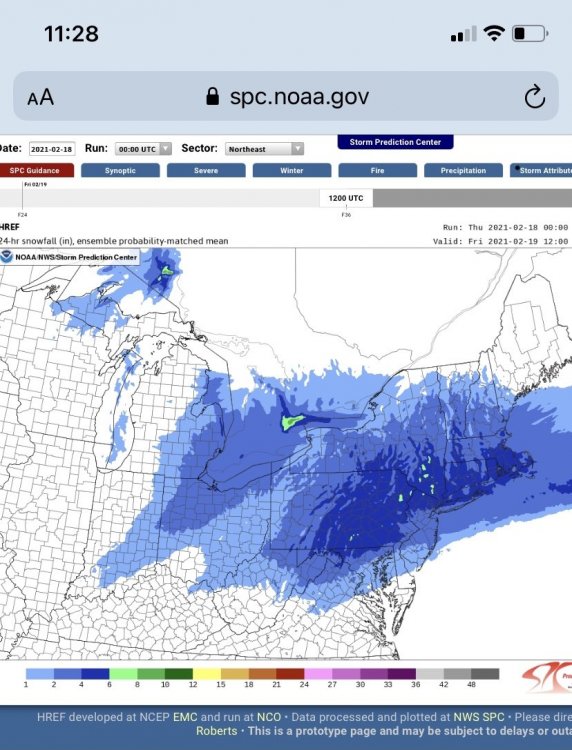
Morning thoughts... A complex system in which a primary storm will transfer energy to a slowly-developing offshore system will bring a general 4”-8” snowfall across much of the region through tomorrow. Already, parts of Pennsylvania have experienced heavy snow. Valley Forge has picked up 3.3” with 2.0” falling within the span of an hour. Wayne has seen 5.0” with 3.0” reported in under 2 hours. Snow will overspread the New York City area and north and west of the City early this morning. A period of sleet and freezing rain or even plain rain is likely at some point today, especially along Long Island’s South Shore and the Jersey Shore. Temperatures will likely top out in the lower 30s in most of the region. Likely high temperatures around the region include: New York City (Central Park): 32° Newark: 32° Philadelphia: 31° Additional light snow with perhaps a period of moderate snow is likely tomorrow. Through February 17, New York City has received 21.2” snow this month, which ranks as the 14th snowiest February on record. At Newark, 24.1” has fallen, which ranks 9th highest. With 4” snow, February 2021 will rank as New York City’s 7th snowiest February and Newark’s 5th snowiest February. With 6” snow, February 2021 would rank as both cities’ 4th snowiest February on record. In the long-range, there is consensus among the ensembles that a sustained milder pattern will develop around or just after February 20.
-
The probability matched mean is even better:

-
Feb 18-19 long duration manageable snow and ice event
donsutherland1 replied to wdrag's topic in New York City Metro
-
Feb 18-19 long duration manageable snow and ice event
donsutherland1 replied to wdrag's topic in New York City Metro
The upcoming complex system will provide a good test for the GFSv16. Over the last 5 cycles (2/17 0z through 2/18 0z), the GFSv16 has had much better run-to-run continuity than the GFS. The standard deviation for three select cities follows: ABE: GFS: 0.87”; GFSv16: 0.67” NYC: GFS: 1.46”; GFSv16: 0.54” PHL: GFS: 1.60”; GFSv16: 0.68” Snowfall Amounts: ABE: 2/17 0z: GFS: 7.1”; GFSv16: 6.3” and 2/18 0z: GFS: 6.3”; GFSv16: 5.2” NYC: 2/17 0z: GFS: 7.6”; GFSv16: 4.8” and 2/18 0z: GFS: 4.4”; GFSv16: 5.5” PHL: 2/17 0z: GFS: 7.1”; GFSv16: 7.4” and 2/18 0z: GFS: 4.9”; GFSv16: 7.3” -
I will do so in all future references. Allentown: 47.7” (24.8” above normal)
-
Feb 18-19 long duration manageable snow and ice event
donsutherland1 replied to wdrag's topic in New York City Metro
That’s amazing. Many move to different forecast offices from time to time. Mount Holly is fortunate to have a meteorologist who has devoted a substantial part of his career to the region. -
Feb 18-19 long duration manageable snow and ice event
donsutherland1 replied to wdrag's topic in New York City Metro
Thanks. I recall you were at Mount Holly, at least you were in the past. -
Feb 18-19 long duration manageable snow and ice event
donsutherland1 replied to wdrag's topic in New York City Metro
Welcome back. Are you still with the NWS? -
February has been a snowy month in parts of the Middle Atlantic region. New York City and Newark have seen especially high amounts of snow. Seasonal snowfall amounts through 4 pm February 17 include: Albany: 50.2" (7.8" above normal) Baltimore: 9.2" (6.4" below normal) Binghamton: 84.5" (27.4" above normal) ***29th highest*** Boston: 32.7" (2.9" above normal) Bridgeport: 38.9" (20.5" above normal) Buffalo: 65.4" (7.0" below normal) Burlington: 54.9" (0.3" above normal) Caribou: 73.1" (0.9" below normal) Harrisburg: 28.2" (7.0" above normal) Islip: 27.8" (11.0" above normal) New York City: 33.8" (16.0" above normal) Newark: 39.2" (19.7" above normal) Philadelphia: 19.7" (3.6" above normal) Portland: 38.5" (3.3" below normal) Providence: 26.8" (2.3" above normal) Washington, DC: 4.7" (7.5" below normal) More snowfall is imminent. A storm will likely bring a moderate to locally significant snowfall to parts of the Northeast tomorrow through Friday. A general 4"-8" snowfall with locally higher amounts is likely across much of the region, including New York City, Newark, and Philadelphia. In response to the Arctic Oscillation's having gone positive, a pattern change will likely occur starting on or just after February 20. Following the shift in the prevailing pattern, a period of warmer than normal temperatures is likely in the Middle Atlantic and southern New England areas. A dramatic increase in the Arctic Oscillation, as has just occurred with the AO rising just over 6 sigma during the February 11-17 period, has sometimes coincided with storminess. Therefore, the February 14-24 period might offer a window of opportunity for a meaningful storm. Since 1950, there were 11 cases during the January 16-February 28 timeframe that saw the AO rise at least 3 sigma from a minimum value of -4.000 or below within a 7-day period. Four cases saw a major snowstorm in parts of the Middle Atlantic or New England regions within 3 weeks of the AO's reaching its minimum value. The dates of the AO's minimum value for those four cases with storm dates in parentheses are January 25, 1958 (February 14-17, 1958 NESIS: 6.25), January 19, 1969 (February 8-10, 1969 NESIS: 3.51), February 15, 1969 (February 22-28, 1969 NESIS: 4.29), and January 16, 2016 (January 22-24, 2016 NESIS: 7.66). The ENSO Region 1+2 anomaly was -0.5°C and the Region 3.4 anomaly was -1.2°C for the week centered around February 10. For the past six weeks, the ENSO Region 1+2 anomaly has averaged -0.50°C and the ENSO Region 3.4 anomaly has averaged -1.00°C. La Niña conditions will likely prevail at least through mid-March. The SOI was +28.77 today. The preliminary Arctic Oscillation (AO) figure was +0.703 today On February 16 the MJO was in Phase 7 at an amplitude of 2.375 (RMM). The February 15-adjusted amplitude was 2.675. Based on the latest guidance, no significant stratospheric warming event is likely into the closing days of February. The significant December 16-17 snowstorm during what has been a blocky December suggests that seasonal snowfall prospects have increased especially from north of Philadelphia into southern New England. At New York City, there is a high probability based on historic cases that an additional 20" or more snow will accumulate after December. Since January 1, New York City has picked up 23.3" snow. Winters that saw December receive 10" or more snow, less than 10" in January, and then 10" or more in February in New York City, saw measurable snowfall in March or April in 83% of cases. Winter 2009-2010 was the exception where only a trace of snow was recorded. This group of winters saw 6" or more snow during the March-April period in 50% of the cases. All said, it is more likely than not that there will be measurable snowfall after February. Based on sensitivity analysis applied to the latest guidance, there is an implied 90% probability that New York City will have a colder than normal February. February will likely finish with a mean temperature near 32.9° (2.4° below normal).
-
Winter 2020-21 has witnessed persistent and deep blocking with at least one bout of extreme blocking (-4.000 or below). The end result has been above average snowfall in New York City. To date, the December-February has averaged -2.215, 85% of days have seen the AO at or below -1.000, and the AO reached a minimum value of -5.314. That fits the cluster of winters with AO conditions that are conducive to above average snowfall. For purposes of illustration, I ran the data for winters 1950-51 through 2019-20 for snowfall at New York City's Central Park. Daily AO data was first reported on January 1, 1950. To assure consistency with all winter cases, I used the December 1-February 28 timeframe. There were three broad clusters: Cluster 1: Deep and persistent blocking with one or more extreme blocking episodes: AO average: -0.500 or below Days with the AO at or below -1.000: 50% or more Lowest AO value: -4.000 or below Cases (winters): 14 (20% of winters) Average seasonal snowfall: 37.1" Least seasonal snowfall: 16.3", 1962-63 Most seasonal snowfall: 75.6", 1995-96 Distribution: < 10" seasonal snowfall: 0% cases < 20" seasonal snowfall: 7% cases 20" or more seasonal snowfall: 93% cases 30" or more seasonal snowfall: 57% cases 40" or more seasonal snowfall: 29% cases 50" or more seasonal snowfall: 29% cases Cluster 2: Lack of deep and persistent blocking with no extreme blocking episodes: AO average: +0.500 or above Days with the AO at or below -1.000: Less than 50% days Lowest AO value: Above -4.000 Cases (winters): 12 (17% of winters) Average seasonal snowfall: 17.9" Least seasonal snowfall: 2.8", 1972-73 Most seasonal snowfall: 50.3", 2014-15 Distribution: < 10" seasonal snowfall: 17% cases < 20" seasonal snowfall: 75% cases 20" or more seasonal snowfall: 25% cases 30" or more seasonal snowfall: 8% cases 40" or more seasonal snowfall: 8% cases 50" or more seasonal snowfall: 8% cases Cluster 3: All other winters Cases (winters): 44 (63% of winters) Average seasonal snowfall: 25.1" Least seasonal snowfall: 3.5", 2001-02 Most seasonal snowfall: 57.4", 2013-14 Distribution: < 10" seasonal snowfall: 9% cases < 20" seasonal snowfall: 45% cases 20" or more seasonal snowfall: 55% cases 30" or more seasonal snowfall: 30% cases 40" or more seasonal snowfall: 25% cases 50" or more seasonal snowfall: 9% cases
-
The December 16-17 snowstorm offered a big clue that this would turn out to be a snowy winter.
-
Morning thoughts... Yesterday’s mild temperatures are now in the past. Today will be sunny but much cooler than yesterday. Temperatures will likely top out in the lower 30s in most of the region. Likely high temperatures around the region include: New York City (Central Park): 33° Newark: 33° Philadelphia: 33° A storm will bring a widespread 4”-8” snowfall to the region, which has already seen above to much above normal snowfall this month. Through February 16, New York City has received 21.2” snow this month, which ranks as the 14th snowiest February on record. At Newark, 24.1” has fallen, which ranks 9th highest. With 4” snow, February 2021 will rank as New York City’s 7th snowiest February and Newark’s 5th snowiest February. With 6” snow, February 2021 would rank as both cities’ 4th snowiest February on record. In the long-range, there is consensus among the ensembles that a sustained milder pattern will develop around or just after February 20.
-
17.1 degrees on January 21, 1985.
-
Clouds parted following the exit of a storm soaked much of the region overnight into the morning and the mercury rose to 50° in many parts of the Middle Atlantic region. Tomorrow will be mostly sunny and noticeably colder than today. Afterward, a storm could bring a moderate to significant snowfall to parts of the Northeast on Thursday into Friday. A widespread 4"-8" snowfall with locally higher amounts is likely, including New York City, Newark, and Philadelphia. In response to the Arctic Oscillation's having gone positive, a pattern change will likely occur starting on or just after February 20. Following the shift in the prevailing pattern, a period of warmer than normal temperatures is likely in the Middle Atlantic and southern New England areas. Today, many areas in the Plains States, including Texas, experienced additional record and near record cold temperatures from what has been the coldest air mass in three decades in many parts of that region. Minimum temperatures through 6 pm EST included: Abilene, TX: -4° (tied record set in 1895) Austin: 7° (old record: 20°, 1903) Baton Rouge: 20° (old record: 23°, 1909) Corpus Christi: 19° (old record: 20°, 1895) Dallas: -2° (old record: 12°, 1903) ***Coldest since January 31, 1949*** Hastings, NE: -30° (old record: -13°, 1979) ***Tied all-time record*** Houston: 13° (tied record set in 1895) Lincoln, NE: -31° (old record: -18°, 1978) ***Coldest since January 12, 1974*** Lubbock, TX: 5° (old record: 13°, 1936 and 1979) North Platte, NE: -20° (old record: -15°, 1881) Oklahoma City: -14° (old record: 4°, 1903) ***Coldest since February 12, 1899*** Omaha: -23° (old record: -17°, 1979) Shreveport: 1° (old record: 20°, 1903) ***Coldest since January 18, 1930) Tulsa: -13° (old record: 3°, 1920) ***Coldest since January 22, 1930*** Tyler, TX: -6° (old record: 16°, 2007) ***Set new all-time record: Previous record: -3°, January 18, 1930; records go back to 1883*** Waco, TX: -1° (old record: 16°, 2007) Wichita: -17° (old record: -6°, 1903) Dallas saw the temperature fall below 10° for a record-tying third consecutive day and below zero for only its fourth time on record. Records for the Dallas-Fort Worth area go back to September 1898. Today, the Arctic Oscillation (AO) attained positive values for the first time since December 25, 2020 when the AO was +0.226. Whether this development will mark the end of the prolonged period of blocking that has prevailed throughout winter 2020-21 or a temporary break, remains to be seen. A dramatic increase in the AO has sometimes coincided with storminess. Therefore, the February 14-24 period might offer a window of opportunity for a meaningful storm. That window of opportunity could extend through the end of February should blocking persist or return. Since 1950, there were 11 cases during the January 16-February 28 timeframe that saw the AO rise at least 3 sigma from a minimum value of -4.000 or below within a 7-day period. Four cases saw a major snowstorm in parts of the Middle Atlantic or New England regions within 3 weeks of the AO's reaching its minimum value. The dates of the AO's minimum value for those four cases with storm dates in parentheses are January 25, 1958 (February 14-17, 1958 NESIS: 6.25), January 19, 1969 (February 8-10, 1969 NESIS: 3.51), February 15, 1969 (February 22-28, 1969 NESIS: 4.29), and January 16, 2016 (January 22-24, 2016 NESIS: 7.66). The ENSO Region 1+2 anomaly was -0.5°C and the Region 3.4 anomaly was -1.2°C for the week centered around February 10. For the past six weeks, the ENSO Region 1+2 anomaly has averaged -0.50°C and the ENSO Region 3.4 anomaly has averaged -1.00°C. La Niña conditions will likely prevail at least through mid-March. The SOI was +16.52 today. The preliminary Arctic Oscillation (AO) figure was +0.568 today On February 15 the MJO was in Phase 7 at an amplitude of 2.673 (RMM). The February 14-adjusted amplitude was 2.880. Based on the latest guidance, no significant stratospheric warming event is likely into the closing days of February. The significant December 16-17 snowstorm during what has been a blocky December suggests that seasonal snowfall prospects have increased especially from north of Philadelphia into southern New England. At New York City, there is a high probability based on historic cases that an additional 20" or more snow will accumulate after December. Since January 1, New York City has picked up 23.3" snow. Winters that saw December receive 10" or more snow, less than 10" in January, and then 10" or more in February in New York City, saw measurable snowfall in March or April in 83% of cases. Winter 2009-2010 was the exception where only a trace of snow was recorded. This group of winters saw 6" or more snow during the March-April period in 50% of the cases. All said, it is more likely than not that there will be measurable snowfall after February. Based on sensitivity analysis applied to the latest guidance, there is an implied 85% probability that New York City will have a colder than normal February. February will likely finish with a mean temperature near 33.0° (2.3° below normal).
-
The highs were: JFK: 49 LGA: 53 NYC: 51
-
Feb 18-19 long duration manageable snow and ice event
donsutherland1 replied to wdrag's topic in New York City Metro
36.9”. -
After 44 consecutive days during which the temperature remained below 50° in Central Park, the temperature reached 50° this afternoon for the first time since January 2.
-
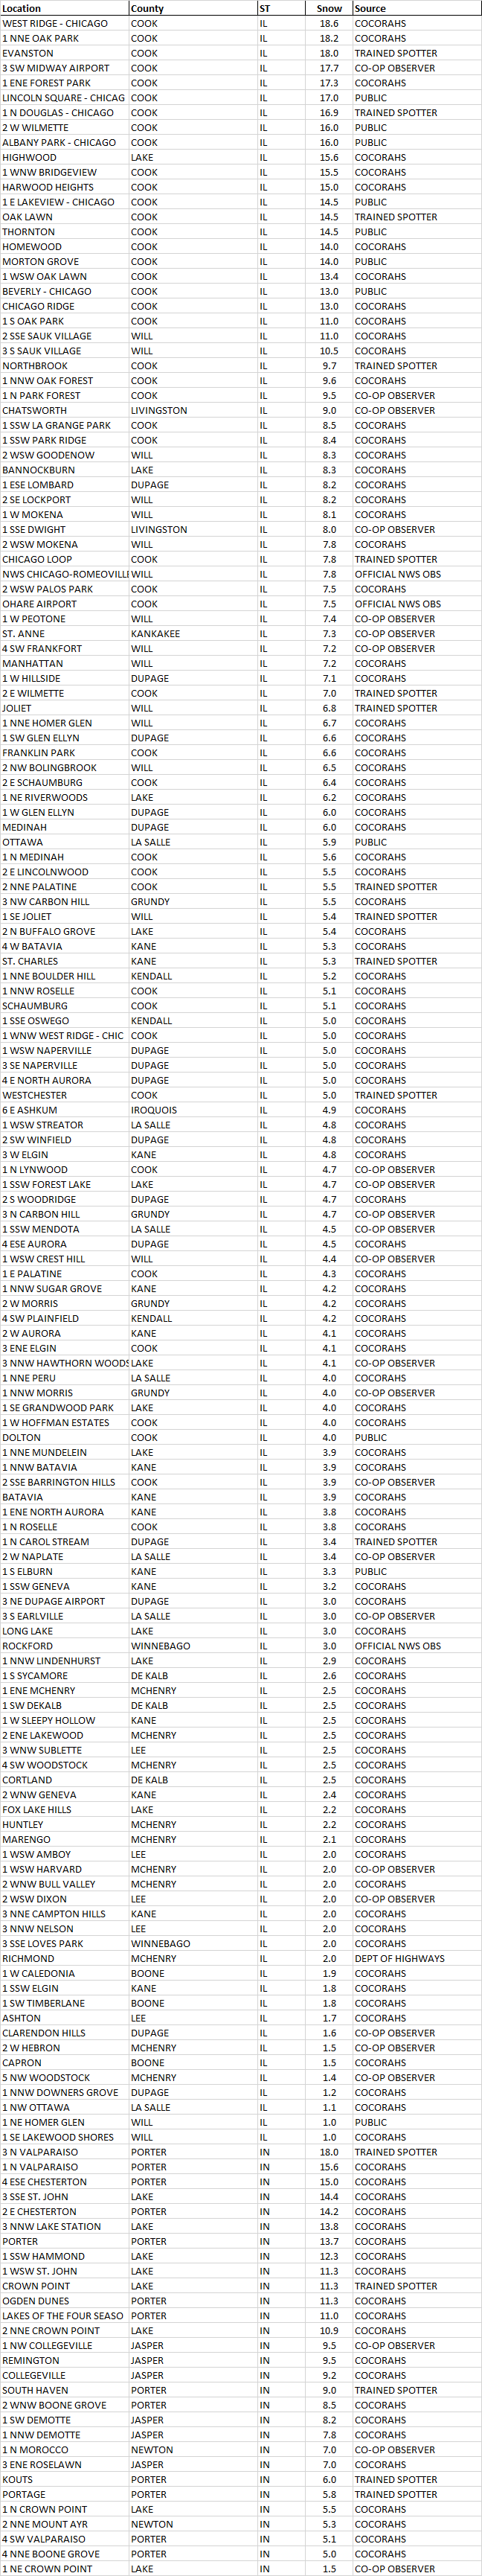
Snowfall totals:
-
Many thanks. It was a remarkable storm.
-
Great documentation of the storm, Alek. Would you mind if I added some of your photos to my winter storms photos site. Just let me know, as your email box was full.
-
It was exceptional. On January 12, 1974, the temperature fell to -33 at Lincoln, NE. The Arctic air mass never made it to the East Coast.
-
Oklahoma City reached -12 this morning. The only time it was at least as cold was the historic February 1899 Arctic blast.
-
Morning thoughts... Through 7 am, precipitation totals included: Bridgeport: 0.77”; Islip” 0.60”; New York City: 0.82”; Newark: 0.83”; Philadelphia: 0.75”; Poughkeepsie: 0.45” (0.25” freezing rain); and, White Plains: 0.63”. Elsewhere, the wild weather continued. At Chicago’s O’Hare Airport 7.5” snow fell, but at Midway Airport, a lake-enhanced 17.7” was measured. Albany Park in Chicago also picked up 16.0” snow. This morning, the temperature dipped to -1° at Dallas. That was the coldest reading there since the temperature also reached -1° on December 23, 1989. It is only the fourth subzero low on record since record keeping began in September 1898. Rain will move away from the region this morning and the clouds will break. It will be unseasonably mild Temperatures will likely top out in the middle and upper 40s in most of the region. Likely high temperatures around the region include: New York City (Central Park): 47° Newark: 48° Philadelphia: 50° Tomorrow will be fair and cold before a storm brings accumulating snow to the region on Thursday. In the long-range, there reasonable consensus among the ensembles that a sustained milder pattern will develop around or just after February 20.
-
At 12:00 AM CST, 3 SW Midway Airport [Cook Co, IL] CO-OP OBSERVER reports HEAVY SNOW of 15.90 INCH. STORM TOTAL THUS FAR THROUGH MIDNIGHT. 10.5" FROM 6PM TO MIDNIGHT. SNOW DEPTH 25".