

donsutherland1
-
Posts
24,137 -
Joined
Content Type
Profiles
Blogs
Forums
American Weather
Media Demo
Store
Gallery
Everything posted by donsutherland1
-
Historic Pacific Northwest Heatwave of 2021
donsutherland1 replied to donsutherland1's topic in Climate Change
On June 28, 2021, the temperature at Bellingham, WA reached 99°, which broke the all-time record of 96° that had been set on July 29, 2009. Today, the temperature rose to 100° at Bellingham, which eclipsed the all-time record set during the historic June heat wave. -
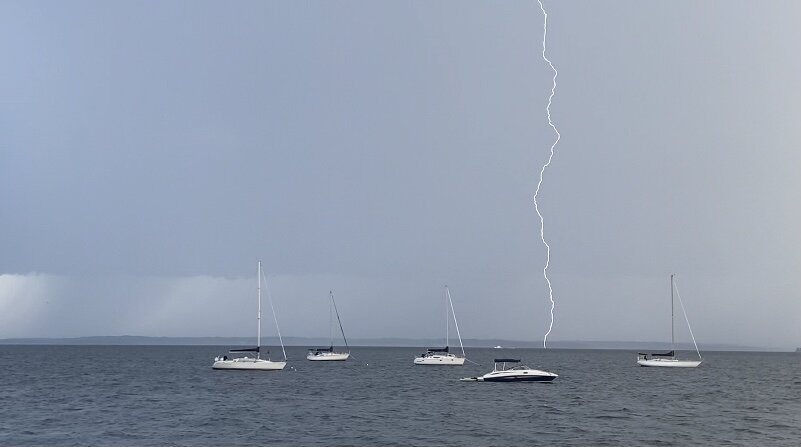
There was a brief period of high winds in Larchmont. A limb and some large branches were down following the storm, which really blew up over the Long Island Sound.
-
I will try to play around with the camera next time there’s a daytime thunderstorm.
-
I didn't have my camera with me, as I was coming back from work. I shot it with my iPhone. If I recall correctly, one has to use the "Bulb" setting for shutter speed and ISO of either 100 or 200. Then the shutter stays open until there have been one or more lightning flashes. A tripod is needed and a remote is useful.
-
Temperatures surged into the 90s across most of the region today. High temperatures included: Allentown: 94° Baltimore: 98° Boston: 96° Bridgeport: 93° Concord: 93° Harrisburg: 96° Hartford: 95° Islip: 90° (tied record set in 2016) New York City-JFK: 88° New York City-LGA: 98° (tied record set in 2016) New York City-NYC: 93° Newark: 98° (tied record set in 1944) Philadelphia: 96° Poughkeepsie: 95° Providence: 94° Scranton: 93° Washington, DC: 96° 90° Days for Select Cities (through August 12): Albany: 4 (2020: 13 days; 5-Year Average: 13.6 days) Allentown: 20 (2020: 24 days; 5-Year Average: 27.6 days) Baltimore: 39 (2020: 46 days; 5-Year Average: 44.6 days) Boston: 18 (2020: 14 days; 5-Year Average: 17.2 days) Bridgeport: 9 (2020: 11 days; 5-Year Average: 13.4 days) Burlington: 8 (2020: 20 days; 5-Year Average: 13.0 days) Harrisburg: 27 (2020: 35 days; 5-Year Average: 30.6 days) Hartford: 19 (2020: 39 days; 5-Year Average: 29.0 days) Islip: 4 (2020: 8 days; 5-Year Average: 9.4 days) New York City-JFK: 6 (2020: 12 days; 5-Year Average: 10.2 days) New York City-LGA: 19 (2020: 34 days; 5-Year Average: 29.4 days) New York City-NYC: 13 (2020: 20 days; 5-Year Average: 18.2 days) Newark: 31 (2020: 31 days; 5-Year Average: 31.2 days) Philadelphia: 27 (2020: 36 days; 5-Year Average: 34.6 days) Scranton: 15 (2020: 25 days; 5-Year Average: 16.4 days) Washington, DC: 36 (2020: 46 days; 5-Year Average: 50.8 days) New York City-Newark Average: 17 (2020: 22 days) ...Expected: 19 (based on regression equation tied to JFK-LGA-EWR data) Searing heat again baked the Pacific Northwest. High temperatures included: Dallesport, WA: 108° (old record: 107°, 1977) Eugene, OR: 103° Medford, OR: 103° Pendleton, OR: 102° Portland: 102° ***Record-tying 5th 100° day this year*** Salem: 102° Seattle: 93° As a result of the ongoing bout of extreme heat, Portland will likely experience its second extreme heat event of the year, making 2021 the first year on record with two such events. Portland could also experience 2 or more 100° high temperatures, allowing 2021 to tie or break the all-time record for most such days. There is an increased possibility that Seattle could also experience its second extreme heat event of the year. In some of the long-range guidance that heat could later be followed by another round of heat in the Northern Plains a week or so later. If so, one will see a similar sequence of events as occurred from late June to mid-July. The ENSO Region 1+2 anomaly was +0.7°C and the Region 3.4 anomaly was -0.3°C for the week centered around August 4. For the past six weeks, the ENSO Region 1+2 anomaly has averaged +0.48°C and the ENSO Region 3.4 anomaly has averaged -0.23°C. Neutral ENSO conditions will likely prevail into mid-September. The SOI was +6.13 today. The preliminary Arctic Oscillation (AO) figure was -0.126 today. On August 10 the MJO was in Phase 2 at an amplitude of 1.894 (RMM). The August 9-adjusted amplitude was 1.435 (RMM). Based on sensitivity analysis applied to the latest guidance, there is an implied 54% probability that New York City will have a warmer than normal August (1991-2020 normal). August will likely finish with a mean temperature near 76.2° (0.2° above normal).
-
From early this evening:
-
I agree. I could see LGA reaching 95-96, but Central Park topping out at 92-93.
-
Historic Pacific Northwest Heatwave of 2021
donsutherland1 replied to donsutherland1's topic in Climate Change
It has happened just twice: July 23, 1991: NYC 99; SEA 99 August 4, 1993: NYC 96; SEA 95 -
Morning thoughts… Early showers will depart. It will become mostly sunny and hot. Temperatures will likely reach the lower and middle 90s. Some locations will reach the upper 90s. Likely high temperatures around the region include: New York City (Central Park): 93° Newark: 99° Philadelphia: 97° Normals: New York City: 30-Year: 83.9°; 15-Year: 84.1° Newark: 30-Year: 85.3°; 15-Year: 85.8° Philadelphia: 30-Year: 86.4°; 15-Year: 86.4° Hot weather will continue tomorrow.
-
Severe June 2021 Heatwave in Phoenix and Tucson
donsutherland1 replied to donsutherland1's topic in Climate Change
July was Tucson’s wettest month on record.- 33 replies
-
- 1
-

-
- heatwave
- extreme heat event
- (and 5 more)
-
Historic Pacific Northwest Heatwave of 2021
donsutherland1 replied to donsutherland1's topic in Climate Change
Select high temperatures for August 11, 2021: Dallesport, WA: 110° (old record: 109°, 1981) Eugene, OR: 102° Medford, OR: 104° Pendleton, OR: 101° Portland: 102° (tied record set in 1977) Richland, WA: 107° (tied record set in 1958) Salem, OR: 103° Seattle: 91° -
Temperatures rose into the upper 80s and lower 90s in the northern Middle Atlantic region and middle 90s elsewhere in the Middle Atlantic region. High temperatures included: Allentown: 92° Baltimore: 98° Boston: 93° Burlington: 90° Danbury: 91° (tied record set in 2016) Harrisburg: 94° Hartford: 93° Islip: 85° New York City-JFK: 85° New York City-LGA: 92° New York City-NYC: 89° Newark: 94° Philadelphia: 95° Providence: 90° Scranton: 91° Washington, DC: 96° 90° Days for Select Cities (through August 11): Albany: 4 (2020: 13 days; 5-Year Average: 13.6 days) Allentown: 19 (2020: 24 days; 5-Year Average: 27.6 days) Baltimore: 38 (2020: 46 days; 5-Year Average: 44.6 days) Boston: 17 (2020: 14 days; 5-Year Average: 17.2 days) Bridgeport: 8 (2020: 11 days; 5-Year Average: 13.4 days) Burlington: 8 (2020: 20 days; 5-Year Average: 13.0 days) Harrisburg: 26 (2020: 35 days; 5-Year Average: 30.6 days) Hartford: 18 (2020: 39 days; 5-Year Average: 29.0 days) Islip: 3 (2020: 8 days; 5-Year Average: 9.4 days) New York City-JFK: 6 (2020: 12 days; 5-Year Average: 10.2 days) New York City-LGA: 18 (2020: 34 days; 5-Year Average: 29.4 days) New York City-NYC: 12 (2020: 20 days; 5-Year Average: 18.2 days) Newark: 30 (2020: 31 days; 5-Year Average: 31.2 days) Philadelphia: 26 (2020: 36 days; 5-Year Average: 34.6 days) Scranton: 14 (2020: 25 days; 5-Year Average: 16.4 days) Washington, DC: 35 (2020: 46 days; 5-Year Average: 50.8 days) New York City-Newark Average: 17 (2020: 22 days) ...Expected: 18 (based on regression equation tied to JFK-LGA-EWR data) Extreme heat descended onto the Pacific Northwest today. High temperatures included: Dallesport, WA: 110° (old record: 109°, 1981) Eugene, OR: 102° Medford, OR: 104° Pendleton, OR: 101° Portland: 102° (tied record set in 1977) Richland, WA: 107° (tied record set in 1958) Salem, OR: 103° Seattle: 91° As a result of the ongoing bout of extreme heat, Portland will likely experience its second extreme heat event of the year, making 2021 the first year on record with two such events. Portland could also experience 2 or more 100° high temperatures, allowing 2021 to tie or break the all-time record for most such days. There remains a possibility that Seattle could also experience its second extreme heat event of the year. In some of the long-range guidance that heat could later be followed by another round of heat in the Northern Plains a week or so later. If so, one will see a similar sequence of events as occurred from late June to mid-July. The ENSO Region 1+2 anomaly was +0.7°C and the Region 3.4 anomaly was -0.3°C for the week centered around August 4. For the past six weeks, the ENSO Region 1+2 anomaly has averaged +0.48°C and the ENSO Region 3.4 anomaly has averaged -0.23°C. Neutral ENSO conditions will likely prevail into mid-September. The SOI was +10.26 today. The preliminary Arctic Oscillation (AO) figure was +0.229 today. On August 9 the MJO was in Phase 2 at an amplitude of 1.433 (RMM). The August 8-adjusted amplitude was 1.134 (RMM). Based on sensitivity analysis applied to the latest guidance, there is an implied 51% probability that New York City will have a warmer than normal August (1991-2020 normal). August will likely finish with a mean temperature near 76.1° (0.1° above normal).
-
Historic Pacific Northwest Heatwave of 2021
donsutherland1 replied to donsutherland1's topic in Climate Change
It’s a low probability. Based on the latest NBE numbers, it’s about a 7% probability. -
Temperatures again rose into the 90s from Washington, DC to Philadelphia. The heat is now moving northward and oppressive heat and humidity lies ahead. There is a growing possibility that the heat wave could extend into the New York City area. Above normal temperatures could persist until near mid-month. Heat has moved into the Pacific Northwest. The temperature rose to 93° at Portland. Extreme heat will move into the area tomorrow. As a result, Portland will likely experience its second extreme heat event of the year. That would make 2021 the first year on record with two such events. Portland could also experience 2 or more 100° high temperatures, allowing 2021 to tie or break the all-time record for most such days. There is an increasing possibility that Seattle could also experience its second extreme heat event of the year. In some of the long-range guidance that heat could later be followed by another round of heat in the Northern Plains a week or so later. If so, one will see a similar sequence of events as occurred from late June to mid-July. The ENSO Region 1+2 anomaly was +0.7°C and the Region 3.4 anomaly was -0.3°C for the week centered around August 4. For the past six weeks, the ENSO Region 1+2 anomaly has averaged +0.48°C and the ENSO Region 3.4 anomaly has averaged -0.23°C. Neutral ENSO conditions will likely prevail into mid-September. The SOI was +17.72 today. The preliminary Arctic Oscillation (AO) figure was +0.163 today. On August 8 the MJO was in Phase 1 at an amplitude of 1.136 (RMM). The August 7-adjusted amplitude was 0.933 (RMM). Based on sensitivity analysis applied to the latest guidance, there is an implied 52% probability that New York City will have a warmer than normal August (1991-2020 normal). August will likely finish with a mean temperature near 76.1° (0.1° above normal).
-
Occasional Thoughts on Climate Change
donsutherland1 replied to donsutherland1's topic in Climate Change
They’re right. -
Historic Pacific Northwest Heatwave of 2021
donsutherland1 replied to donsutherland1's topic in Climate Change
Right now, that does not appear likely. -
Morning thoughts… Clouds will begin to move away. Temperatures will likely reach the middle and upper 80s in the region, except for lower 90s from central New Jersey southward. Likely high temperatures around the region include: New York City (Central Park): 85° Newark: 90° Philadelphia: 92° Normals: New York City: 30-Year: 84.1°; 15-Year: 84.4° Newark: 30-Year: 85.5°; 15-Year: 86.1° Philadelphia: 30-Year: 86.5°; 15-Year: 86.7° Hot weather will overspread the remainder of the Middle Atlantic region tomorrow. Much of the upcoming week will see above normal temperatures.
-
There’s an outside shot on one day, but it looks likely to fall short.
-
Temperatures rose into the lower and middle 80s in the region. However from Philadelphia southward, temperatures reached the 90s. 90° Days for Select Cities (through August 9): Albany: 4 (2020: 13 days; 5-Year Average: 13.6 days) Allentown: 18 (2020: 24 days; 5-Year Average: 27.6 days) Baltimore: 36 (2020: 46 days; 5-Year Average: 44.6 days) Boston: 16 (2020: 14 days; 5-Year Average: 17.2 days) Bridgeport: 8 (2020: 11 days; 5-Year Average: 13.4 days) Burlington: 7 (2020: 20 days; 5-Year Average: 13.0 days) Harrisburg: 24 (2020: 35 days; 5-Year Average: 30.6 days) Hartford: 17 (2020: 39 days; 5-Year Average: 29.0 days) Islip: 3 (2020: 8 days; 5-Year Average: 9.4 days) New York City-JFK: 6 (2020: 12 days; 5-Year Average: 10.2 days) New York City-LGA: 17 (2020: 34 days; 5-Year Average: 29.4 days) New York City-NYC: 12 (2020: 20 days; 5-Year Average: 18.2 days) Newark: 29 (2020: 31 days; 5-Year Average: 31.2 days) Philadelphia: 24 (2020: 36 days; 5-Year Average: 34.6 days) Scranton: 13 (2020: 25 days; 5-Year Average: 16.4 days) Washington, DC: 33 (2020: 46 days; 5-Year Average: 50.8 days) New York City-Newark Average: 16 (2020: 22 days) ...Expected: 17 (based on regression equation tied to JFK-LGA-EWR data) A heat wave is likely in parts of the region, especially from Washington, DC to Philadelphia. Above normal temperatures could persist toward mid-month. A much above normal temperature regime is now developing in the Pacific Northwest. Portland will likely experience its second extreme heat event of the year. That would make 2021 the first year on record with two such events. Portland could also experience 2 or more 100° high temperatures, allowing 2021 to tie or break the all-time record for most such days. There is an increasing possibility that Seattle could also experience its second extreme heat event of the year. In some of the long-range guidance that heat could later be followed by another round of heat in the Northern Plains a week or so later. If so, one will see a similar sequence of events as occurred from late June to mid-July. The ENSO Region 1+2 anomaly was +0.7°C and the Region 3.4 anomaly was -0.3°C for the week centered around August 4. For the past six weeks, the ENSO Region 1+2 anomaly has averaged +0.48°C and the ENSO Region 3.4 anomaly has averaged -0.23°C. Neutral ENSO conditions will likely prevail into mid-September. The SOI was +4.31 today. The preliminary Arctic Oscillation (AO) figure was -0.192 today. On August 7 the MJO was in Phase 1 at an amplitude of 0.934 (RMM). The August 6-adjusted amplitude was 0.763 (RMM). Based on sensitivity analysis applied to the latest guidance, there is an implied 50% probability that New York City will have a warmer than normal August (1991-2020 normal). August will likely finish with a mean temperature near 76.0° (normal).
-
Historic Pacific Northwest Heatwave of 2021
donsutherland1 replied to donsutherland1's topic in Climate Change
Parts of the Pacific Northwest, including Portland, are poised to experience another extreme heat event. Portland has never had more than one such event during a calendar year.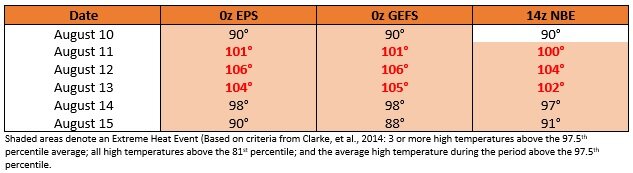
-
Occasional Thoughts on Climate Change
donsutherland1 replied to donsutherland1's topic in Climate Change
Here’s a good link: https://www.climate.gov/news-features/climate-qa/whats-hottest-earths-ever-been -
Arctic Sea Ice Extent, Area, and Volume
donsutherland1 replied to ORH_wxman's topic in Climate Change
I did. Tragically, I believe the base case is insufficient effort by countries to curb then eliminate greenhouse gas emissions. I think we’ll go above 2C and at least approach 3C. Oil & gas exploration and drilling permits continue to be awarded. That means an expanded fossil fuel footprint, not a smaller one. The time remaining for a relatively smooth transition to clean energy continues to be squandered. Down the road in the 2030s, the magnitude of change would be nothing short of highly disruptive, but I suspect policy makers would rather allow the climate to inflict disruption than their own tough measures. So, even then, the fight to eliminate greenhouse gas emissions will be difficult. History has more often seen a short-sighted preference for the status quo prevail. The enlightened efforts to address the Ozone hole have been more an exception than the rule. The actors responsible for the greenhouse gas pollution, particularly the fossil fuel industry and supporting industries, won’t go quietly into the night. They will seek to extract every possible dollar of profits from every last stored hydrocarbon unless they are compelled to move aggressively to adopt fundamental change. They have deep pockets. They have a partially or wholly captive political party in the U.S. (and in some other countries). They are already pushing “greenwashing” ads that are patently misleading (many ran during the Olympic Games). All those factors suggest big obstacles lie in the way of breaking from the status quo. Thus, even as a much better outcome is still within reach, I expect humanity will miss that opportunity and suffer much greater warming (closer to 3C than 2C). -
Occasional Thoughts on Climate Change
donsutherland1 replied to donsutherland1's topic in Climate Change
Below are some of the key findings that this site did not lay out: It is unequivocal that human influence has warmed the atmosphere, ocean and land. Widespread and rapid changes in the atmosphere, ocean, cryosphere and biosphere have occurred… Each of the last four decades has been successively warmer than any decade that preceded it since 1850… The scale of recent changes across the climate system as a whole and the present state of many aspects of the climate system are unprecedented over many centuries to many thousands of years… Human-induced climate change is already affecting many weather and climate extremes in every region across the globe… It is virtually certain that hot extremes (including heatwaves) have become more frequent and more intense across most land regions since the 1950s, while cold extremes (including cold waves) have become less frequent and less severe, with high confidence that human-induced climate change is the main driver of these changes. Some recent hot extremes observed over the past decade would have been extremely unlikely to occur without human influence on the climate system. Marine heatwaves have approximately doubled in frequency since the 1980s (high confidence), and human influence has very likely contributed to most of them since at least 2006… Global surface temperature will continue to increase until at least the mid-century under all emissions scenarios considered. Global warming of 1.5°C and 2°C will be exceeded during the 21st century unless deep reductions in CO2 and other greenhouse gas emissions occur in the coming decades… Compared to 1850–1900, global surface temperature averaged over 2081–2100 is very likely to be higher by 1.0°C to 1.8°C under the very low GHG emissions scenario considered (SSP1-1.9), by 2.1°C to 3.5°C in the intermediate scenario (SSP2-4.5) and by 3.3°C to 5.7°C under the very high GHG emissions scenario (SSP5-8.5). The last time global surface temperature was sustained at or above 2.5°C higher than 1850–1900 was over 3 million years ago (medium confidence)… Many changes in the climate system become larger in direct relation to increasing global warming. They include increases in the frequency and intensity of hot extremes, marine heatwaves, and heavy precipitation, agricultural and ecological droughts in some regions, and proportion of intense tropical cyclones, as well as reductions in Arctic sea ice, snow cover and permafrost… Many changes due to past and future greenhouse gas emissions are irreversible for centuries to millennia, especially changes in the ocean, ice sheets and global sea level… From a physical science perspective, limiting human-induced global warming to a specific level requires limiting cumulative CO2 emissions, reaching at least net zero CO2 emissions, along with strong reductions in other greenhouse gas emissions. Strong, rapid and sustained reductions in CH4 emissions would also limit the warming effect resulting from declining aerosol pollution and would improve air quality. -
Occasional Thoughts on Climate Change
donsutherland1 replied to donsutherland1's topic in Climate Change
The report’s finding of an unequivocal link between human activities and climate change was expected from the recent literature and also devastating. That link vividly illustrates that climate change denial is a dead-end belief system with damaging, if not deadly, consequences for the world, its peoples, and its ecosystems. Rapid and sustained reductions of greenhouse gas emissions by curbing and then eliminating fossil fuel combustion are needed to avert the worst consequences of climate change. Policy makers should move aggressively and immediately to start reducing such emissions and then winding them down to achieve net zero. -
Occasional Thoughts on Climate Change
donsutherland1 replied to donsutherland1's topic in Climate Change
Almost certainly, Chevron’s targets have nothing to do with Scope 3 emissions, which are the vast majority of its emissions.
