

donsutherland1
-
Posts
24,137 -
Joined
Content Type
Profiles
Blogs
Forums
American Weather
Media Demo
Store
Gallery
Everything posted by donsutherland1
-
Severe June 2021 Heatwave in Phoenix and Tucson
donsutherland1 replied to donsutherland1's topic in Climate Change
I believe today has the better shot of reaching 131F than tomorrow. This morning’s low at Death Valley was 102F.- 33 replies
-
- 1
-

-
- heatwave
- extreme heat event
- (and 5 more)
-
Morning thoughts… It will be partly to mostly cloudy. An afternoon or evening shower or thundershower is possible as a warm front slowly edges northward. Temperatures will likely reach the upper 70s and lower 80s in most places today. Likely high temperatures around the region include: New York City (Central Park): 79° Newark: 84° Philadelphia: 87° Normals: New York City: 30-Year: 85.0°; 15-Year: 85.9° Newark: 30-Year: 87.2°; 15-Year: 88.2° Philadelphia: 30-Year: 88.1°; 15-Year: 89.0° Tomorrow will be variably cloudy with some showers. Extreme heat will topple additional records in parts of the western United States and also in Northern Africa and Spain.
-
Severe June 2021 Heatwave in Phoenix and Tucson
donsutherland1 replied to donsutherland1's topic in Climate Change
The frequency of days with highs of 120+ and 125+ has increased in recent decades at Death Valley. 30-year averages and the 3 most recent years: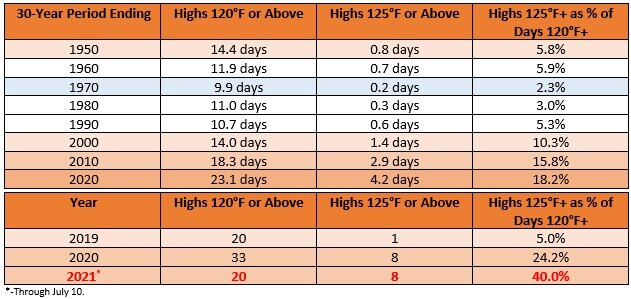
- 33 replies
-
- 1
-

-
- heatwave
- extreme heat event
- (and 5 more)
-
Severe June 2021 Heatwave in Phoenix and Tucson
donsutherland1 replied to donsutherland1's topic in Climate Change
Yesterday’s 130.0 was a bit higher than last year’s 129.9.- 33 replies
-
- 2
-
-
-
- heatwave
- extreme heat event
- (and 5 more)
-
Clouds broke for sunshine this afternoon sending temperatures into the 80s in many places. Tomorrow will see more clouds than sun, along with showers and thundershowers. Out West, another bout of extreme heat is underway. Already, some impressive high temperatures have occurred. Select readings today included: Death Valley: 129° (old record: 128°, 2002*) Fresno: 111° Las Vegas: 116° (old record: 114°, 2003 and 2012) Needles, CA: 122° (old record: 121°, 2003) Phoenix: 112° Redding, CA: 114° * - 134° in 1913 is unreliable. Tomorrow will be another scorching day. By the end of the heatwave, Death Valley could be near or even above its annual record of 10 125° or above days. That record was set in 1913 (unreliable) and then tied in 2013 and 2017. In the long-range, the second half of July and August could wind up warmer to perhaps much warmer than normal based on the evolution of the MJO. The MJO was in Phase 1 with an amplitude between 1.500 and 2.000 on multiple days during the June 20-30 period. There were 8 prior cases similar to 2021. The mean temperature for New York City during the July 16-31 period was 79.4° and the mean temperature for August was 77.1° following such cases. The 1991-20 mean temperature for July 16-31 was 77.9° and 76.0° for August. 75% of the July 16-31 cases and 88% of the August cases were warmer than the 1991-20 mean temperatures. The ENSO Region 1+2 anomaly was +0.3°C and the Region 3.4 anomaly was -0.1°C for the week centered around June 30. For the past six weeks, the ENSO Region 1+2 anomaly has averaged 0.00°C and the ENSO Region 3.4 anomaly has averaged -0.18°C. Neutral ENSO conditions will likely prevail through August. The SOI was +16.80 today. The preliminary Arctic Oscillation (AO) figure was +0.814 today. On July 8 the MJO was in Phase 3 at an amplitude of 1.003(RMM). The July 7-adjusted amplitude was 0.957 (RMM). In late April, the MJO moved through Phase 8 at an extreme amplitude (+3.000 or above). Only February 25, 1988 and March 18-19, 2015 had a higher amplitude at Phase 8. Both 1988 and 2015 went on to have an exceptionally warm July-August period. July-August 1988 had a mean temperature of 79.1°, which ranked 4th highest for that two-month period. July-August 2015 had a mean temperature of 78.9°, which ranked 5th highest for that two-month period. September 2015 was also the warmest September on record. The MJO's extreme passage through Phase 8 could provide the first hint of a hot summer. Since 1896, 76% of years that saw Phoenix reach 115° or above in June, as occurred this year, had a warmer than July-August in the Middle Atlantic region. The ratio of top 30 July-August temperatures relative to bottom 30 temperatures was 6:1 in favor of the warmth. Overall, the ingredients continue to fall into place for a warmer than normal to potentially hot summer. Based on sensitivity analysis applied to the latest guidance, there is an implied 51% probability that New York City will have a warmer than normal July (1991-2020 normal). July will likely finish with a mean temperature near 77.7° (0.2° above normal).
-
Clouds broke for sunshine at the New York Botanical Garden sending the temperature into the lower 80s.

-
Morning thoughts… It will be partly sunny and warm. Temperatures will likely reach the upper 70s and lower 80s in most places today. Likely high temperatures around the region include: New York City (Central Park): 79° Newark: 84° Philadelphia: 83° Normals: New York City: 30-Year: 85.0°; 15-Year: 85.8° Newark: 30-Year: 87.1°; 15-Year: 88.1° Philadelphia: 30-Year: 88.0°; 15-Year: 88.9° Tomorrow will be variably cloudy with some showers. Extreme heat will topple records in parts of the western United States and also in Northern Africa and Spain this weekend.
-
655 SXUS75 KVEF 100041 RERVEF RECORD EVENT REPORT NATIONAL WEATHER SERVICE LAS VEGAS, NV 541 PM PDT FRI JUL 9 2021 ...RECORD HOT TEMPERATURES FOR JULY 9... A RECORD HIGH TEMPERATURE OF 116 DEGREES WAS SET AT LAS VEGAS NV TODAY. THIS BROKE THE PREVIOUS RECORD OF 113, WHICH WAS SET IN 1943 AND TIED IN 2012. TEMPERATURE RECORDS FOR LAS VEGAS DATE BACK TO 1937. A RECORD HIGH TEMPERATURE OF 113 DEGREES WAS TIED AT BARSTOW DAGGETT TODAY. THE RECORD WAS SET IN 2002. TEMPERATURE RECORDS FOR BARSTOW DAGGETT DATE BACK TO 1943. A RECORD HIGH TEMPERATURE OF 108 DEGREES WAS SET AT BISHOP CA TODAY. THIS BROKE THE OLD RECORD OF 107, WHICH WAS SET IN 2002. TEMPERATURE RECORDS FOR BISHOP DATE BACK TO 1943. A RECORD HIGH TEMPERATURE OF 120 DEGREES WAS SET AT NEEDLES CA TODAY. THIS BROKE THE OLD RECORD OF 119, WHICH WAS SET IN 1961. TEMPERATURE RECORDS FOR NEEDLES DATE BACK TO 1888. A RECORD HIGH TEMPERATURE OF 111 DEGREES WAS SET AT KINGMAN AZ TODAY. THIS BROKE THE OLD RECORD OF 108, WHICH WAS SET IN 1985. TEMPERATURE RECORDS FOR KINGMAN DATE BACK TO 1901. A RECORD HIGH TEMPERATURE OF 130 DEGREES WAS SET AT DEATH VALLEY CA TODAY. THIS BROKE THE OLD RECORD OF 129, WHICH WAS SET IN 1913. TEMPERATURE RECORDS FOR DEATH VALLEY DATE BACK TO 1911. THE ABOVE INFORMATION IS PRELIMINARY AND SUBJECT TO A FINAL REVIEW. FOR FINAL CERTIFIED DATA, PLEASE CONTACT NOAA'S NATIONAL CENTERS FOR ENVIRONMENTAL INFORMATION (NCEI) LOCATED IN ASHEVILLE, NORTH CAROLINA. $$ MORGAN
-
Numerous daily rainfall records were set as Elsa moved through the region. Daily records through 8 pm included: Bridgeport: 4.09" (old record: 1.29", 1964) Islip: 2.14" (old record: 1.73", 1964) New York City: 1.79" (old record: 1.09", 1964) Providence: 1.77" (old record: 1.31", 1962) Central Park's 2-day total of 4.06" was the 4th biggest 2-day rainfall on record in July. Records go back to 1869. Tomorrow will be partly sunny and a bit cooler. Some showers and thundershowers are likely, especially during the afternoon and evening hours. Out West, another bout of extreme heat is underway. Already, some impressive high temperatures have occurred. Select readings today included: Death Valley, CA: 130° (old record: 126°, 2008*) Fresno: 111° Las Vegas: 116° (old record: 113°, 1943 and 2012) Needles, CA: 120° (old record: 119°, 1961) Phoenix: 112° *-a 129°reading in 1913 is unreliable. The height of this latest bout of heat could occur tomorrow into early next week. Central California could see particularly large temperature anomalies. Death Valley will likely top out with readings between 128°-130°. By the end of the heatwave, Death Valley could be near or even above its annual record of 10 125° or above days. That record was set in 1913 (unreliable) and then tied in 2013 and 2017. In the long-range, the second half of July and August could wind up warmer to perhaps much warmer than normal based on the evolution of the MJO. The MJO was in Phase 1 with an amplitude between 1.500 and 2.000 on multiple days during the June 20-30 period. There were 8 prior cases similar to 2021. The mean temperature for New York City during the July 16-31 period was 79.4° and the mean temperature for August was 77.1° following such cases. The 1991-20 mean temperature for July 16-31 was 77.9° and 76.0° for August. 75% of the July 16-31 cases and 88% of the August cases were warmer than the 1991-20 mean temperatures. The ENSO Region 1+2 anomaly was +0.3°C and the Region 3.4 anomaly was -0.1°C for the week centered around June 30. For the past six weeks, the ENSO Region 1+2 anomaly has averaged 0.00°C and the ENSO Region 3.4 anomaly has averaged -0.18°C. Neutral ENSO conditions will likely prevail through August. The SOI was +14.71 today. The preliminary Arctic Oscillation (AO) figure was +1.232 today. On July 7 the MJO was in Phase 3 at an amplitude of 0.961(RMM). The July 6-adjusted amplitude was 1.120 (RMM). In late April, the MJO moved through Phase 8 at an extreme amplitude (+3.000 or above). Only February 25, 1988 and March 18-19, 2015 had a higher amplitude at Phase 8. Both 1988 and 2015 went on to have an exceptionally warm July-August period. July-August 1988 had a mean temperature of 79.1°, which ranked 4th highest for that two-month period. July-August 2015 had a mean temperature of 78.9°, which ranked 5th highest for that two-month period. September 2015 was also the warmest September on record. The MJO's extreme passage through Phase 8 could provide the first hint of a hot summer. Since 1896, 76% of years that saw Phoenix reach 115° or above in June, as occurred this year, had a warmer than July-August in the Middle Atlantic region. The ratio of top 30 July-August temperatures relative to bottom 30 temperatures was 6:1 in favor of the warmth. Overall, the ingredients continue to fall into place for a warmer than normal to potentially hot summer. Based on sensitivity analysis applied to the latest guidance, there is an implied 53% probability that New York City will have a warmer than normal July (1991-2020 normal). July will likely finish with a mean temperature near 77.7° (0.2° above normal).
-
Morning thoughts… As of 8 am, New York City had picked up 1.49” of rain so far. That broke the daily record of 1.09”, which was set in 1964. The 2-day rainfall is currently 3.76”. That is the 5th highest 2-day figure on record for July. Rain will end later this morning and clouds could break for a time. It will remain warm. Some showers and thundershowers are possible during the afternoon or evening. Temperatures will likely reach the middle and upper 80s in most places today. Likely high temperatures around the region include: New York City (Central Park): 85° Newark: 90° Philadelphia: 88° Normals: New York City: 30-Year: 84.9°; 15-Year: 85.6° Newark: 30-Year: 87.1°; 15-Year: 88.0° Philadelphia: 30-Year: 88.0°; 15-Year: 88.8° Tomorrow will be partly sunny and warm.
-
Between 5 pm and 6 pm, thunderstorms dumped torrential rains on New York City. Central Park picked up 1.56" rain in an hour. Since hourly records were compiled in 1943, this was the 7th biggest hourly rainfall and the 2nd biggest hourly rainfall in July. The July record is 1.58", which was set on July 3, 1967. Daily rainfall through 7 pm was 2.18", which surpassed the longstanding daily mark of 1.80" from 1899. Elsa will move through the region tonight into tomorrow. Elsa will likely bring a gusty wind and a period of heavy rain. A general 1"-3" rainfall is likely across the region from Elsa. Locally higher amounts could reach 4"-6". Out West, another above to much above normal regime is taking hold. The height of this latest bout of heat could occur during the weekend into early next week. Central California could see particularly large temperature anomalies. Death Valley will likely top out with readings between 125°-130°. By the end of the heatwave, Death Valley could be near or even above its annual record of 10 125° or above days. The record was set in 1913 (unreliable) and then tied in 2013 and 2017. In the long-range, the second half of July and August could wind up warmer to perhaps much warmer than normal based on the evolution of the MJO. The MJO was in Phase 1 with an amplitude between 1.500 and 2.000 on multiple days during the June 20-30 period. There were 8 prior cases similar to 2021. The mean temperature for New York City during the July 16-31 period was 79.4° and the mean temperature for August was 77.1° following such cases. The 1991-20 mean temperature for July 16-31 was 77.9° and 76.0° for August. 75% of the July 16-31 cases and 88% of the August cases were warmer than the 1991-20 mean temperatures. The ENSO Region 1+2 anomaly was +0.3°C and the Region 3.4 anomaly was -0.1°C for the week centered around June 30. For the past six weeks, the ENSO Region 1+2 anomaly has averaged 0.00°C and the ENSO Region 3.4 anomaly has averaged -0.18°C. Neutral ENSO conditions will likely prevail through August. The SOI was +11.39 today. The preliminary Arctic Oscillation (AO) figure was +1.811 today. On July 6 the MJO was in Phase 3 at an amplitude of 1.121 (RMM). The July 5-adjusted amplitude was 1.232 (RMM). In late April, the MJO moved through Phase 8 at an extreme amplitude (+3.000 or above). Only February 25, 1988 and March 18-19, 2015 had a higher amplitude at Phase 8. Both 1988 and 2015 went on to have an exceptionally warm July-August period. July-August 1988 had a mean temperature of 79.1°, which ranked 4th highest for that two-month period. July-August 2015 had a mean temperature of 78.9°, which ranked 5th highest for that two-month period. September 2015 was also the warmest September on record. The MJO's extreme passage through Phase 8 could provide the first hint of a hot summer. Since 1896, 76% of years that saw Phoenix reach 115° or above in June, as occurred this year, had a warmer than July-August in the Middle Atlantic region. The ratio of top 30 July-August temperatures relative to bottom 30 temperatures was 6:1 in favor of the warmth. Overall, the ingredients continue to fall into place for a warmer than normal to potentially hot summer. Based on sensitivity analysis applied to the latest guidance, there is an implied 51% probability that New York City will have a warmer than normal July (1991-2020 normal). July will likely finish with a mean temperature near 77.7° (0.2° above normal).
-
Morning thoughts... Clouds will increase. It will still be very warm today. Showers and thunderstorms are likely. There could be heavy downpours that could produce street and highway flooding in places. Temperatures will likely reach the middle and upper 80s in most places today. Likely high temperatures around the region include: New York City (Central Park): 86° Newark: 90° Philadelphia: 88° Normals: New York City: 30-Year: 84.8°; 15-Year: 85.5° Newark: 30-Year: 87.0°; 15-Year: 87.8° Philadelphia: 30-Year: 87.9°; 15-Year: 88.7° Elsa will pass through the region tonight into tomorrow bringing a period of gusty winds and heavy rain. General rainfall amounts tonight through tomorrow will be 1”-3” with locally higher amounts.
-
Temperatures rose mainly into the upper 80s and lower 90s today. 90° Days for Select Cities (through July 7): Albany: 4 (2020: 13 days; 5-Year Average: 13.6 days) Allentown: 12 (2020: 24 days; 5-Year Average: 27.6 days) Baltimore: 17 (2020: 46 days; 5-Year Average: 44.6 days) Boston: 13 (2020: 14 days; 5-Year Average: 17.2 days) Bridgeport: 6 (2020: 11 days; 5-Year Average: 13.4 days) Burlington: 7 (2020: 20 days; 5-Year Average: 13.0 days) Harrisburg: 14 (2020: 35 days; 5-Year Average: 30.6 days) Hartford: 13 (2020: 39 days; 5-Year Average: 29.0 days) Islip: 3 (2020: 8 days; 5-Year Average: 9.4 days) New York City-JFK: 5 (2020: 12 days; 5-Year Average: 10.2 days) New York City-LGA: 11 (2020: 34 days; 5-Year Average: 29.4 days) New York City-NYC: 10 (2020: 20 days; 5-Year Average: 18.2 days) Newark: 18 (2020: 31 days; 5-Year Average: 31.2 days) Philadelphia: 14 (2020: 36 days; 5-Year Average: 34.6 days) Scranton: 11 (2020: 25 days; 5-Year Average: 16.4 days) Washington, DC: 14 (2020: 46 days; 5-Year Average: 50.8 days) New York City-Newark Average: 11 (2020: 22 days) ...Expected: 11 (based on regression equation tied to JFK-LGA-EWR data) In the South, Elsa brought daily record rainfall to parts of the region. As of 8 pm EDT, Jacksonville picked up 2.66" rain (old record: 2.07", 1963). In a portion of eastern Texas, even heavier rain was reported. Rockport Aransas County Airport received an all-time daily record 9.63" rainfall. Meanwhile, Banak, Norway (70.1°N) experienced its second 90° day in three days. Tomorrow and Friday could be unsettled as a frontal boundary sits near the region and Elsa through the region. Elsa could bring a general 1"-3" rainfall across the region. Out West, another above to much above normal regime is now developing. The height of this latest bout of heat could occur during the weekend into early next week. Central California could see particularly large temperature anomalies. Death Valley will likely top out with readings between 125°-130°. By the end of the heatwave, Death Valley could be near or even above its annual record of 10 125° or above days. The record was set in 1913 (unreliable) and then tied in 2013 and 2017. In the long-range, the second half of July and August could wind up warmer to perhaps much warmer than normal based on the evolution of the MJO. The MJO was in Phase 1 with an amplitude between 1.500 and 2.000 on multiple days during the June 20-30 period. There were 8 prior cases similar to 2021. The mean temperature for New York City during the July 16-31 period was 79.4° and the mean temperature for August was 77.1° following such cases. The 1991-20 mean temperature for July 16-31 was 77.9° and 76.0° for August. 75% of the July 16-31 cases and 88% of the August cases were warmer than the 1991-20 mean temperatures. The ENSO Region 1+2 anomaly was +0.3°C and the Region 3.4 anomaly was -0.1°C for the week centered around June 30. For the past six weeks, the ENSO Region 1+2 anomaly has averaged 0.00°C and the ENSO Region 3.4 anomaly has averaged -0.18°C. Neutral ENSO conditions will likely prevail through August. The SOI was +11.33 today. The preliminary Arctic Oscillation (AO) figure was +1.861 today. That is the most strongly positive AO reading in July since July 26, 2002 when the AO was +2.042. On July 5 the MJO was in Phase 3 at an amplitude of 1.232 (RMM). The July 4-adjusted amplitude was 1.530 (RMM). In late April, the MJO moved through Phase 8 at an extreme amplitude (+3.000 or above). Only February 25, 1988 and March 18-19, 2015 had a higher amplitude at Phase 8. Both 1988 and 2015 went on to have an exceptionally warm July-August period. July-August 1988 had a mean temperature of 79.1°, which ranked 4th highest for that two-month period. July-August 2015 had a mean temperature of 78.9°, which ranked 5th highest for that two-month period. September 2015 was also the warmest September on record. The MJO's extreme passage through Phase 8 could provide the first hint of a hot summer. Since 1896, 76% of years that saw Phoenix reach 115° or above in June, as occurred this year, had a warmer than July-August in the Middle Atlantic region. The ratio of top 30 July-August temperatures relative to bottom 30 temperatures was 6:1 in favor of the warmth. Overall, the ingredients continue to fall into place for a warmer than normal to potentially hot summer. Based on sensitivity analysis applied to the latest guidance, there is an implied 51% probability that New York City will have a warmer than normal July (1991-2020 normal). July will likely finish with a mean temperature near 77.7° (0.2° above normal).
-
Historic Pacific Northwest Heatwave of 2021
donsutherland1 replied to donsutherland1's topic in Climate Change
Attribution Study: Pacific Northwest Heat "Virtually Impossible" without Human-Induced Climate Change Excerpts: Using published peer-reviewed methods, we analysed how human-induced climate change affected the maximum temperatures in the region where most people have been affected by the heat (45–52 ºN, 119–123 ºW) including the cities of Seattle, Portland, and Vancouver (with well over 9 million people in their combined metropolitan areas)... Based on observations and modeling, the occurrence of a heatwave with maximum daily temperatures (TXx) as observed in the area 45–52 ºN, 119–123 ºW, was virtually impossible without human-caused climate change... There are two possible sources of this extreme jump in peak temperatures. The first is that this is a very low probability event, even in the current climate which already includes about 1.2°C of global warming — the statistical equivalent of really bad luck, albeit aggravated by climate change. The second option is that nonlinear interactions in the climate have substantially increased the probability of such extreme heat, much beyond the gradual increase in heat extremes that has been observed up to now. We need to investigate the second possibility further, although we note the climate models do not show it. All numbers below assume that the heatwave was a very low probability event that was not caused by new nonlinearities... Also, this heatwave was about 2°C hotter than it would have been if it had occurred at the beginning of the industrial revolution (when global mean temperatures were 1.2°C cooler than today). Looking into the future, in a world with 2°C of global warming (0.8°C warmer than today which at current emission levels would be reached as early as the 2040s), this event would have been another degree hotter. An event like this – currently estimated to occur only once every 1000 years, would occur roughly every 5 to 10 years in that future world with 2°C of global warming. https://www.worldweatherattribution.org/western-north-american-extreme-heat-virtually-impossible-without-human-caused-climate-change/ The full study can be found here. -
Morning thoughts... It will be partly sunny and hot today. Showers and thundershowers are possible during the afternoon or evening hours. Temperatures will likely reach the lower and middle 90s in most places today. Likely high temperatures around the region include: New York City (Central Park): 92° Newark: 98° Philadelphia: 95° Normals: New York City: 30-Year: 84.7°; 15-Year: 85.3° Newark: 30-Year: 86.9°; 15-Year: 87.7° Philadelphia: 30-Year: 87.8°; 15-Year: 88.6° Tomorrow and Friday will likely see periods of rain and thunderstorms. Elsa could bring a period of heavy downpours to parts of the region on Friday.
-
Temperatures surged into the 90s today except right along the immediate coastline where a cooling sea breeze held temperatures in the 80s. Strong thunderstorms knocked the temperature down into the lower 70s during the evening, but the relief will be temporary. Tomorrow will again be partly sunny and hot. Many locations will see high temperatures in the 90s. Clouds will increase later during the afternoon or evening. Thursday and Friday could be unsettled as a frontal boundary sits near the region and Elsa passes to the south and east of the region. Out West, another above to much above normal regime will likely set up over parts of the West, including the Southwest. The height of this latest bout of heat could occur during the weekend into early next week. Central California could see particularly large temperature anomalies. Death Valley will likely top out with readings between 125°-130°. In the long-range, the second half of July and August could wind up warmer to perhaps much warmer than normal based on the evolution of the MJO. The MJO was in Phase 1 with an amplitude between 1.500 and 2.000 on multiple days during the June 20-30 period. There were 8 prior cases similar to 2021. The mean temperature for New York City during the July 16-31 period was 79.4° and the mean temperature for August was 77.1° following such cases. The 1991-20 mean temperature for July 16-31 was 77.9° and 76.0° for August. 75% of the July 16-31 cases and 88% of the August cases were warmer than the 1991-20 mean temperatures. The ENSO Region 1+2 anomaly was +0.3°C and the Region 3.4 anomaly was -0.1°C for the week centered around June 30. For the past six weeks, the ENSO Region 1+2 anomaly has averaged 0.00°C and the ENSO Region 3.4 anomaly has averaged -0.18°C. Neutral ENSO conditions will likely prevail through August. The SOI was +3.38 today. The preliminary Arctic Oscillation (AO) figure was +1.069 today. On July 4 the MJO was in Phase 3 at an amplitude of 1.532 (RMM). The July 3-adjusted amplitude was 1.485 (RMM). In late April, the MJO moved through Phase 8 at an extreme amplitude (+3.000 or above). Only February 25, 1988 and March 18-19, 2015 had a higher amplitude at Phase 8. Both 1988 and 2015 went on to have an exceptionally warm July-August period. July-August 1988 had a mean temperature of 79.1°, which ranked 4th highest for that two-month period. July-August 2015 had a mean temperature of 78.9°, which ranked 5th highest for that two-month period. September 2015 was also the warmest September on record. The MJO's extreme passage through Phase 8 could provide the first hint of a hot summer. Since 1896, 76% of years that saw Phoenix reach 115° or above in June, as occurred this year, had a warmer than July-August in the Middle Atlantic region. The ratio of top 30 July-August temperatures relative to bottom 30 temperatures was 6:1 in favor of the warmth. Overall, the ingredients continue to fall into place for a warmer than normal to potentially hot summer.
-
The analysis is a multiple regression analysis. Independent variables are nearby sites. The dependent variable is Central Park. The timeframe is 1971-00, the last period for most of the timeframe was not impacted by excessive tree growth. Due to changing sun angles, I created three separate equations, one for June, one for July, and one for August. The coefficient of determination is well over .9 e.g., June was 0.955.
-
June 29 would have been 98 in Central Park based on the equation.
-
Morning thoughts... It will become partly sunny and hot today. Temperatures will likely reach the lower and middle 90s in most places today. Likely high temperatures around the region include: New York City (Central Park): 93° Newark: 98° Philadelphia: 93° Normals: New York City: 30-Year: 84.5°; 15-Year: 85.1° Newark: 30-Year: 86.8°; 15-Year: 87.5° Philadelphia: 30-Year: 87.7°; 15-Year: 88.4° Tomorrow will be another hot day.
-
JFK: Probably NYC: A small probability. Based on a regression analysis tied to surrounding stations, Central Park would have hit 100F had it not been for the trees. It also would have 2 more 90F days so far than has been recorded.
-
It hasn’t. 99 is the highest on record.
-
Temperatures surged into the 80s today as warmer air began pushing into the region. Tomorrow will be partly sunny and hot. Many locations will see high temperatures in the 90s. Meanwhile across northern Scandinavia, exceptional heat toppled records. Three locations joined the "70-90" (70°N-90°F) club today. Banak, Norway reached 94°. Tanabru, Norway hit 92°. Utsjoki, Finland topped out at 91°. Out West, there are growing model indications that another above to much above normal regime could set up over parts of the West, including the Southwest. The height of the next round of warmth could occur during the weekend and early next week. In the long-range, the second half of July and August could wind up warmer to perhaps much warmer than normal based on the evolution of the MJO. The MJO was in Phase 1 with an amplitude between 1.500 and 2.000 on multiple days during the June 20-30 period. There were 8 prior cases similar to 2021. The mean temperature for New York City during the July 16-31 period was 79.4° and the mean temperature for August was 77.1° following such cases. The 1991-20 mean temperature for July 16-31 was 77.9° and 76.0° for August. 75% of the July 16-31 cases and 88% of the August cases were warmer than the 1991-20 mean temperatures. The ENSO Region 1+2 anomaly was +0.3°C and the Region 3.4 anomaly was -0.1°C for the week centered around June 30. For the past six weeks, the ENSO Region 1+2 anomaly has averaged 0.00°C and the ENSO Region 3.4 anomaly has averaged -0.18°C. Neutral ENSO conditions will likely prevail through August. The SOI was +0.98 today. The preliminary Arctic Oscillation (AO) figure was +0.505 today. On July 3 the MJO was in Phase 2 at an amplitude of 1.262 (RMM). The July 2-adjusted amplitude was 1.474 (RMM). In late April, the MJO moved through Phase 8 at an extreme amplitude (+3.000 or above). Only February 25, 1988 and March 18-19, 2015 had a higher amplitude at Phase 8. Both 1988 and 2015 went on to have an exceptionally warm July-August period. July-August 1988 had a mean temperature of 79.1°, which ranked 4th highest for that two-month period. July-August 2015 had a mean temperature of 78.9°, which ranked 5th highest for that two-month period. September 2015 was also the warmest September on record. The MJO's extreme passage through Phase 8 could provide the first hint of a hot summer. Since 1896, 76% of years that saw Phoenix reach 115° or above in June, as occurred this year, had a warmer than July-August in the Middle Atlantic region. The ratio of top 30 July-August temperatures relative to bottom 30 temperatures was 6:1 in favor of the warmth. Overall, the ingredients continue to fall into place for a warmer than normal to potentially hot summer. Finally, on July 4, Arctic sea ice extent was 8.467 million square kilometers (JAXA). That was the lowest figure on record for July 4.
-
Historic Pacific Northwest Heatwave of 2021
donsutherland1 replied to donsutherland1's topic in Climate Change
There has been a large increase in the number of such minimum temperatures: 1961-90: 2.3 days per year 1971-00: 2.6 days per year 1981-10: 4.0 days per year 1991-20: 6.1 days per year 2021: 8 days (through July 4) 10 Highest Annual Figures: 15, 2015 12, 2014 11, 2007, 2012, 2013 10, 2017 9, 1971, 1994, 2018 8, 1998, 2021* -
Historic Pacific Northwest Heatwave of 2021
donsutherland1 replied to donsutherland1's topic in Climate Change
From the Boise NWS Office: Record streak of 70F low temperatures https://twitter.com/NWSBoise/status/1412085747377606656?s=20