

donsutherland1
-
Posts
24,134 -
Joined
Content Type
Profiles
Blogs
Forums
American Weather
Media Demo
Store
Gallery
Everything posted by donsutherland1
-
Historic Pacific Northwest Heatwave of 2021
donsutherland1 replied to donsutherland1's topic in Climate Change
Weather summary for British Columbia issued by Environment Canada at 11:26 p.m. PDT Saturday 3 July 2021. Discussion. The following area set a daily maximum temperature record on July 3, 2021: Vernon Area (Vernon Auto) New record of 36.4 Old record of 35.6 set in 1906 Records in this area have been kept since 1900 Note: the temperature record reported here has been derived from a selection of historical stations in this geographic area that were active during the period of record. Please note that this summary may contain preliminary or unofficial information and does not constitute a complete or final report. End/PSPC -
61 in Central Park.
-
Yes, it was cool with a high of 69 before the extreme heat arrived.
-
Morning thoughts... It will be partly cloudy and warmer today. A shower is still possible. Temperatures will likely reach the upper 70s and lower 80s in most places today. Likely high temperatures around the region include: New York City (Central Park): 77° Newark: 83° Philadelphia: 83° Normals: New York City: 30-Year: 84.3°; 15-Year: 84.7° Newark: 30-Year: 86.6°; 15-Year: 87.2° Philadelphia: 30-Year: 87.5°; 15-Year: 88.1° The rise in temperatures will continue tomorrow and a brief period of hot weather is likely Tuesday and Wednesday.
-
Historic Pacific Northwest Heatwave of 2021
donsutherland1 replied to donsutherland1's topic in Climate Change
I don’t have daily records for Siberia, so I am not sure. This was a more intense episode of heat, but not as prolonged. Once the attribution study comes out, a comparison might be possible. In terms of intensity, though, this was the most severe outbreak of heat anywhere and at any time during the instrument record. -
The temperature peaked at 66° in New York City's Central Park. The last time the temperature rose no higher than the 60s in Central Park during July occurred on July 25, 2013 when the temperature peaked at 68°. This was the coldest July high temperature since July 8, 2005 when the temperature also topped out at 66°. The daily mean temperature of 62.5° is the coldest July figure in Central Park since July 12, 1990 when the mean temperature was also 62.5° Tomorrow will be variably cloudy and warmer. There could be a brief push of very warm air into the region early next week. Out West, there are growing model indications that another above to much above normal regime could set up over parts of the West, including the Southwest. The ENSO Region 1+2 anomaly was +0.2°C and the Region 3.4 anomaly was 0.0°C for the week centered around June 23. For the past six weeks, the ENSO Region 1+2 anomaly has averaged -0.17°C and the ENSO Region 3.4 anomaly has averaged -0.20°C. Neutral ENSO conditions will likely prevail through August. The SOI was +19.57 today. The preliminary Arctic Oscillation (AO) figure was -0.143 today. On July 1 the MJO was in Phase 2 at an amplitude of 1.276 (RMM). The June 30-adjusted amplitude was 1.367 (RMM). In late April, the MJO moved through Phase 8 at an extreme amplitude (+3.000 or above). Only February 25, 1988 and March 18-19, 2015 had a higher amplitude at Phase 8. Both 1988 and 2015 went on to have an exceptionally warm July-August period. July-August 1988 had a mean temperature of 79.1°, which ranked 4th highest for that two-month period. July-August 2015 had a mean temperature of 78.9°, which ranked 5th highest for that two-month period. September 2015 was also the warmest September on record. The MJO's extreme passage through Phase 8 could provide the first hint of a hot summer. Since 1896, 76% of years that saw Phoenix reach 115° or above in June, as occurred this year, had a warmer than July-August in the Middle Atlantic region. The ratio of top 30 July-August temperatures relative to bottom 30 temperatures was 6:1 in favor of the warmth. Overall, the ingredients continue to fall into place for a warmer than normal to potentially hot summer.
-
From the New York Botanical Garden this afternoon:

-
Breaks in the clouds at the New York Botanical Garden.
-
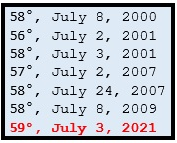
New York City’s (Central Park) < 60° Temperatures in July: 2000-2021
-
Historic Pacific Northwest Heatwave of 2021
donsutherland1 replied to donsutherland1's topic in Climate Change
The Washington Post reported: Within the next week, researchers expect to publish a “rapid attribution” study that determines how climate change made the Northwest heat wave more likely. Yet precisely quantifying the role of climate change in the event has been difficult because the heat was just so extreme, said Michael Wehner, a climate scientist at Lawrence Berkeley National Laboratory in California who is contributing to the attribution effort. “It’s well beyond what straightforward statistical analysis would suggest. It’s well beyond what climate models suggest,” he continued. “But it happened.” https://www.washingtonpost.com/climate-environment/2021/07/03/climate-change-heat-dome-death/ -
Morning thoughts... This morning, the temperature fell to 59° in Central Park. That was the first time since July 8, 2009 that the temperature fell into the 50s there during July. It will be mostly cloudy and unseasonably cool today. Showers and periods of light rain are likely. Temperatures will likely reach the upper 60s in most places today. Likely high temperatures around the region include: New York City (Central Park): 67° Newark: 71° Philadelphia: 72° Normals: New York City: 30-Year: 84.1°; 15-Year: 84.5° Newark: 30-Year: 86.4°; 15-Year: 87.0° Philadelphia: 30-Year: 87.4°; 15-Year: 88.0° The last July day with a maximum temperature below 70° at Central Park was July 25, 2013 when the thermometer topped out at 68°.
-
Historic Pacific Northwest Heatwave of 2021
donsutherland1 replied to donsutherland1's topic in Climate Change
Weather summary for Saskatchewan issued by Environment Canada at 4:03 p.m. CST Friday 2 July 2021. Discussion. Daily temperatures records were broken across Saskatchewan yesterday. Several all-time records have also been confirmed. The following areas set an all-time temperature record on July 1, 2021. Temperatures in degrees Celsius. Collins Bay Area New record of 37.0 Old record of 35.5 set on June 30, 2021 Records in this area have been kept since 1972 The following areas set an all-time temperature record on June 30, 2021. Temperatures in degrees Celsius. Buffalo Narrows Area New record of 35.8 Old record of 35.6 set on June 27, 2002 Records in this area have been kept since 1962 Collins Bay Area New record of 35.5 Old record of 33.0 set on June 27, 2002 Records in this area have been kept since 1972 Key Lake Area New record of 37.0 Old record of 36.0 set on August 10, 1991 Records in this area have been kept since 1976 Stony Rapids Area New record of 39.8 Old record of 36.7 set on June 27, 2002 Records in this area have been kept since 1960 Uranium City Area New record of 38.0 Old record of 34.7 set on July 27, 1984 Records in this area have been kept since 1953 The following areas set a daily maximum temperature record on July 1, 2021. Temperatures in degrees Celsius. Assiniboia Area New record of 33.7 Old record of 31.5 set in 1985 Records in this area have been kept since 1965 Buffalo Narrows Area New record of 34.0 Old record of 31.0 set in 2013 Records in this area have been kept since 1962 Collins Bay Area New record of 37.2 Old record of 31.5 set in 2013 Records in this area have been kept since 1972 Coronach Area New record of 34.8 Old record of 33.0 set in 2003 Records in this area have been kept since 1961 Cypress Hills (Provincial Park) Area New record of 32.6 Old record of 30.0 set in 1990 Records in this area have been kept since 1918 Elbow Area New record of 34.2 Old record of 32.4 set in 2003 Records in this area have been kept since 1955 Humboldt Area New record of 34.0 Old record of 32.2 set in 1944 Records in this area have been kept since 1904 Key Lake Area New record of 36.7 Old record of 30.6 set in 2013 Records in this area have been kept since 1976 Kindersley Area New record of 37.8 Old record of 36.7 set in 1944 Records in this area have been kept since 1942 La Ronge Area New record of 33.8 Old record of 30.6 set in 1976 Records in this area have been kept since 1923 Last Mountain Lake (Sanctuary) Area New record of 33.9 Old record of 32.0 set in 1990 Records in this area have been kept since 1975 Leader Area New record of 38.5 Old record of 37.2 set in 1936 Records in this area have been kept since 1924 Lucky Lake Area New record of 35.0 Old record of 30.0 set in 1976 Records in this area have been kept since 1972 Maple Creek Area New record of 37.6 Old record of 34.4 set in 1937 Records in this area have been kept since 1915 Meadow Lake Area New record of 34.2 Old record of 28.6 set in 2013 Records in this area have been kept since 1959 North Battleford Area New record of 35.5 Old record of 32.2 set in 1914 Records in this area have been kept since 1879 Prince Albert Area New record of 33.2 Old record of 32.2 set in 1885 Records in this area have been kept since 1884 Rockglen Area New record of 33.7 Old record of 30.7 set in 2003 Records in this area have been kept since 1970 Rosetown Area New record of 36.4 Old record of 33.9 set in 1937 Records in this area have been kept since 1913 Saskatoon Area New record of 35.4 Old record of 33.9 set in 1962 Records in this area have been kept since 1900 Scott Area New record of 35.5 Old record of 32.8 set in 1948 Records in this area have been kept since 1911 Southend Reindeer Area New record of 35.6 Old record of 31.5 set in 2013 Records in this area have been kept since 1938 Stony Rapids Area New record of 38.5 Old record of 31.8 set in 2013 Records in this area have been kept since 1960 Swift Current Area New record of 35.2 Old record of 33.9 set in 1937 Records in this area have been kept since 1885 Waskesiu Lake Area New record of 32.6 Old record of 28.9 set in 2013 Records in this area have been kept since 1966 Watrous Area New record of 33.4 Old record of 30.0 set in 1988 Records in this area have been kept since 1953 Wynyard Area New record of 32.5 Old record of 29.8 set in 1988 Records in this area have been kept since 1964 Note: the temperature records reported here have been derived from a selection of historical stations in each geographic area that were active during the period of record. Please note that this summary may contain preliminary or unofficial information and does not constitute a complete or final report. End/PASPC -
Tomorrow will be mostly cloudy and unseasonably cool. Showers remain possible. The temperature will struggle to reach 70° in New York City and could fall just short of it. The last time the temperature rose no higher than the 60s in Central Park during July occurred on July 25, 2013 when the temperature peaked at 68°. Before that, the last such day was July 8, 2005. Sunday will be variably cloudy and warmer. There could be a brief push of very warm air into the region early next week. Out West, the air mass responsible for the unprecedented Pacific Northwest heatwave moved farther north and east in Canada. Numerous record high temperatures were broken in Saskatchewan. Preliminary high temperatures included: Meadow Lake, SK: 96° (old record: 85°, 1978) Regina: 95° (old record: 93°, 1886) Rosetown, SK: 103° (old record: 88°, 2013) Saskatoon, SK: 105° (old record: 92°, 1986) Uranium City, SK: 92° (old record: 88°, 2013) Climate change has increased the frequency, magnitude, and duration of extreme heat events in the United States and worldwide. Climate change has increased the frequency, magnitude, and duration of extreme heat events in the United States and worldwide. Further increases are likely in coming decades as the world's climate continues to warm. The ENSO Region 1+2 anomaly was +0.2°C and the Region 3.4 anomaly was 0.0°C for the week centered around June 23. For the past six weeks, the ENSO Region 1+2 anomaly has averaged -0.17°C and the ENSO Region 3.4 anomaly has averaged -0.20°C. Neutral ENSO conditions will likely prevail through August. The SOI was +25.73 today. The preliminary Arctic Oscillation (AO) figure was -0.553 today. On June 30 the MJO was in Phase 2 at an amplitude of 1.370 (RMM). The June 29-adjusted amplitude was 1.604 (RMM). In late April, the MJO moved through Phase 8 at an extreme amplitude (+3.000 or above). Only February 25, 1988 and March 18-19, 2015 had a higher amplitude at Phase 8. Both 1988 and 2015 went on to have an exceptionally warm July-August period. July-August 1988 had a mean temperature of 79.1°, which ranked 4th highest for that two-month period. July-August 2015 had a mean temperature of 78.9°, which ranked 5th highest for that two-month period. September 2015 was also the warmest September on record. The MJO's extreme passage through Phase 8 could provide the first hint of a hot summer. Since 1896, 76% of years that saw Phoenix reach 115° or above in June, as occurred this year, had a warmer than July-August in the Middle Atlantic region. The ratio of top 30 July-August temperatures relative to bottom 30 temperatures was 6:1 in favor of the warmth. Overall, the ingredients continue to fall into place for a warmer than normal to potentially hot summer.
-
Occasional Thoughts on Climate Change
donsutherland1 replied to donsutherland1's topic in Climate Change
The Republican Party will use the filibuster to block such reform. Of course, the filibuster will also be deployed to thwart robust climate change legislation. -
Historic Pacific Northwest Heatwave of 2021
donsutherland1 replied to donsutherland1's topic in Climate Change
Excerpts from the World Meteorological Organization: An exceptional and dangerous heatwave is baking the Northwestern USA and Western Canada in areas which are more synonymous with the cold. Temperatures have reached more than 45.0°C on consecutive days, with extremely warm nights in between… These early summer hot weather conditions are taking place in human-induced climate change background, with global temperatures are already 1.2°C higher than the pre-industrial levels. “Heatwaves are becoming more frequent and intense as greenhouse gas concentrations lead to a rise in global temperatures. We are also noticing that they are starting earlier and ending later and are taking an increasing toll on human health,” said Omar Baddour, Head of WMO’s Climate Monitoring and Policy Division. Nikos Christidis is a climate scientist with the UK’s Met Office. He said: “Without human-induced climate change, it would have been almost impossible to hit such record-breaking mean June temperatures in the Western United States as the chances of natural occurrence is once every tens of thousands of years. In the present-day climate getting an extremely hot June is common and is likely to occur twice in three decades. However, an analysis from many computer models suggests that by the end of the century these extreme temperatures are more likely than not. Human influence is estimated to have increased the likelihood of a new record several thousand times,” he said. https://public.wmo.int/en/media/news/june-ends-exceptional-heat -
Occasional Thoughts on Climate Change
donsutherland1 replied to donsutherland1's topic in Climate Change
ExxonMobil’s efforts to corrupt policy making are damaging to the national welfare. I suspect that the video is just the tip of the proverbial iceberg. There’s a lot more going on beneath the radar of public scrutiny (funding climate change denial organizations, campaign contributions to targeted members of the House and Senate, collaboration with illiberal ideological elements, etc.). -
Historic Pacific Northwest Heatwave of 2021
donsutherland1 replied to donsutherland1's topic in Climate Change
Weather summary for Saskatchewan issued by Environment Canada at 3:55 a.m. CST Friday 2 July 2021. Discussion. The following areas set a daily maximum temperature record on July 1, 2021: Assiniboia Area (Assiniboia Airport) New record of 33.7 Old record of 31.5 set in 1985 Records in this area have been kept since 1965 Buffalo Narrows Area (Buffalo Narrows (AUT)) New record of 34.0 Old record of 31.0 set in 2013 Records in this area have been kept since 1962 Collins Bay Area (Collins Bay Sk) New record of 37.2 Old record of 31.5 set in 2013 Records in this area have been kept since 1972 Coronach Area (Coronach SPC) New record of 34.8 Old record of 33.0 set in 2003 Records in this area have been kept since 1961 Cypress Hills (Provincial Park) Area (Cypress Hills Park) New record of 32.6 Old record of 30.0 set in 1990 Records in this area have been kept since 1918 Elbow Area (Elbow CS) New record of 34.2 Old record of 32.4 set in 2003 Records in this area have been kept since 1955 Key Lake Area (Key Lake) New record of 36.7 Old record of 30.6 set in 2013 Records in this area have been kept since 1976 Kindersley Area (Kindersley A) New record of 37.8 Old record of 36.7 set in 1944 Records in this area have been kept since 1942 La Ronge Area (La Ronge RCS) New record of 33.8 Old record of 30.6 set in 1976 Records in this area have been kept since 1923 Last Mountain Lake (Sanctuary) Area (Last Mountain CS) New record of 33.9 Old record of 32.0 set in 1990 Records in this area have been kept since 1975 Leader Area (Leader Airport) New record of 38.5 Old record of 37.2 set in 1936 Records in this area have been kept since 1924 Lucky Lake Area (Lucky Lake) New record of 35.0 Old record of 30.0 set in 1976 Records in this area have been kept since 1972 Maple Creek Area (Maple Creek) New record of 37.6 Old record of 34.4 set in 1937 Records in this area have been kept since 1915 Meadow Lake Area (Meadow Lake) New record of 34.2 Old record of 28.6 set in 2013 Records in this area have been kept since 1959 North Battleford Area (North Battleford RCS) New record of 35.5 Old record of 32.2 set in 1914 Records in this area have been kept since 1879 Prince Albert Area (Prince Albert Glass Field) New record of 33.2 Old record of 32.2 set in 1885 Records in this area have been kept since 1884 Rockglen Area (Rockglen (AUT)) New record of 33.7 Old record of 30.7 set in 2003 Records in this area have been kept since 1970 Rosetown Area (Rosetown East) New record of 36.4 Old record of 33.9 set in 1937 Records in this area have been kept since 1913 Saskatoon Area (Saskatoon RCS) New record of 35.4 Old record of 33.9 set in 1962 Records in this area have been kept since 1900 Scott Area (Scott CDA) New record of 35.5 Old record of 32.8 set in 1948 Records in this area have been kept since 1911 Southend Reindeer Area (Southend) New record of 35.6 Old record of 31.5 set in 2013 Records in this area have been kept since 1938 Stony Rapids Area (Stony Rapids) New record of 38.5 Old record of 31.8 set in 2013 Records in this area have been kept since 1960 Swift Current Area (Swift Current CDA) New record of 35.2 Old record of 33.9 set in 1937 Records in this area have been kept since 1885 Waskesiu Lake Area (Waskesiu Lake) New record of 32.6 Old record of 28.9 set in 2013 Records in this area have been kept since 1966 Watrous Area (Watrous East) New record of 33.4 Old record of 30.0 set in 1988 Records in this area have been kept since 1953 Wynyard Area (Wynyard (AUT)) New record of 32.5 Old record of 29.8 set in 1988 Records in this area have been kept since 1964 Note: the temperature records reported here have been derived from a selection of historical stations in each geographic area that were active during the period of record. Please note that this summary may contain preliminary or unofficial information and does not constitute a complete or final report. End/PASPC -
Historic Pacific Northwest Heatwave of 2021
donsutherland1 replied to donsutherland1's topic in Climate Change
Weather summary for Manitoba issued by Environment Canada at 4:05 a.m. CDT Friday 2 July 2021. Discussion. The following areas set or tied a daily maximum temperature record on July 1, 2021: Churchill Area (Churchill Climate) New record of 34.1 Old record of 31.1 set in 1976 Records in this area have been kept since 1929 Gillam Area (Gillam A) Tied record of 34.4 set in 1989 Records in this area have been kept since 1943 Lynn Lake Area (Lynn Lake RCS) New record of 38.0 Old record of 30.4 set in 1981 Records in this area have been kept since 1952 Steinbach Area (Kleefeld (MAFRI)) New record of 30.9 Old record of 30.0 set in 1989 Records in this area have been kept since 1956 Swan River Area (Swan River RCS) New record of 33.4 Old record of 33.0 set in 1981 Records in this area have been kept since 1960 Thompson Area (Thompson A) New record of 34.7 Old record of 33.1 set in 1989 Records in this area have been kept since 1966 Note: the temperature records reported here have been derived from a selection of historical stations in each geographic area that were active during the period of record. Please note that this summary may contain preliminary or unofficial information and does not constitute a complete or final report. End/PASPC -
Historic Pacific Northwest Heatwave of 2021
donsutherland1 replied to donsutherland1's topic in Climate Change
Weather summary for Alberta issued by Environment Canada at 4:06 a.m. MDT Friday 2 July 2021. Discussion. The following areas set a daily maximum temperature record on July 1, 2021: Athabasca Area New record of 35.1 Old record of 33.3 set in 1924 Records in this area have been kept since 1900 Banff Area New record of 35.6 Old record of 31.6 set in 2013 Records in this area have been kept since 1887 Barrhead Area New record of 36.5 Old record of 34.4 set in 1924 Records in this area have been kept since 1912 Bow Island Area New record of 37.0 Old record of 32.4 set in 2017 Records in this area have been kept since 1961 Bow Valley (Provincial Park) Area New record of 37.6 Old record of 30.4 set in 2013 Records in this area have been kept since 1928 Breton Area New record of 35.0 Old record of 28.3 set in 1942 Records in this area have been kept since 1939 Brooks Area New record of 37.3 Old record of 33.9 set in 1924 Records in this area have been kept since 1912 Calgary Area New record of 36.3 Old record of 32.8 set in 1924 Records in this area have been kept since 1881 Camrose Area New record of 33.5 Old record of 32.8 set in 1924 Records in this area have been kept since 1921 Cardston Area New record of 35.4 Old record of 31.0 set in 1985 Records in this area have been kept since 1918 Claresholm Area New record of 36.6 Old record of 32.0 set in 1985 Records in this area have been kept since 1951 Cold Lake Area New record of 34.8 Old record of 29.7 set in 2013 Records in this area have been kept since 1952 Coronation Area New record of 37.2 Old record of 33.3 set in 1924 Records in this area have been kept since 1912 Crowsnest Area New record of 33.8 Old record of 29.5 set in 1987 Records in this area have been kept since 1965 Drumheller Area New record of 38.8 Old record of 33.3 set in 1977 Records in this area have been kept since 1923 Edmonton (int'l Aprt) Area New record of 32.9 Old record of 27.4 set in 2013 Records in this area have been kept since 1959 Elk Island (National Park) Area New record of 32.7 Old record of 29.1 set in 2013 Records in this area have been kept since 1966 Esther Area New record of 38.8 Old record of 29.8 set in 2003 Records in this area have been kept since 1985 Fort Chipewyan Area New record of 36.1 Old record of 32.2 set in 1926 Records in this area have been kept since 1883 Fort Mcmurray Area New record of 37.9 Old record of 35.0 set in 1924 Records in this area have been kept since 1908 Hendrickson Creek Area New record of 31.6 Old record of 30.1 set in 2013 Records in this area have been kept since 1995 High River Area New record of 36.3 Old record of 30.0 set in 1924 Records in this area have been kept since 1913 Highvale Area New record of 35.9 Old record of 28.5 set in 2013 Records in this area have been kept since 1977 Jasper Area New record of 39.4 Old record of 33.9 set in 1924 Records in this area have been kept since 1916 Lethbridge Area New record of 37.9 Old record of 33.9 set in 1904 Records in this area have been kept since 1902 Lloydminster Area New record of 34.4 Old record of 30.6 set in 1928 Records in this area have been kept since 1904 Medicine Hat Area New record of 39.5 Old record of 35.4 set in 1990 Records in this area have been kept since 1883 Lac La Biche Area New record of 33.9 Old record of 29.5 set in 2013 Records in this area have been kept since 1944 Mildred Lake Area New record of 38.2 Old record of 33.1 set in 2013 Records in this area have been kept since 1965 Milk River Area New record of 36.7 Old record of 31.9 set in 2017 Records in this area have been kept since 1994 Nordegg Area New record of 35.6 Old record of 31.7 set in 1924 Records in this area have been kept since 1915 Onefour Area New record of 37.7 Old record of 36.0 set in 1990 Records in this area have been kept since 1928 Pincher Creek Area New record of 35.0 Old record of 32.2 set in 1904 Records in this area have been kept since 1893 Red Earth Creek Area New record of 37.8 Old record of 32.4 set in 2013 Records in this area have been kept since 1994 Rocky Mountain House Area New record of 34.9 Old record of 30.6 set in 1942 Records in this area have been kept since 1915 Slave Lake Area New record of 35.7 Old record of 31.1 set in 2013 Records in this area have been kept since 1922 Stettler Area New record of 36.2 Old record of 29.0 set in 1977 Records in this area have been kept since 1918 Stony Plain Area New record of 34.8 Old record of 27.6 set in 2013 Records in this area have been kept since 1966 Strathmore Area New record of 35.3 Old record of 32.2 set in 1918 Records in this area have been kept since 1912 Sundre Area New record of 35.2 Old record of 28.2 set in 2013 Records in this area have been kept since 1993 Taber Area New record of 36.0 Old record of 33.0 set in 1990 Records in this area have been kept since 1947 Vegreville Area New record of 33.7 Old record of 30.0 set in 1940 Records in this area have been kept since 1918 Wainwright Area New record of 35.9 Old record of 30.5 set in 1977 Records in this area have been kept since 1966 Waterton Park Area New record of 34.4 Old record of 30.0 set in 1985 Records in this area have been kept since 1976 Note: the temperature records reported here have been derived from a selection of historical stations in each geographic area that were active during the period of record. Please note that this summary may contain preliminary or unofficial information and does not constitute a complete or final report. End/PASPC -
Historic Pacific Northwest Heatwave of 2021
donsutherland1 replied to donsutherland1's topic in Climate Change
Some other recent notable heat events: June 2019: Europe July 2019: Europe (Paris hit 108 during this event) Summer 2019 in Alaska Summer 2020 in the Southwest (Death Valley hit 130 and Phoenix had its most 100-degree, 105-degree, 110-degree, and 115-degree temperatures on record) -
Historic Pacific Northwest Heatwave of 2021
donsutherland1 replied to donsutherland1's topic in Climate Change
No disaster will be large enough to break through the denier crowd. Their denial of climate change is an article of faith. What’s needed is a critical mass of political leaders who have the courage to do what’s needed and the foresight to distinguish the big long-term issues from short-term considerations that divert them from addressing the latter. -
Morning thoughts... It will be mostly cloudy and somewhat cooler today. Showers and some heavy thunderstorms are possible, especially during the afternoon and evening hours. Temperatures will likely reach the upper 70s and lower 80s in most places today. Likely high temperatures around the region include: New York City (Central Park): 77° Newark: 83° Philadelphia: 80° Normals: New York City: 30-Year: 83.9°; 15-Year: 84.3° Newark: 30-Year: 86.3°; 15-Year: 86.7° Philadelphia: 30-Year: 87.3°; 15-Year: 87.8° The weekend will start off on an unseasonably cool note. The temperature could remain in the 60s tomorrow in New York City. The last July day with a maximum temperature below 70° at Central Park was July 25, 2013 when the thermometer topped out at 68°.
-
Historic Pacific Northwest Heatwave of 2021
donsutherland1 replied to donsutherland1's topic in Climate Change
Weather summary for British Columbia issued by Environment Canada at 5:27 p.m. PDT Thursday 1 July 2021. Discussion. The following areas will have set a daily maximum temperature record on July 1, 2021: Blue River Area (Blue River CS) Preliminary new record of 36.9 Old record of 34.3 set in 2013 Records in this area have been kept since 1946 Creston Area (Creston Campbell Scientific) Preliminary new record of 38.8 Old record of 35.5 set in 2013 Records in this area have been kept since 1912 Golden Area (Golden Airport) Preliminary new record of 37.5 Old record of 35.6 set in 1940 Records in this area have been kept since 1902 Kelowna Area (Kelowna UBCO) Preliminary new record of 38.8 Old record of 36.9 set in 1987 Records in this area have been kept since 1899 Nakusp Area (Nakusp CS) Preliminary new record of 39.4 Old record of 34.1 set in 2006 Records in this area have been kept since 1966 Nelson Area (Nelson CS) Preliminary new record of 39.3 Old record of 35.0 set in 1924 Records in this area have been kept since 1904 Osoyoos Area (Osoyoos CS) Preliminary new record of 37.6 Old record of 36.6 set in 2008 Records in this area have been kept since 1954 Penticton Area (Penticton A) Preliminary new record of 38.0 Old record of 36.6 set in 1987 Records in this area have been kept since 1907 Sparwood Area (Sparwood CS) Preliminary new record of 35.0 Old record of 32.3 set in 2013 Records in this area have been kept since 1969 Summerland Area (Summerland CS) Preliminary new record of 39.3 Old record of 36.5 set in 1987 Records in this area have been kept since 1907 Trail Area (Warfield RCS) Preliminary new record of 40.0 Old record of 35.6 set in 1942 Records in this area have been kept since 1928 Yoho (National Park) Area (Yoho Park) Preliminary new record of 35.0 Old record of 31.7 set in 1924 Records in this area have been kept since 1923 Note: the temperature records reported here have been derived from a selection of historical stations in each geographic area that were active during the period of record. Please note that this summary may contain preliminary or unofficial information and does not constitute a complete or final report. End/PSPC -
Through 11 pm, Bridgeport had picked up 1.30” of rain. That broke the daily record of 1.08”, which was set in 1971.
-
Historic Pacific Northwest Heatwave of 2021
donsutherland1 replied to donsutherland1's topic in Climate Change
Here’s a great calculator for converting z-scores into probabilities: https://www.fourmilab.ch/rpkp/experiments/analysis/zCalc.html Like you, I fully expect the odds of these events to increase as the global climate continues to warm. It’s possible that the extent of extremes is not linear to the extent of warming e.g., each degree rise will result in an increase in both the magnitude of extremes and reduction in return time that is larger than the overall change in temperature (probably now a power relationship but something greater than a linear one).


